© 2004 Museu de Ciències Naturals ISSN: 1578–665X
Haas, T. C., 2004. Ecosystem management via interacting models of political and ecological processes. Animal Biodiversity and Conservation, 27.1: 231–245.
Abstract
Ecosystem management via interacting models of political and ecological processes.— The decision to implement environmental protection options is a political one. Political realities may cause a country to not heed the most persuasive scientific analysis of an ecosystem’s future health. A predictive understanding of the political processes that result in ecosystem management decisions may help guide ecosystem management policymaking. To this end, this article develops a stochastic, temporal model of how political processes influence and are influenced by ecosystem processes. This model is realized in a system of interacting influence diagrams that model the decision making of a country’s political bodies. These decisions interact with a model of the ecosystem enclosed by the country. As an example, a model for Cheetah (Acinonyx jubatus) management in Kenya is constructed and fitted to decision and ecological data.
Key words: Social systems, Ecological systems, Influence diagrams. Resumen
Gestión de ecosistemas mediante modelos interactivos de procesos políticos y ecológicos.— La decisión de implementar opciones de protección medioambiental es de carácter político. Las realidades políticas de un país pueden permitir ignorar los análisis científicos más rotundos acerca de la futura salud de un ecosistema. Una comprensión predictiva de los procesos políticos que conducen a la toma de decisiones sobre la gestión de los ecosistemas puede contribuir a orientar las políticas relativas a dichas áreas. Con este objetivo, el presente artículo desarrolla un modelo estocástico temporal acerca de cómo los procesos políticos influyen y son influidos por los procesos de los ecosistemas. Dicho modelo se ha estructurado a partir de un sistema de diagramas de influencia interactivos que configuran la toma de decisiones de las instituciones políticas de un país. Dichas decisiones interactúan con un modelo del ecosistema presente en el país. Así, a modo de ejemplo, se elabora un modelo para la gestión del guepardo (Acinonyx jubatus) en Kenia, ajustándose a los datos ecológicos y de toma de decisiones.
Palabras clave: Sistemas sociales, Sistemas ecológicos, Diagramas de influencia.
Timothy C. Haas, School of Business Administration, Univ. of Wisconsin at Milwaukee, P. O. Box 742, Milwaukee, WI 53201, U.S.A.
Ecosystem mana gement
via interacting models of
political and ecological processes
them achieve these goals. This view of the policy making process is particularly relevant for studying wildlife management in developing countries: as Gibson (1999, pp. 9–10) states "New institutional-ists provide tools useful to the study of African wildlife policy by placing individuals, their prefer-ences, and institutions at the center of analysis. They begin with the assumption that individuals are rational, self–interested actors who attempt to se-cure the outcome they most prefer. Yet, as these actors search for gains in a highly uncertain world, their strategic interactions may generate subopti-mal outcomes for society as a whole. Thus, rational individuals can take actions that lead to irrational social outcomes." New institutionalism is not lim-ited to explaining ecosystem management policymaking in developing countries. Healy & Ascher (1995) document the effect that individual actor goal seeking behavior had on how analytical ecosystem health models were used to manage national forests in the United States during the 1970s, ’80s, and ’90s.
Another paradigm for political decision making is the descriptive model (see Vertzberger, 1990). This approach emphasizes that humans can only reach decisions based on their internal, perceived models of other actors in the decision making situation. These internal models may in fact be inaccurate portrayals of the capabilities and inten-tions of these other actors.
The ecosystem model component of the EMS described in Haas (2001) can be extended to syn-thesize these two policy making paradigms. In Haas (2001), the ecosystem model is expressed as an influence diagram (ID) (see the online tutorial, Haas (2003b) for an introduction to IDs). To incorporate the interaction between groups and the ecosystem, a set of IDs are constructed, one for each group, and one for the ecosystem. Then, optimal decisions computed by each of these group IDs through time are allowed to interact with the solution history of the ecosystem ID. The model that emerges from the interactions of the group IDs and the ecosystem ID is called an interacting influence diagrams (IntIDs) model. In this model, each group makes decisions that they perceive will further their individual goals. Each of these groups however, has a perceived, possibly inaccurate internal model of the ecosys-tem and the other groups. The IntIDs model ap-proach then, synthesizes insights from political eco-nomics (groups acting to maximize their own utility functions) and descriptive decision making theory (groups using —possibly— distorted internal mod-els of other groups to reach decisions).
By choosing from a pre–determined repertoire of options, each group implements the option that maximizes a multiobjective (multiple goals) utility function. This is accomplished by having each group’s ID contain a decision option node repre-senting the different actions that the group can take. Each group has an overall goal satisfaction node (hereafter, a utility node) that is influenced by the group’s goals. Each group implements an op-I nt roduc t ion
Ultimately, the decision to implement ecosystem protection policies is a political one. Currently, the majority of ecosystem management research is concerned with ecological and/or physical proc-esses. A management option that is suggested by examining the output of these models and/or data analyses may not be implemented unless the op-tion addresses the goals of each involved social group (hereafter, group).
For example, Francis & Regier (1995) describe efforts to sustain the Great Lakes ecosystem. These authors identify the following major barriers to the sustainable management of this ecosystem:
1. Social science research and model building is restricted by research funding decisions to "safe" projects – typically the economic benefits of Great Lakes resource utilization. These authors see a strong need for social science research to under-stand the goals and restrictions that drive the many groups that advise, regulate, pollute, and advocate for the Great Lakes ecosystem.
2. Great Lakes physical and biological science is University department compartmentalized and hence ecosystem models that integrate limnological and terrestrial subsystems are under–developed.
3. Because of (2), science–based management policies are lacking in their reliability and hence are either ignored, corrupted or, at best have limited impact during the political process of negotiating treaties between Canada and the U.S. for the regu-lation of pollution, fishing, and recreation on the Great Lakes.
As a step towards meeting these needs, an Ecosystem Management System (EMS) is described herein that links political processes and goals to ecosystem processes and ecosystem health goals. This system is used to identify first the set of ecosystem management policies that have a realis-tic chance of being accepted by all involved groups, and then, within this set, those policies that are most beneficial to the ecosystem. Haas (2001) gives one way of defining the main components, workings, and delivery of an EMS. The central component of this EMS is a quantitative, stochastic, and causal model of the ecosystem being managed (hereafter, the EMS model). The other components are (2) links to data streams, (3) freely–available software for performing all ecosystem management computations and displays, and (4) a web–based archive and delivery system for items 1–3.
tion that maximizes the expected value of its utility node. This is called evaluating the ID (see Nilsson & Lauritzen, 2000). A schematic of the architecture of an IntIDs model is given in figure 1.
As new types of actions are observed, the fixed repertoire of actions is periodically enlarged and the EMS model is re–fitted to the entire set of actions observations —see the Parameter Estima-tion with CA secEstima-tion, below.
Ecosystem management emerges as each group implements management actions that best satisfy its goals conditional on the actions of the other groups and the ecosystem’s status. Conditional on these implemented management options, the mar-ginal distributions of all ecosystem status variables are updated. By simulating these between–group and group–to–ecosystem interactions many years into the future, predictions of future ecosystem status can be computed.
Ecosystem status, state, or health (hereafter status) is a multidimensional concept and has been defined differently depending on those ecosystem characteristics of most interest to the analyst. This article focuses on the status of an endangered species within an ecosystem. One way to quantify this characteristic is with the number of animals of such a species in the ecosystem at a particular spatio–temporal point.
Kelly & Durant (2000) identify the cheetah in East Africa as an endangered species. The exam-ple given below of cheetah survivability in Kenya contains count variables for cheetah, and cheetah prey (herbivores having a biomass less than 35 kg). Future extensions of this model will have variables for individual cheetah prey herbivores such as Thomson’s gazelle.
An output of the EMS model is the probability distribution on each of these counts by region and time point. These distributions are used to compute a typical measure of species survivability: the prob-ability of extinction (POE) defined as the chance of a non–sustainable cheetah count at a specified spatial location and future point in time.
The uses and benefits of an EMS that combines both political and ecological processes are
:
(1) a (possibly empty) set of ecosystem management poli-cies can be found that are both politically acceptable and effective at protecting the ecosystem; (2) the most likely sequence of future management activi-ties can be identified so that more plausible predic-tions of future ecosystem status can be computed such as extinction probabilities; and (3) international audiences can predict which countries have any chance of reaching ecosystem status goals such as averting the extinction of an endangered species.Because this modeling effort draws on several disciplines, the goals that are driving the model’s development need to be clearly stated. They are (in order of priority):
1. Usability: develop a model that, because of its predictive and construct validity, contributes to the ecosystem management debate by delivering reli-able insight into how groups reach ecosystem
man-agement decisions, what strategies are effective in influencing these decisions, and how ecosystems respond to management actions.
2. Clarity and accessibility: develop a model that can be exercised and understood by as wide a range of users as possible. Such users will mini-mally need to be literate and have either direct access to the EMS website or access to a printed copy of the EMS report. For the cheetah viability example below, all groups except rural residents and pastoralists meet these minimum requirements. A major challenge will be to bring the contents of the EMS report to groups that are illiterate and/or lack web access. One idea is to deliver the EMS report to any literate members of such groups, e.g. schoolteachers.
There is a tension between predictive and con-struct validity in that the development of a model rich enough in structure to represent theories of group decision making and ecosystem dynamics can easily become overparameterized which in–turn can reduce its predictive performance. The approach taken here is to develop as simple a model as is faithful to theories of group decision making and ecosystem dynamics —followed by a fit of this model to data so as to maximize its predictive performance. Specifically, success in the model build-ing effort presented herein will be measured along the following two dimensions: (1) the model’s one–
Fig. 1. Schematic of the IntIDs model of interacting political and ecological processes. Fig. 1. Diagrama esquemático del modelo de IntIDs (diagramas de influencia interactivos) para los procesos interactivos de carácter ecológico y político.
Environmen-tal Protection
Agency ID President
ID
Ecosystem ID
Legislature ID
Action Message Bulletin Board
Ranchers ID Pastoralists
ID Rural
step–ahead prediction error rate wherein at every step, the model is refitted with all available data up to that step; and (2) the degree to which the model’s internal structure (variables and inter–variable rela-tionships) agrees with theories of group behavior and ecology/population dynamics theories. The first dimension measures predictive validity and the sec-ond, construct validity.
One step ahead predictive validity is seen as essential to establishing the reliability of the EMS model. Such predictive validity is however, not without its challenges. For example, it is possible that once an EMS model becomes known to the groups it is modeling, these groups may alter their behavior in response to model predictions. This Heisenberg Principle effect would invalidate model predictions.
The influence of groups attempting to game EMS model predictions could be represented in the EMS model by adding another group called "the modelers." This group would post EMS model pre-dictions to the bulletin board at every time step for all other groups to read. Once evidence on how model predictions are gamed is observed, such gaming behavior could be included in the group submodels of the EMS model and one step ahead prediction error rates computed as described in the Results section, below. Of course a second level of gaming is possible wherein groups attempt to ma-nipulate an EMS model that includes groups at-tempting to game EMS model predictions. This second level of a Heisenberg Principle effect would be difficult to correct for and no solution is offered at this time.
This article proceeds as follows. The Materials and methods section gives the architecture of a group ID. The Results section applies this frame-work to the management of cheetah in Kenya and describes how the model can be statistically fitted to observations on political and ecosystem vari-ables represented in the model. Conclusions are drawn in the Discussion section along with brief comparisons with related efforts.
M a t e ria ls a nd m e t hods Group ID architecture Overview
A group’s ID is partitioned into subsets of con-nected nodes called the Situation, and Scenario subIDs (see figure 2 in Haas 2003a, Section 2). The Situation subID is the group’s internal repre-sentation of the state of the decision situation and contains Situation state nodes. Conditional on what decision option is chosen, the Scenario subID is the group’s internal representation of what the future situation (the Scenario) will be like after a proposed option is implemented. See Haas (1992, 2003a) for the cognitive theory that supports this decision making model architecture.
Actors, actions, and the time node
A decision option will hereafter be referred to as an action. Groups interact with each other and the ecosystem by executing actions. The decision mak-ing group, referred to as the DM_group receives an input action that is executed by an actor referred to as the input–action–actor group or InAc_group. The subject of this action is the input–action–subject group or InS_group (which may or may not be the DM_group). The DM_group implements an output action whose subject is the target group or T_group. Actions are either verbal (message) or physical events that include all inter– and intra–country interactions. Each ID is a dynamic model and therefore has a deterministic root node Time. Time starts at t0 and increments discretely through t1, ..., tT in steps of t. Ecosystem status perceptions nodes
Quantities that represent ecosystem status can be input nodes to a group ID. These nodes influence a node that represents how sensitive the group is to the value of the corresponding ecosystem status node. The idea is that a group is affected by the ecosystem but is only conscious of it through fil-tered, perceptual functions of the underlying eco-system status nodes. For example, a group ID is sensitive to the presence of a land animal such as the cheetah through the animal’s density (number per hectare). This sensitivity is modeled by having the animal’s density node influence a perceived animal prevalence node that takes on the values none, few, and many.
An ecosystem status node is stochastic due to it being a component of a stochastic ecosystem model. Sources of noise within this model include climate, unmodeled or mismodeled ecological functions, and inaccurate specification of model parameters.
Therefore, a separate node within each group ID is seen as necessary to capture both the more coarse resolution of perceptual models of continu-ously–valued quantities and the unique sources of stochasticity characteristic of perceptual processing. Image nodes
A set of dimensions that defines the DM_group’s image of another group is needed. Two such dimen-sions, Affect and Relative Power appear in many studies of political belief systems. Affect varies over the enemy–neutral–ally–self dimension (Murray & Cowden, 1999; Hudson, 1983, chs. 2–4). Relative Power varies over the weaker–parity–stronger dimen-sion. The Affect dimension’s self category is needed because the subject of an InAc_group’s action may be the DM_group itself. This self category includes the DM_group’s audiences (see below).
Economic, militaristic and institutional goals This model is based on the cognitive–theoretic as-sumption that a group evaluates an input action directly on its perceived immediate and future im-pacts on economic, militaristic, and institutional goals. The two militaristic goals of Defend Country (inter– country), and Maintain Domestic Order (intra–coun-try) are lumped into one Militaristic goal node.
Economic and militaristic goal status is computed with a two–step process: first an assessment is made of how the input or output action changes economic or military resource amounts; then, an assessment is made of how these new resource levels affect the associated economic or militaristic goal.
Here, only one institutional goal is modeled: Maintain Political Power. This goal is solely de-pendent on maintaining the contentment of several important audiences, discussed below.
A goal node is a binary–valued random variable with values not–satisfied and satisfied. A goal node is similar to a utility variable in political economics. The nodes that affect these utility judgements are the DM_group’s InAc_group and InS_group image nodes, and the nodes representing the input ac-tion’s immediate and future impact on the DM_group’s resources.
Scenario goals are influenced by Situation goals —if an output action does not cause a resource or audience node change, the Scenario goal’s distri-bution is the same as the corresponding Situation goal’s distribution.
Audience effects
The influence of audiences on a decision maker is described by research that suggests perceptions of present and future reactions of important audiences have effects on decision making and bargaining, see Asch (1951), Festinger (1957), Milgram (1974), Rubin & Brown (1975), and Partell & Palmer (1999). An input action’s impact on an audience is modeled as a function of the action’s perceived effect on
audience demands. For example, an important au-dience for (former) President Moi of Kenya was his ethnic group, the Kalenjin (Throup & Hornsby, 1998, p. 8). President Moi knew that only actions that brought benefits to that group would be favorably received by them.
The effects of perceived audience reactions to input actions is modeled by having input action characteristics influence Audience Demands Satis-faction Change nodes which in turn, influence Audi-ence Contentment nodes. What demands an audi-ence has and the effect of different input actions on the satisfaction of those demands are both repre-sented by the conditional distributions of the Audi-ence Demands Satisfaction Change nodes.
Say that the DM_group ID has k important audiences and consider the ith such audience. Let
the node CAi(St) denote the perceived change in
audience i’s demands satisfaction level due to an input action. CAi(St) takes on the values decreased,
no change, and increased. Let the node Ai(St)
de-note the perceived contentment level of audience i. Ai(St) takes on the values discontented, and
con-tented. Likewise, in the Scenario subID, output action characteristics influence Audience Content-ment nodes through the Audience Demands Satis-faction Change nodes. These nodes are also influ-enced by input action characteristics.
Situation contentment level influences Scenario contentment: if there is no change to an audience’s contentment level due to the output action, Sce-nario contentment level inherits the Situation’s con-tentment level.
The only goal node influenced by audience con-tentment nodes is the Maintain Political Power goal, GMPP(St) —there is no goal of directly satisfying
audi-ences because the decision maker has no concern for these audiences other than how they affect the decision maker’s hold on political power.
Overall goal satisfaction
Goal prioritization is modeled by a single node representing the DM_group’s overall sense of well– being. This node, denoted by U(St) (Situation) or
U(Sc) (Scenario) is a deterministic function of the
goal nodes wherein the coefficients in this function are interpreted as goal–importance weights and hence are assigned from knowledge of the group’s goal priorities.
Group actions
taxonomies however, lack a set of situation–inde-pendent dimensions for characterizing an action. The approach taken here is to base a set of action characteristics or dimensions on an existing action classification system. The Behavioral Correlates of War (BCOW) classification system is chosen for this extension for two reasons. First, BCOW is designed to support a variety of theoretical view-points (Leng, 1999) and hence can be used to code data that will be used to estimate a model of group decision making that synthesizes realist and cogni-tive processing paradigms of political decision mak-ing —and BCOW is at least as rich a classification system as other systems in the literature. Second, BCOW has coding slots for recording: (i) a detailed description of an action, (ii) inter– and intra–coun-try groups, and (iii) a short history of group interac-tions. This last coding category allows causal rela-tionships to be identified and tracked through time. The BCOW coding scheme consists of a nearly exhaustive list of actions grouped into Military, Dip-lomatic, Economic, Unofficial (intra–country actor), and Verbal categories. The BCOW classification system exhaustively and uniquely characterizes a verbal action into either a comment on an action (Verbal: Action Comment), a statement that an action is intended (Verbal: Action Intent), or a re-quest for an action (Verbal: Action Rere-quest).
Modifications have been made to the BCOW scheme for purposes of categorizing ecosystem management actions. These modifications are as follows. First, the Unofficial Actions category of the BCOW coding system is not needed since groups internal to a country are modeled as having nearly the same range of output actions as a country– level group. Hence, all BCOW Unofficial Actions have been absorbed into one of the other action categories. For example, Hostage Taking, BCOW code 14153 is coded as a Military dimension ac-tion. Second, all BCOW Verbal Actions have been inserted into the BCOW Diplomatic Action cat-egory. Third, because BCOW does not include many actions that are peculiar to ecosystem man-agement, such actions have been added to the BCOW taxonomy at the end of each action cat-egory listing (see Appendix 1, tables A1–A3 at
www.uwm.edu/-haas/ems-cheetah/bcow.pdf).
See Haas (2003a) for descriptions of nodes that determine realistic actor–input action combinations, and realistic target–output action combinations.
A proposed target and output action combination influences target image and action characteristic nodes. These nodes along with Situation goal nodes, influence Scenario goal nodes. Finally, Scenario goal nodes influence the Scenario Overall Goal Satisfaction node. Each target and output action combination is used to compute the expected value of the Overall Goal Satisfaction node. At time t, the output action that maximizes this expected value is designated by coptimal(t).
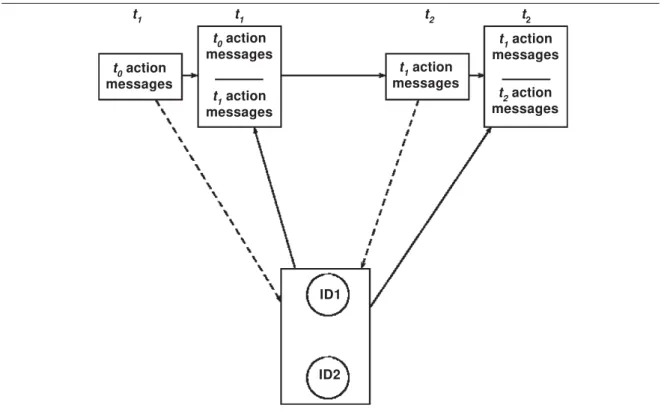
After determining coptimal(t), the DM_group posts to a bulletin board an action–message consisting of the time, the DM_group’s name, the target’s name,
and the BCOW action code. At the next time value, all other groups read this message. Each group assigns the values on the action characteristics associated with the BCOW action code and as-signs values to the InAc_group image and InS_group image nodes. Using these values, each group com-putes an optimal output action and posts it to the bulletin board. When all groups have posted an output action and the ecosystem ID has posted updated distributions on its status nodes, the time variable is incremented by the value of t and the process is repeated (see fig. 2). Note that this protocol allows for feedback loops through time to emerge without need for additional model structure. There are groups that directly affect the ecosys-tem and groups that only indirectly affect the eco-system. Actions by direct–affect groups always have the ecosystem as one of the targets of an output action. When such an action message is read by the ecosystem ID, its effect on the ecosystem is computed. If the action does not affect the ecosys-tem, e.g. a riot by the rural residents of Kenya, then the ecosystem model computes no effect on the ecosystem due to this action.
Target, output action pair effectiveness
The militaristic or economic effectiveness of an output action is determined in–part by its target. To represent this interaction, Scenario nodes are needed to represent the DM_group’s perception of the militaristic effectiveness of a target, output ac-tion pair given an input actor, input acac-tion pair. The nodes MilEf and EconEf take on the values nega-tive effect, no effect, and posinega-tive effect and are influenced by Input Actor, Input Action, Target, and Output Action nodes. MilEf influences the Scenario Maintain Order goal, and EconEf influences Sce-nario Immediate Economic Resources Change.
Group ID hypothesis value assignment
In the Results section, below, Consistency Analysis (CA) is used to fit each ID’s parameters to data. CA requires that each parameter in an ID be assigned an a–priori point value derived from expert opinion and/or subject matter theory. Let H
(j) be such a
value assigned to an ID’s jth parameter. Collect all
of these hypothesis parameter values into the hy-pothesis parameter vector, H. See the Results section, below and Haas (2001, Appendix) for fur-ther discussion of CA.
model. Call this temporally–indexed data set an actions history data set. The action–reaction data set is used in an optimization procedure to find an initial H. The actions history data set is used by a second optimization procedure to refine these initial values. These two optimization steps are described in Haas (2003a, Section 2).
Re sult s
Example: cheetah in Kenya Background
Cheetah preservation is a prominent example of the difficulties surrounding the preservation of a large land mammal whose range extends over several countries. The main threats to cheetah preservation are loss of habitat, cub predation by other carni-vores, and poaching (Gros, 1998; Kelly & Durant, 2000). Kelly & Durant (2000) note that juvenile
survival is reduced by lion predation inside reserves because these reserves are not big enough for cheetah to find areas uninhabited by lions. Over crowding of reserves in Africa is widespread (see O’Connell–Rodwell et al., 2000) and cheetah do not compete well for space with other carnivores (Kelly & Durant, 2000). Gibson (1999, p. 122) finds that the three reasons for poaching are the need for meat, the need for cash from selling animal "tro-phies", and the need to protect livestock.
All input and output files for this example along with the EMS JavaTM based software is available at
www.uwm.edu/
-
haas/ems-cheetah/.ID descriptions
According to Gros (1998) and Gibson (1999, p. 164), the groups that directly affect the cheetah population are ranchers, rural residents, and pastoralists. Presidents, Environmental Protection Agencies (EPAs), legislatures, and courts indirectly affect the cheetah through their influence on these
t
0action
messages
t
0action
messages
t
1action
messages
t
1action
messages
t
1action
messages
t
2action
messages
ID1
ID2
t
1 t1 t2 t2
Fig. 2. Sequential updating scheme of an IntIDs model consisting of two IDs. Bulletin board states are indicated by the boxes in the top row. A dashed arrow indicates messages are read but not removed. A solid arrow indicates message addition.
direct–affect groups. In this EMS model, group IDs are constructed to represent the president of Kenya, the Kenyan EPA, Kenyan rural residents, and Ken-yan pastoralists. These group IDs interact with each other and an ID of the cheetah–supporting ecosystem contained within Kenya.
Hypothesis parameter values for each ID in the EMS model are available at the aforementioned cheetah EMS website under the Current EMS Re-port link. Abbreviations used below are: Pres. presi-dent; EPA. Environmental Protection Agency; RR. Rural residents; Pas. Pastoralists; and Eco. Eco-system. The ecosystem is directly affected only by poaching activities and land clearing. Anti–poach-ing enforcement is directed against either the rural residents or pastoralists and may or may not be effective at reducing poaching activity. Likewise, the creation of a preserve or the opening of an existing preserve to settlement are actions directed against the rural residents and/or pastoralists.
In what follows, each group ID is described and hypothetical action–reaction data sets (tables 1–4) are given that are used to compute each group’s initial H vector (Haa 2003a, Section 2). The heuris-tics listed in www.uwm.edu/
-
haas/ems-cheetah/ heuristics.pdf are used to represent subject matter theory during the first step of this computation.Gibson (1999, pp. 155–156) argues in his case studies of Kenya, Zambia, and Zimbabwe that the president in each of these countries has a different personal priority for protecting ecosystems. Further, presidents of politically unstable countries typically place a high priority on protecting their power and staying in office (Gibson 1999, p. 7). These insights have motivated the following president ID (see www.uwm.edu/
-
haas/ems-cheetah/kenpres.pdf).The president has direct knowledge of rural resi-dent and pastoralist actions. The presiresi-dent receives ecosystem status information exclusively from the EPA. The president’s audiences are campaign do-nors and the military. The president’s goals are to maintain political power and domestic order. The president’s action repertoire is: no changes, create a preserve, request increased antipoaching en-forcement, open a preserve to settlement, and suppress a riot.
EPA perceptions of the ecosystem’s status are represented by the cheetah prevalence and herbiv-ore prevalence nodes. These nodes are influenced by the values of cheetah density, herbivore density, and poaching rate in the ecosystem ID. The EPA’s sole audience is the president. The EPA’s goals are to protect the environment, and to increase the agency’s staff and budget. The latter goal is moti-vated by an examination of the literature on bu-reaucracies. The main postulates of this literature are concisely stated by Ott (1981):
"Managers of public enterprises —e.g. municipal fire departments, public hospitals, the Department of the Interior— have incentive structures much different from their private counterparts. In a private firm the owners create incentives for managers to
maximize the difference between revenues and pri-vate costs. Since the pripri-vate manager has some contingent property rights in the revenue–minus– cost residual, he makes choices that tend to maxi-mize the firm’s and its owners’net worth.
Conversely, in the public sector there is no re-sidual claimant: The public agency’s budget must be exhausted by approved expenditures. If there is a surplus, it is remanded to the general fund and will usually result in a reduction of the agency’s subsequent budgets. Since a surplus cannot ben-efit the agency, there can be no direct benben-efit to the agency of increasing a benefit–cost difference or of reducing the cost of achieving a given benefit level. Thus, broadly speaking, bureaucrats have strong incentives to increase costs, as these will, up to a point, increase the size of the bureau’s budget. This budget augmentation can be accomplished in one or both of two ways: (1) by under–stating the marginal cost of the bureau’s output; (2) by price discrimination.
If we assume that managers of public agencies are wealth maximizers to the same extent as man-agers of private firms, then their behavior —i.e., their budgeting decisions, their planning, and their pro-duction— can be understood in terms of the reward structure under which they function. The pecuniary compensation of civil service managers is deter-mined, somewhat rigidly and quite uniformly, by the number and grade of people whom they supervise; thus there is a strong incentive for bureaucrats at each level in an agency to increase the number of employees in their sections. By so doing, their oper-ating budgets and salaries will be enlarged.
The bureaucrat’s decision problem is, therefore, to present the largest budget that his political executive —the mayor, the governor, or the cabinet secretary— would approve. This entails knowing the executive’s demand for the agency’s output as well as knowing the agency’s own cost function. Knowledge of the latter is a qualification for management and comes from the seniority characteristic of civil servants who head agencies. Knowledge of the former is obtained as a result of the political process. A political candi-date reveals his preferences both explicitly in his campaign platform and implicitly by embodying the preferences of those voter and special–interest groups who support him. Since department heads and cabi-net secretaries are appointees of the elected politi-cian, these political executives may, in turn, be pre-sumed to reflect the preferences of the politician''.
The development of both the rural resident, and pastoralist IDs, below is derived from the study of these two groups by Gibson (1999, pp. 121–123, 143–147) and is an attempt to represent quantita-tively the goals, audiences, and action repertoire of these two groups as described by that author.
Herbivore prevalence as influenced by the herbiv-ore density node is the single ecosystem status node for the rural resident ID. A rural resident is pursuing the two goals supporting his/her family, and avoiding prosecution for poaching herbivores and/or chee-tahs. Possible rural resident actions are: little poach-ing, moderate poachpoach-ing, heavy poachpoach-ing, clear new
land, and riot
little poaching includes the action of no poaching.
This version of the rural resident ID does not distinguish between poaching herbivores versus cheetahs. There is evidence that poaching activ-ity tends to include both herbivores and carni-vores (Gibson 1999, pp. 143–145). In the eco-system ID, a poaching action modifies the her-bivore count stochastic differential equation (SDE) and the cheetah death rate SDE (see below). A change in the area of protected regions affects the herbivore SDE and the cheetah birth rate SDE. Hence, a poaching action’s affect on the ecosystem model is interpreted as the poaching
of both herbivores and cheetahs. Future versions of this EMS model will have separate group ac-tions for the frequency of poaching herbivores for meat, and the frequency of poaching cheetahs for either trophies or to protect livestock. Such differ-entiation will also allow the indirect effect on the ecosystem of herbivore poaching causing a re-duction in cheetah carrying capacity.
Hunting big cats for trophies is market–driven and this world–wide market is not represented in either the rural resident or pastoralist IDs. The effect of this omission is that the model assumes a constant demand or constant market price for trophies. One way to model this demand–side effect on the motiva-tion of rural residents and/or pastoralists to poach cheetahs is to develop a group ID of the buyers of such trophies. As a result of world–wide efforts to reduce the demand for trophies, this group would post lower market prices for trophies to the IntIDs bulletin board. These posted prices would, in–turn affect the perceived profit by rural residents and/or pastoralists from poaching cheetahs. This approach will be experimented with in future versions of this cheetah management EMS.
Cheetah prevalence as influenced by cheetah density is the single ecosystem status node in the pastoralist ID. Pastoralists have the three goals of supporting their family, protecting their livestock, Table 1. Hypothetical action–reaction data for the Kenya president ID: inac. Input actor; c(in). Input
action; s(in). Input subject; c(ou). Output action; Target. Output action subject; Pas. Pastoralist; RR.
Rural residents; EPA. Environmental Protection Agency; Eco. Ecosystem; Self. DM_group
Tabla 1. Datos hipotéticos de acción–reacción con respecto a los diagramas de influencia del presidente de Kenia ID: inac. Actor de la acción estímulo; c(in). Acción estímulo; s(in). Sujeto estímulo; c(ou). Acción
resultado; Target. Sujeto que recibe el resultado (el objetivo); Pas. Ganaderos; RR. Residentes rurales; EPA. Agencia de Protección del Medio Ambiente; Eco. Ecosistema; Self. Grupo DM.
Input vector Output vector
inac c(in) s(in) c(ou) Target
Pas little poaching Eco do nothing Pas
Pas moderate poaching Eco request increased EPA
antipoaching enforcement
Pas heavy poaching Self request increased EPA
antipoaching enforcement
RR little poaching Eco do nothing RR
RR moderate poaching Eco request increased EPA
antipoaching enforcement
RR heavy poaching Self open preserve RR
RR clear new land Eco do nothing RR
RR riot Self suppress riot RR
EPA negative ecoreport Self create preserve Pas
and avoiding prosecution for poaching. Possible pastoralist actions are: little poaching, moderate poaching, and heavy poaching (see www.uwm.edu/
-
haas/ems-cheetah/kenpas.pdf). As with the rural residents, a poaching action does not differentiate between the taking of herbivores versus cheetahs. The ecosystem ID is a modified version of the cheetah population dynamics ID of Haas (2001) and consists of four subIDs: management, habitat, direct effects on population dynamics, and population dy-namics (see www.uwm.edu/-
haas/ems-cheetah/ ecosys.pdf). Management nodes represent time (t), region (q), and management options (m). Cheetah habitat is characterized by chance nodes for the region’s climate (CL), unprotected land use (U), and the proportion of a region’s area that is protected (Rt). A single direct effect chance node follows: within–region poaching pressure (Pt). The node U takes on the values nomad_camel, nomad_cattle, ranching, and farming.Cheetah population dynamics is modeled with a system of SDEs consisting of the within–region nodes of birth rate (ft), death rate (rt), number of herbivores (Ht), cheetah carrying capacity (Kt), and cheetah count (Nt).
The SDE for Ht is
(1)
where H0 is the initial count, 0 (10,000) is the carrying capacity of the habitat (influenced by CL),
1 is the difference between herbivore birth and
death rates, (= 0.01) is the diffusion parameter, and Wt is a Wiener process. The initial value, H0 is set to 0.6 0. This model is a simplified version of the relationship given in Wells et al. (1998) wherein the probability of offspring upon the meeting of a male and female is assumed to be 1.0.
Poaching affects the value of 1: minor poach-ing, moderate poaching, and severe poaching cause 1 to take on the values 0.1, –0.1, and –0.3, respectively. If E[Ht] < 2,000, the rural resident ID’s Herbivores node is set to none, if 2000< E[Ht] < 10,000, this node is set to few, and if 10,000 < E[Ht], this node is set to many.
As described in Haas (2001), the distribution of cheetah birth rate, ft is the solution of the SDE
(2) Table 2. Hypothetical action–reaction data for the Kenya EPA ID. (For abbreviations see table 1.) Tabla 2. Datos hipotéticos de acción–reacción con respecto a los diagramas de influencia de la Agencia de Protección del Medioambiente de Kenia. (Para las abreviaturas ver tabla 1.)
Input vector Output vector
inac c(in) s(in) c(ou) Target
Pas heavy poaching Eco increase antipoach Pas
RR clear new land Eco negative ecoreport Pres
Pres request increased Self increase antipoach RR
antipoaching enforcement
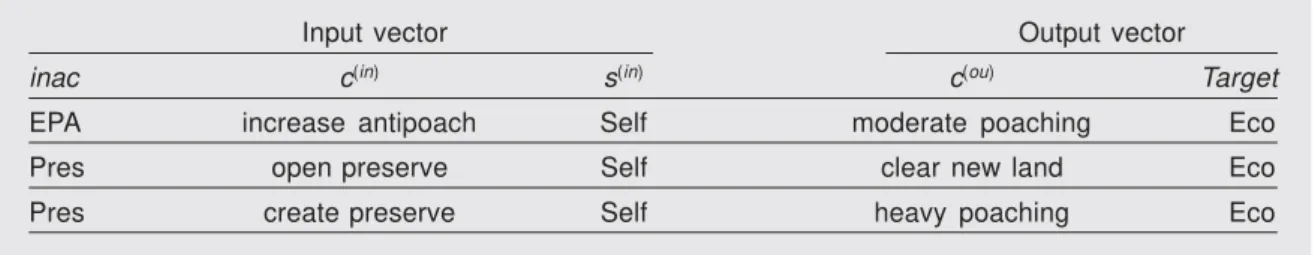
Table 3. Hypothetical action–reaction data for the Kenya rural resident ID. (For abbreviations see table 1.)
Tabla 3. Datos hipotéticos de acción–reacción con respecto a los diagramas de influencia de los residentes rurales de Kenia. (Para las abreviaturas ver tabla 1.)
Input vector Output vector
inac c(in) s(in) c(ou) Target
EPA increase antipoach Self moderate poaching Eco
Pres open preserve Self clear new land Eco
where ft’ = 2f
t – 1. This SDE was chosen because its
solution is bounded between 0 and 1 making ft a well–defined birth rate ft c( 0, 1). A similar develop-ment for cheetah death rate gives
(3)
where rt’ = 2r
t – 1. Note that the birth rate
de-creases as f becomes increasingly positive, and the death rate decreases as r becomes increas-ingly positive.
The tendency of more females to have lit-ters within protected areas (see Gros, 1998) is represented by having the parameter f be conditional on the region’s status. Similarly, to represent the effect of poaching and pest hunt-ing on rt, r is conditional on poaching pres-sure. The variability of the sample paths of ft and rt are controlled by the parameters f and
r, respectively.
All other unmodeled effects (such as migration, emigration, or age–dependent parameter values) that could influence the within–region cheetah count differential (dNt) are represented by the noise term in the cheetah count SDE:
(4)
were P, c, N0, and N are fixed parameters, and Kt is a deterministic function of the Ht temporal stochastic process.
Future versions of this cheetah count model will include terms to represent cheetah migration and emigration between adjacent regions including re-gions that are within the neighboring countries of Tanzania and Uganda.
As mentioned above, the effect of climate change on a region is represented by the ecosystem’s climate node (CL) that influences herbivore carry-ing capacity.
Ecosystem status output nodes are herbivore and cheetah densities. Because the ecosystem ID is conditional on region, computed herbivore and cheetah densities are region–specific. Since the group IDs are not regionally–indexed, these
re-gion–specific ecosystem ID outputs need to be aggregated across regions. Here, this aggregation is accomplished by computing at each time step, a weighted average of the expected values of ecosys-tem output nodes with region area as the weighting variable. These weighted averages are written to the bulletin board.
Hypothesis parameter values for this ecosystem ID are taken from Haas (2001).
Example model output
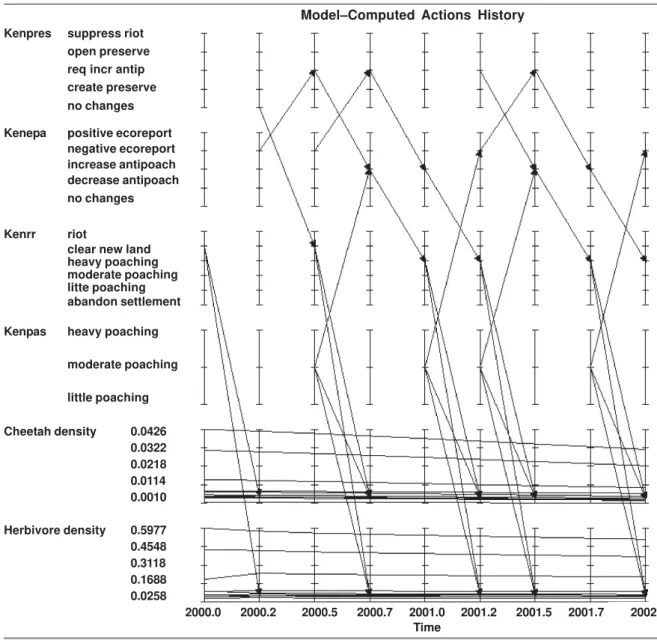
As an example of EMS model output, figure 3 gives the event history over a three year period computed by the IntIDs EMS model using each ID’s H values. Three months is the unit of time (expressed in units of years, i.e., groups read the bulletin board every 0.25 time units). The initializ-ing action is RRs clearinitializ-ing new land. This action prompts a negative ecosystem status report by the EPA. Upon receipt of this report, the president calls for increased antipoaching enforcement (Time = 2000.5) and so forth.
The figure indicates a steady decline in both herbivore and cheetah density across Kenya. Say that preservation measures were enacted in 2001 and maintained through 2002. What changes in parameter values would be needed to reverse these declines? Through trial and error it has been found that the difference in herbivore birth and death rates would need to be maintained at 0.5, the cheetah birth rate param-eter, f at –3.0, and the cheetah death rate parameter, r at 3.0.
Because a fixed time step is used, the EMS model may produce a frequency of actions from a group that may be higher than observed. For the case of an action being repeated —such as the president’s call for increased antipoaching enforcement in the example, the repeated ac-tion should be interpreted as the group’s con-tinued preferred response which in reality may not be made public at time points following the first time that the action is posted on the bulle-tin board.
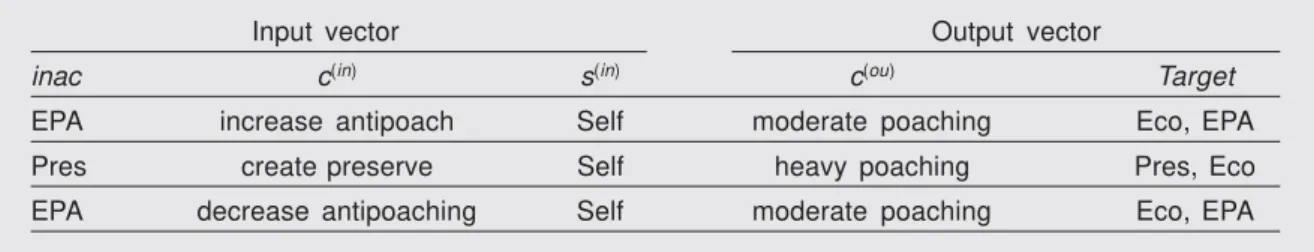
Table 4. Hypothetical action–reaction data for the Kenya pastoralist ID. (For abbreviations see table 1.) Tabla 4. Datos hipotéticos de acción–reacción con respecto a los diagramas de influencia de los ganaderos de Kenia. (Para las abreviaturas ver tabla 1.)
Input vector Output vector
inac c(in) s(in) c(ou) Target
EPA increase antipoach Self moderate poaching Eco, EPA
Pres create preserve Self heavy poaching Pres, Eco
Parameter estimation with CA CA overview
CA is used to fit the EMS model to data. Let U be an IntID’s r–dimensional vector of chance nodes. Let gS( ) be a goodness–of–fit statistic that measures the agreement of this distribution (referred to here as the Ux distribution) and the (possibly) incomplete sample, S. Let gH( ) be the agreement between this distribution identified by the values of H (referred to here as the hypothesis distribution) and the U*
distribution. Let gsmax be the unconstrained maxi-mum value of gS( ) over all . Let ghmax be the unconstrained maximum value of gH( ) over all . Up to errors in the approximation of gH( ), ghmax = gH( H). The CA parameter estimator maximizes gCA( ) h (1 – cH) gs( )/*gsmax*+ cHgH( ) /*ghmax*
were cH c (0, 1) is the analyst’s priority of having
the consistent distribution agree with the hypoth-esis distribution as opposed to agreeing with the empirical (data–based) distribution. Let
h argmax {gCA( )} be the CA estimate of . See Haas (2001, Appendix) for further details and a comparison with other parameter estimators, and Haas (2003a, Section 5) for mathematical defini-tions of all CA agreement funcdefini-tions.
CA example
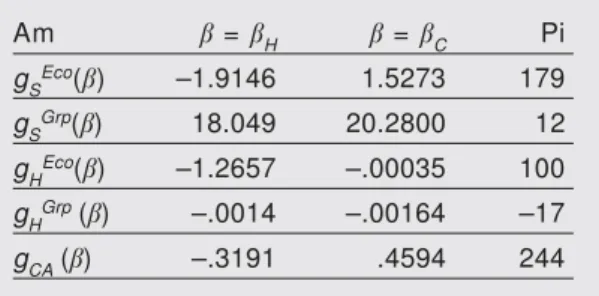
The actions history–ecosystem status output (fig. 3) is used to illustrate CA. A smaller number of Monte Carlo realizations per ID causes the IntIDs model output to deviate slightly from the output of figure 3 and hence can be used as a data set that is different than the EMS model output under the IntID’s hypothesis distributions. The parameters estimated with CA are those defining the president’s Overall Goal Satisfaction node, and the ecosystem ID’s cheetah count node —resulting in 12 parameters to be estimated. For cH set to 0.5, starting and ending values of each CA agreement function are in table 5. Values of gsmax and ghmax are 23.6962 and 1.2671, re-spectively. The CA optimization was limited to 200 function evaluations per step and hence did not achieve convergence on either step. This run re-quired four hours on a 500 mhz PC. Table 5 indicates that significant improvements in model fit to a data set can be achieved after only a modest exploration of the parameter space.
One–step–ahead prediction error rates are given in Haas (2003a, Section 5). Also, a parameter sen-sitivity analysis of this model shows no highly unsta-ble parameters (see Haas, 2003a, Section 4).
Disc ussion
A general purpose EMS has been developed that can help decision makers manage an ecosystem while taking into account political realities. Methods
have also been developed for fitting the EMS model to a history of group actions and ecosystem obser-vations.
This group actions and ecosystem observa-tions data set can be augmented with acobserva-tions directed towards similar environmental metrics. For example, management decisions concerning any large land carnivore such as lions can be included in the data set used to estimate the parameters of the example’s cheetah manage-ment EMS model.
Modeling across multiple scales
Group behavior across a range of spatial scales is captured in the IntIDs EMS model structure by using a separate suite of group IDs for each coun-try. Different temporal scales are modeled with selection of values for the time step between bulle-tin board updates in relation to the values chosen for the wildlife population dynamics model’s diffu-sion rate parameters. Ecosystem behavior across a range of spatial scales is captured thru the use of an ecosystem model at the level of a homogeneous region – similar to an ecoregion.
A current shortcoming of the cheetah manage-ment model is that the population dynamics mod-el’s diffusion rate parameters are too fast. This was done to illustrate how the ecosystem model could interact with several group models.
Descriptions of related approaches Post–normal science
In their development of post–normal science, Funtowicz & Ravetz (1993) argue that: (a) models as normally understood by scientists are not going to be successful in capturing the behavior of complex environmental systems, (b) diverse groups have
Table 5. CA agreement function values using artificial data: Am. Agreement measure; Pi. Percent improvement.
Table 5. Valores de la función de concordancia del análisis de consistencia utilizando datos artificiales: Am. Medida de concordancia; Pi. Porcentaje de mejora.
Am = H = C Pi
gSEco( ) –1.9146 1.5273 179
gSGrp( ) 18.049 20.2800 12
gHEco( ) –1.2657 –.00035 100
gH
Grp ( ) –.0014 –.00164 –17
stakes in the outcomes of these systems and attach different values to such outcomes, (c) many of these groups are not members of established policymaking or scientific elites but nonetheless are demanding and receiving a significant role in the management of such complex environmental systems, so that (d) future management decisions should be made on "partial" scientific analysis and shared decision mak-ing that respects the values of groups that have been historically marginalized in policymaking debates.
Fig. 3. Output action time series under H values. An arrow’s tail locates a group’s action and the arrow’s head indicates the reaction of either a group or the ecosystem. Each line on an ecosystem variable plot is the mean for one of the eleven regions in Kenya.
Fig. 3. Serie temporal de los resultados de las acciones según los valores H. La cola de una flecha sitúa la acción de un grupo, mientras que su cabeza indica la reacción de un grupo o del ecosistema. Cada línea que figura en la representación gráfica variable del ecosistema corresponde al promedio de una de las once regiones de Kenia.
Kenpres suppress riot open preserve req incr antip create preserve no changes
Kenepa positive ecoreport negative ecoreport increase antipoach decrease antipoach no changes
Kenrr riot
clear new land heavy poaching moderate poaching litte poaching abandon settlement
Kenpas heavy poaching
moderate poaching
little poaching
Cheetah density 0.0426 0.0322 0.0218 0.0114 0.0010
Herbivore density 0.5977 0.4548 0.3118 0.1688 0.0258
The ID–based, combined political and ecologi-cal processes EMS model proposed here is simi-lar to the post–normal science agenda in that it explicitly models the values and decision making processes of all groups affecting the environmen-tal system. System complexity however, contrary to the post–normal science view, is not seen as hopeless to model but rather, stochastic models are proposed that, after being fitted to data, can have their out–of–sample or predictive validity
2000.0 2000.2 2000.5 2000.7 2001.0 2001.2 2001.5 2001.7 2002.0
Time
demonstrated. Such demonstrations can lead to greater impact of the output of such models on the policymaking debate.
Multiagent models
Janssen (2002) describes a multi–agent simulation model of forest harvesting decisions of landowners in southern Indiana (U.S.A.), and in the Brazilian Amazon. This model employs finite–difference equa-tions to represent farmers using a simple learning algorithm and a simple maximum expected utility decision making algorithm to reach harvesting de-cisions. For example, a decision to harvest trees is made if current economic conditions result in the utility of a harvesting proposal to be greater than that of not harvesting.
This approach to a model–based EMS is differ-ent from the approach described in this article in that: (a) a procedure has not been given for fitting the model to landowner behavior observations, (b) the group behavior model is relatively simple, and (c) there is no separate ecosystem model. Differential and finite difference equation models Costanza et al. (2001) has developed a simulation model of the dynamic characteristics of humans interacting with periodically harvested fish stocks. This model accounts for different spatial and tem-poral scales of social and ecological processes. For example, mis–perceived spatial scale of fish populations can lead to extinction because the regulatory region scale and the natural population scale are different. For the case of northern Atlantic fisheries, the U.S. claim to regulatory control for up to 200 miles offshore results in a large–area fishing quota being set —but population spawning grounds are small and separated areas. Implementation of such quotas then, can lead to local population depletion.
In this model, groups obey simple rules of behavior such as harvesting to maintain a maxi-mum sustained yield, or unlimited fishing. Fish stocks are affected by: (a) harvesting and value– addition by humans before human consumption, (b) fishing regulation limits, (c) cheating (catches are over regulation limits), and (d) spatially hetero-geneous area (three subregions).
This approach to a model–based EMS is differ-ent from the approach described in this article in that: (a) there are no stochastic terms, (b) a proce-dure has not been given for fitting the model to fisheries observations, (c) the group behavior model is relatively simple, and (d) there is no separate ecosystem model.
Carpenter et al. (1999) describes a model of multiple agents affecting a lake’s nutrient loading. A stochastic finite difference equation model of a lake’s phosphorous load along with a soils equa-tion makes up the environmental model. Simple, deterministic, utility maximizing equations are used to represent the decision making of scientists,
economists, regulators, and farmers. Two compu-tations are made at each time step. First, each agent decides how much phosphorous to allow into the lake. This is done by modeling these agents as utility maximizers having only partial information access. Then, the soils and lake mod-els are updated.
This approach to a model–based EMS is differ-ent from the approach described in this article in that: (a) no procedure has been given for fitting the model to observations on soils and lake status, (b) group behavior models assume high education lev-els and the ability to make fairly precise economic calculations, and (c) multiple spatial scales are not represented.
Re fe re nc e s
Asch, S. E., 1951. Effects of group pressure on the modification and distortion of judgments. In: Groups, leadership and men: 177–190 (H. Geutzkow, Ed.), Carnegie Institute of Technology Press, Pittsburgh, Pennsylvania.
Brewer, G. & De Leon, P., 1983. Foundations of policy analysis. Dorsey Press, Homewood, IL. Carpenter, S., Brock, W. & Hanson, P., 1999.
Eco-logical and social dynamics in simple models of ecosystem management. Conservation Ecology, 3(2): 4.
URL: www.consecol.org/vol3/iss2/art4
Costanza, R., Low, B. S., Ostrom, E. & Wilson, J., 2001. Institutions, ecosystems, and sustainability. Lewis Publishers, Boca Raton, Florida.
Festinger, L., 1957. A theory of cognitive disso-nance. Stanford Univ. Press, Stanford.
Francis, G. R. & Regier, H. A., 1995. Barriers and bridges to the restoration of the great lakes. In: Barriers and bridges to the renewal of ecosys-tems and institutions: 239–291 (L. H. Gunderson, C. S. Holling & S. S. Light, Eds.) Columbia Univ. Press, New York.
Funtowicz, S. O. & Ravetz, J. R., 1993, Science for the post–normal age. Futures, 25(7): 739–755. Gibson, C. C., 1999. Politicians and poachers.
Cam-bridge Univ. Press, CamCam-bridge, UK.
Gros, P. M., 1998. Status of the Cheetah Acinonyx jubatus in Kenya: a field–interview assessment. Biological Conservation, 85: 137–149.
Haas, T. C., 1992. A Bayes network model of district ranger decision making. Artificial Intelli-gence Applications, 6(3): 72–88.
– 2001. A web–based system for public–private sector collaborative ecosystem management. Stochastic Environmental Research and Risk As-sessment, 15(2): 101–131.
– 2003a. Ecosystem management via interacting models of political and ecological processes. Technical Report, School of Business Adminis-tration, Univ. of Wisconsin–Milwaukee, Milwaukee, Wisconsin.
URL: www.uwm.edu/
-
haas/idtutrl.pdfHealy, R. G. & Ascher, W., 1995. Knowledge in the policy process: incorporating new environmental information in natural resources policy making. Policy Sciences, 28: 1–19.
Hudson, V. M., 1983. The external predisposition component of a model of foreign policy behavior. Ph. D. Dissertation, Ohio State Univ., Ohio. Janssen, M. A., 2002, Complexity and
ecosys-tem management: the theory and practice of multi–agent systems. Edward Elgar Publish-ing, New York.
Kelly, M. J. & Durant, S. M., 2000. Viability of the Serengeti Cheetah population. Conservation Bi-ology, 14(3): 786–797.
Leng, R. J., 1999. Behavioral correlates of war, 1816–1979 (Computer file), 3rd release, Middlebury College 1993. Available for download as Study Number 8606 from the Inter–University Consortium for Political and Social Research (ICPSR), Ann Arbor, Michigan.
URL: www.icpsr.umich.edu
Lindblom, C., 1980. The policymaking process. Prentice–Hall, New York.
Milgram, S., 1974. Obedience to authority. Harper and Row, New York.
Murray, S. K. & Cowden, J. A., 1999. The role of "Enemy Images" and ideology in elite belief systems. International Studies Quarterly, 43: 455–481.
Nilsson, D. & Lauritzen, S. L., 2000. Evaluating influence diagrams using LIMIDs. In: Proceed-ings of the Sixteenth Conference on Uncer-tainty in Artificial Intelligence: 436–445 (C.
Boutilier & M. Goldszmidt, Eds.). Morgan Kaufmann Publishers, San Francisco.
Niskanen, W. A., 1971. Bureaucracy and rep-resentative government. Aldine, Atherton, Chicago.
O’Connell–Rodwell, C. E., Rodwell, T., Matthew, R. & Hart, L. A., 2000. Living with the modern conservation paradigm: can agricultural com-munities co–exist with elephants? A five–year case study in east Caprivi, Namibia. Biological Conservation, 93: 381–391.
Ott, M., 1981. Bureaucratic incentives, social effi-ciency, and the conflict in federal land policy. The Cato Journal, 1(2): 585–607.
Partell, P. J. & Palmer, G., 1999. Audience costs and interstate crises: an empirical assessment of Fearon’s model of dispute outcomes. Interna-tional Studies Quarterly, 43: 389–405.
Rubin, J. Z. & Brown, B. R., 1975. The social psychology of bargaining and negotiation. Aca-demic Press, New York.
Schrodt, P. A., 1995. Event data in foreign policy analysis. In: Foreign policy analysis: 145–166 (L. Neack, J. A. K. Hey & P. J. Haney, Eds.). Prentice– Hall, Englewood Cliffs, N.J.
Throup, D. & Hornsby, C., 1998. Multi–party politics in Kenya. Ohio Univ. Press, Athens, Ohio. Vertzberger, Y. Y. I., 1990. The world in their minds.
Stanford Univ. Press, Stanford.