Expression Profiling after Prolonged
Experimental Febrile Seizures in Mice
Suggests Structural Remodeling in the
Hippocampus
Bart C. Jongbloets1¤a, Koen L. I. van Gassen1¤b, Anne A. Kan1¤c, Anneke H. O. Olde Engberink1¤d, Marina de Wit1, Inge G. Wolterink-Donselaar1, Marian J. A. Groot Koerkamp2, Onno van Nieuwenhuizen3, Frank C. P. Holstege2, Pierre N. E. de Graan1*
1Brain Center Rudolf Magnus, Department of Translational Neuroscience, University Medical Center Utrecht, Utrecht, the Netherlands,2Molecular Cancer Research, Division Biomedical Genetics, University Medical Center Utrecht, Utrecht, the Netherlands,3Brain Center Rudolf Magnus, Department of Pediatric Neurology, University Medical Center Utrecht, Utrecht, the Netherlands
¤a Current Address: Vollum Institute, Oregon Health & Science University, Portland, Oregon, United States of America
¤b Current Address: Department of Medical Genetics, University Medical Center Utrecht, Utrecht, the Netherlands
¤c Current Address: Division of Anaesthesiology, Intensive Care and Emergency Medicine, National Poisons Information Center, University Medical Center Utrecht, Utrecht, the Netherlands
¤d Current Address: Laboratory of Neurophysiology, Department of Molecular Cell Biology, Leiden University Medical Center, Leiden, the Netherlands
Abstract
Febrile seizures are the most prevalent type of seizures among children up to 5 years of age (2–4% of Western-European children). Complex febrile seizures are associated with an increased risk to develop temporal lobe epilepsy. To investigate short- and long-term effects of experimental febrile seizures (eFS), we induced eFS in highly febrile convulsion-susceptible C57BL/6J mice at post-natal day 10 by exposure to hyperthermia (HT) and compared them to normotherm-exposed (NT) mice. We detected structural re-organization in the hippocampus 14 days after eFS. To identify molecular candidates, which entrain this structural re-organization, we investigated temporal changes in mRNA expression profiles eFS 1 hour to 56 days after eFS. We identified 931 regulated genes and profiled several candidates using in situ hybridization and histology at 3 and 14 days after eFS. This is the first study to report genome-wide transcriptome analysis after eFS in mice. We identify temporal regulation of multiple processes, such as stress-, immune- and inflammatory responses, glia activation, glutamate-glutamine cycle and myelination. Identification of the short- and long-term changes after eFS is important to elucidate the mechanisms contribut-ing to epileptogenesis.
OPEN ACCESS
Citation:Jongbloets BC, van Gassen KLI, Kan AA, Olde Engberink AHO, de Wit M, Wolterink-Donselaar IG, et al. (2015) Expression Profiling after Prolonged Experimental Febrile Seizures in Mice Suggests Structural Remodeling in the Hippocampus. PLoS ONE 10(12): e0145247. doi:10.1371/journal. pone.0145247
Editor:Gilles van Luijtelaar, Radboud University Nijmegen, NETHERLANDS
Received:July 9, 2015
Accepted:November 30, 2015
Published:December 18, 2015
Copyright:© 2015 Jongbloets et al. This is an open access article distributed under the terms of the Creative Commons Attribution License, which permits unrestricted use, distribution, and reproduction in any medium, provided the original author and source are credited.
Data Availability Statement:All relevant data are within the paper and its Supporting Information files. In addition microarray raw data are available from the NCBI's Gene Expression Omnibus and are accessible through GEO Series accession number GSE66762.
Introduction
Febrile seizures are the most prevalent type of seizures among children up to 5 years of age (2– 4% of Western-European children) [1]. Although simple febrile seizures are generally benign, complex and especially prolonged febrile seizures, lasting longer than 10 minutes with recur-ring episodes, are thought to contribute to the development of epilepsy (epileptogenesis). Ret-rospective studies amongst temporal lobe epilepsy (TLE) patients show a higher incidence of complex or prolonged febrile seizures during childhood compared to other types of epilepsy, and hence have been suggested to be a precipitating or aggravating factor in the development of TLE [2–5]. In addition, a series of prospective studies indicate that children with prolonged febrile seizures are at risk of hippocampal injury and development of hippocampal sclerosis, a common pathology among TLE patients [6,7]. Prolonged febrile seizures together with risk fac-tors such as a family history of epilepsy, age of onset and underlying neurological abnormality, increase the risk of epilepsy later in life [8,9]. Genetic predisposition to febrile seizure suscepti-bility in human and mice shows that the molecular make-up of the brain contributes to the occurrence and impact of febrile seizures [10–12]. Animal models are highly suitable to study the relation between febrile seizures and epilepsy, and provide opportunity to monitor the underlying process of epileptogenesis.
Several animal models for febrile seizures have been developed, in which a temperature controlled chamber is used to trigger hyperthermia and subsequently the development of febrile seizures in rats and mice [13–15]. The development and onset of febrile seizures can be determined by behavioral and by electroencephalographic (EEG) criteria [13,14]. Studies on the effects of experimentally induced prolonged febrile seizures (eFS) in rat and mouse indicate structural and functional changes in temporal lobe brain areas such as the hippo-campus and amygdala [15–20]. Hallmarks of such changes in the hippocampus after eFS are mild mossy fiber sprouting and ectopic migration of neonatally generated granule cells in the dentate gyrus, as well as CA1 neuronal hyper-excitability and a shift in activity-dependent synaptic plasticity [15,17,18,21]. Control experiments elegantly showed that these hippocam-pal changes are eFS-induced and not merely a consequence of the induced hyperthermia [13,15,21,22]. The molecular processes mediating these eFS-induced structural and func-tional changes are still largely unresolved. In resemblance with humans, eFS elicited in rodents are followed by a latent period until the first signs of spontaneous epileptiform activ-ity as observed among 35–68% of the exposed animals [15,22,23]. The molecular changes that occur during the latent phase which eventually lead to spontaneous epileptiform activity are still largely unknown.
To investigate short- and long-term changes after eFS, we induced eFS in highly febrile con-vulsion susceptible C57BL/6J mice (post-natal age 10, P10) by warm-air induced hyperthermia (HT)[14]. We compared hippocampal mRNA expression profiles of eFS and normothermic control mice at various times (up to 56 days) after eFS induction. Subsequently we validated several regulated genes by qPCR and immunocytochemistry.
Materials and Methods
Ethics statement
All experiments conformed to institutional guidelines of the University Medical Center Utrecht, approved by the Animal Ethics Committee of Utrecht University, and were conducted in agreement with Dutch laws (Wet op de Dierproeven, 1996) and European regulations (Guideline 86/609/EEC).
in study design, data collection and analysis, decision to publish, or preparation of the manuscript.
Animals
Mice were bred from pairs of C57BL/6J mice (Jackson Laboratories, ME, USA) and raised by their mothers. Birth of new litter was daily checked and the date of birth was defined as postna-tal day zero (P0). Between P0-P2, large litters (>6 pups) were reduced to a maximum of six
pups with a balanced male/female ratio where possible. Pups were weaned on P21 and housed maximum four per cage. Animals were kept in a controlled 12h light-dark cycle with a temper-ature of 22 ± 1°C and were given unrestricted access to food (211 RMH-TM diet; Hope Farms, Woerden, NL) and water. Animals were housed in transparent Plexiglas cages with wood-chip bedding and tissue for nest building. Animal reaching the human end-point, defined by<20%
weight loss over 2 days, do not receive care from mother, or loss of grooming before the end of the experiment were deceased from the study. All animals at the end of the experiment or reaching the human endpoint were sacrificed by cervical decapitation.
Warm-air induced prolonged febrile seizures
To induce eFS by hyperthermia (HT), mice were exposed to a temperature-regulated laminar stream of warm air (41–48°C) to quickly raise the core body temperature as previously
described [14]. Briefly, body weight was determined in P10 C57BL/6J mice. At least 30 minutes before the HT procedure, mice were injected subcutaneously with temperature sensitive tran-sponders (IPTT-300, PLexx, Elst, NL). Two temperature chambers were used, one for age-, weight-, and litter-matched normothermic control mice (NT; core body temperature main-tained at 35°C) and one for HT (defined as core body temperature>39°C) mice. Chamber
temperature was maintained at 32°C for NT mice and at 47°C for HT mice. Mice were placed one by one on the floor of the preheated chambers. Core body temperature was measured every 20 seconds by wireless transporter readout (WRS-6006/6007, Plexx). HT was typically reached within 2.5 minutes. After core temperature of the HT mice had reached 42°C, air tem-perature was adjusted to maintain a core body temtem-perature between 41.5°C and 42°C. Time and temperature data was logged automatically on a computer (DASHost v1.0, Plexx). HT was maintained for 30 minutes. Then mice were partly submerged in water of room temperature to quickly normalize core body temperature and returned to their mother. NT littermates were simultaneous treated as HT mice, except that their core body temperature was kept at 35°C. The observer scored the stages of behavior and seizures during the experiment, as previously described [14]. Only mice showing continued febrile seizures during at least 17.5 minutes (97.3% of all HT-exposed mice) were used in the experiment.
Tissue collection and sectioning
To explore the temporal relationship of structural changes after eFS, mice were sacrificed by decapitation and brains were removed at three days and fourteen days after eFS. The brains were fresh frozen and stored at -80°C for radioactivein situhybridization or incubated over-night (ON) in 4% paraformaldehyde (PFA) in phosphate-buffered saline (PBS) at 4°C for immunohistochemistry.
Cryo-sectioning for radioactive
in situ
hybridization
Frozen brains were sectioned on a cryostat (Leica CM3050, Rijswijk, NL). Coronal sections (16μm) containing the hippocampus were collected on Superfrost slides (Merzel, Germany)
Paraffin-sectioning for immunohistochemistry
After overnight incubation with 4% PFA in PBS, brains were transferred to 70% Ethanol and subsequently embedded in paraffin. Paraffin-embedded brains were sectioned on a microtome (Leica). Coronal sections (7μm) containing the hippocampus were collected on Superfrost
slides (Merzel) by 3 sequential sections per slide until a whole cross section was made of the hippocampus. Slides were stored at room temperature until used for immunohistochemistry.
Immunohistochemistry
To determine eFS-induced changes in protein expression, immunohistochemistry (IHC) was performed on coronal sections (7μm) from animals fourteen days after eFS (NTn= 10, HT n= 10) using antibodies raised against CNP (mouse, 1:24,000, Sigma Aldrich, USA) and NF (medium polypeptide, mouse, 1:600, DSHB, USA). Using serial dilutions, the optimal work-ing concentration of each antibody was determined. After dehydration, all sections were sub-jected to antigen retrieval using microwave treatment (7 minutes 650W, 5 minutes 350W) in 0.01 M Na+Citrate pH 6.0. Peroxidase activity was blocked by treatment with 0.3% H2O2in PBS-0.2% triton-X (PBS-t) for 30 minutes, followed by blocking of non-specific antigen bind-ing with 4% horse normal serum in PBS-t at 37°C for 30 minutes. Sections were incubated with primary antibodies in PBS-t overnight at 4°C. Next, sections were incubated with sec-ondary antibody biotinylated horse anti-mouse (1:400, Brunschwig Chemia, Amsterdam, NL) for 1 hour at room temperature, followed by antigen visualization using avidin-biotin method (Vectastain ABC Elite Kit, Vector Laboratories, USA) with 3,3’ -diaminobenzidinete-trachloride (DAB) as the chromogen (Sigma Aldrich). No immunostaining was observed when the protocol was completed without primary antibodies (data not shown). All sections stained for NF or CNP were imaged in one session using a light microscope (Axiophot, Zeiss, Germany), with exposure and light intensity kept constant. Photographs were analyzed using the image-processing program ImageJ (version 1.43, US National Institute of Health, MD, USA). Regions of interest were analyzed bilaterally in the stratum lucidum by an observer blind for treatment group. Expression levels were calculated by gray-scale value inversion and normalization [24]. Mean intensity values of both hemispheres at 3 sections per animal were calculated and used for statistical analysis. Background intensities were measured in the stratum lacunosum. Average intensities per animal were grouped per condition and plotted in Tukey-style boxplots. Pair-wise comparison of average DAB intensity values was tested using the Wilcoxon signed-rank test.
Hippocampal dissection and RNA isolation
One hour, three, fourteen, and fifty-six days after HT animals were sacrificed by decapitation. Brains were quickly removed and hippocampal tissue was dissected, collected and stored at -80°C. Total RNA was isolated, purified and checked for quality as described [25].
Microarray analysis
To identify critical and functional mediator genes during epileptogenesis, acute, short-, and long-term effects of prolonged febrile seizures on gene expression were investigated in whole hippocampal samples. Samples were taken from C57BL/6J animals one hour (HTn= 8, NT
n= 8), three days (HTn= 6, NTn= 6), fourteen days (HTn= 6, NTn= 6), and fifty-six days (HTn= 6, NTn= 6) after HT. Two-channel oligonucleotide microarray analysis was per-formed as described [26,27]. Briefly, cDNA from 2μg total RNA was synthesized using a T7
used for cRNA synthesis and its quality analyzed. Cy3 or Cy5 fluorophores (GE Healthcare Europe, Diegem, BE) were coupled to 2μg NT and HT cRNA. The degree of label incorporation
was monitored and hybridizations were set up with 1,500 ng, 2–3% Cy5/Cy3 labeled cRNA per channel. Hybridization was performed with a NT and HT sample on the same chip, including a dye-swap (technical replicate). Just before hybridizing, HT and NT sample were mixed and fragmented (AM8740, Austin, TX, USA). The mouse Array-Ready oligo set (version 3, Operon Biotechnologies, Cologne, DE) was printed on UltraGAPS slides (Corning, Schiphol-Rijk, NL). Probe sequences from this array were re-annotated by BLAST-searching against genomebuild version 71_37 at Ensembl. Slides were washed by hand and scanned on an Agilent G2565BA scanner at 100% laser power, 30% PMT. After image analysis using Imagene 5.6.1 (BioDiscov-ery), Loess normalization was performed [26] per printtip on mean spot-intensities. Gene-specific dye bias was corrected by a within-set estimate [27]. Data were further analyzed by MAANOVA [28], modeling sample, array and dye effects in a fixed effect analysis.P-values were determined by a permutation F2-test, in which residuals were shuffled 10,000 times glob-ally. Gene probes withP<0.05 after false discovery rate determination (FDR according to
Benjamini-Hochberg, BH) were considered significantly changed. In cases of multiple probes per gene, values from the lowestP-value and most regulated probe were used. For all time points a fold change (Fc) cutoff of log2(Fc) =<- 0.125, or>0.125 was set, all probes with
Ensembl annotation for genesymbol and description, excluding annotations for pseudo- and predicted- genes, were used to produce the significant gene list.
The data discussed in this publication have been deposited in NCBI's Gene Expression Omnibus [29] and are accessible through GEO Series accession number GSE66762.
Quantitative RT-PCR
cDNA was synthesized from the RNA samples used for the microarray using oligo-dT primers. The qPCR reaction was performed using the LightCycler (Roche, Almere, NL) and the Fast Start DNA Master PLUS SYBRgreen 1 kit (Roche). Primer (Sigma Genosys, Cambridge, UK) sequences are listed inS1 File. Gene expression was calculated as normalized ratio and normal-ized to the housekeeping gene peptidylprolyl isomerase A (Ppia) [30]. All samples (NTn= 8, HTn= 8) were analyzed in duplicate and reported as mean ± standard error of the mean. To compare qPCR with microarray data, data were analyzed using one-tailed Student’s t-tests, withP<0.05 considered significant.
Hierarchical clustering analysis
A gene list with all significant differentially expressed genes at one hour, three days and four-teen days after HT was generated based on the microarray analysis. MeV open-source software [31] was used for the generation of heatmap and hierarchical clustering of genes and samples according to Pearson’s correlation of average linkage.
Gene ontology (GO) analysis
For GO analysis, the significant gene list (P<0.05, Fold change cutoff of log2(Fc) =<-0.125,
or>0.125) and a reference list comprising all unique genes (27,334, excluding pseudo- and
list to identify significant over-representation of genes (P<0.05) within the GO classes for
bio-logical process. Classes with significant over-representation are shown and marked when, after correcting for multiple testing with BH-correction,P<0.05.
Radioactive (
33P)
in situ
hybridization
To quantify the expression levels ofNrxn1,Dpysl3,Ptprd, andSlit2in the hippocampus,33Pin situhybridization was performed on coronal sections (16μm) from animals three days after
eFS (NTn= 9, HTn= 9).33P RNA probes were designed against the mRNA forNrxn1,
Dpysl3,Ptprd, andSlit2(Nrxn1; NM_020252.3 at 7176–7568 bp,Dpysl3; NM_009468.4 posi-tion at 1306–1914 bp,Ptprd; NM_011211.3 position at 4865–5415 bp,Slit2; NM_178804.3 position at 2152–2789 bp), and aligned to the region, which included the sequence of the signif-icantly regulated microarray probe. Primer sequences are listed inS1 File. The synthesis of33P RNA-probes andin situhybridization were performed as described in previous work [34]. Briefly, sections were hybridized to the 1 x 10⁶cpm of anti-sense33P RNA probe in 150μL
hybridization mixture with 50% deionized formamide, 2x standard saline citrate (SSC), 10% dextrane sulphate, 1x Denhardt’s solution, 5 mM ethylenediaminetetraacetic acid (EDTA), and 10 mM phosphate buffer. After overnight hybridization of the probes at 72°C, slides were washed, dried and exposed film (Kodak Bio-Mac, MR). The developed films were digitized using an Epson flatbed scanner (Perfection 4990, Epson America, CA, USA). For each gene, one slide was hybridized to the sense control33P RNA probe. No signal was observed in pres-ence of the control sense33P RNA probe (data not shown). Calibration dilutions of14C micro-scales (Amersham Bioscience, Sweden) and anti-sense probes were used to determine the linear range for image quantification. An observer blind for treatment condition quantified photo-graphs of the film in ImageJ. Regions of interest were placed in the subfields of the hippocam-pus bilaterally in 3 sections per animal. Expression levels were calculated by gray-scale value inversion, corrected for background gray-scale value and normalized. Mean intensity values of both hemispheres at 3 sections per animal were calculated and used for statistical analysis. Background value was determined within the corpus callosum. Bar graphs depict the average expression levels per condition and subfield, normalized to control (NT) group average with ± standard error of the mean. To compare expression levels of genes in HT versus NT ani-mal couples Student’s t-tests (littermate-paired, two-tailed) were performed.
Statistical analysis
All statistical analyses were performed using R with Stats package (version 3.1.2, http://cran.r-project.org). Thresholds of significance were set atα= 0.05.
Results
Regulation of neurofilament in the hippocampus after eFS
Regulation of hippocampal gene expression after eFS
To investigate which molecular pathways underlie the structural reorganization after eFS, we compared hippocampal mRNA content from HT and NT mice by microarray hybridization. Hippocampal tissue was sampled one hour, and three, fourteen, and fifty-six days after induc-tion of eFS.
Changes in mRNA expression within the hippocampus after eFS
One hour after eFS (NTn= 8, HTn= 8) 1004 differentially expressed probes were identified. Of these 1004 probes, 579 upregulated and 298 downregulated unique Ensembl annotated genes were identified (S2 File, excluding pseudo- and predicted-genes). The highest upregu-lated gene (8.04-fold),Cyr61, is an extracellular angiogenic factor. BrainCyr61expression is induced by numerous stimuli. Although limited information is available onCyr61function, it appears to be involved in vasculature or dendritic ramification of hippocampal neurons [35]. As expected, several highly upregulated genes are immediate early genes (IEGs, for example
Cyr61,Jun,Fos,Egr1, andNr4a1) and heat-shock proteins (HSP110,Hspb1,Hsph1, and
Dnajb1) (Table 1). Amongst the highly downregulated genes trophic factorPtgds, adhesion moleculesPcdh20andCldn5, and transcription factorsHes5andSox18were identified.
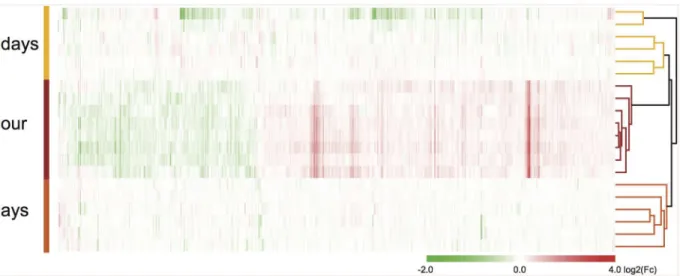
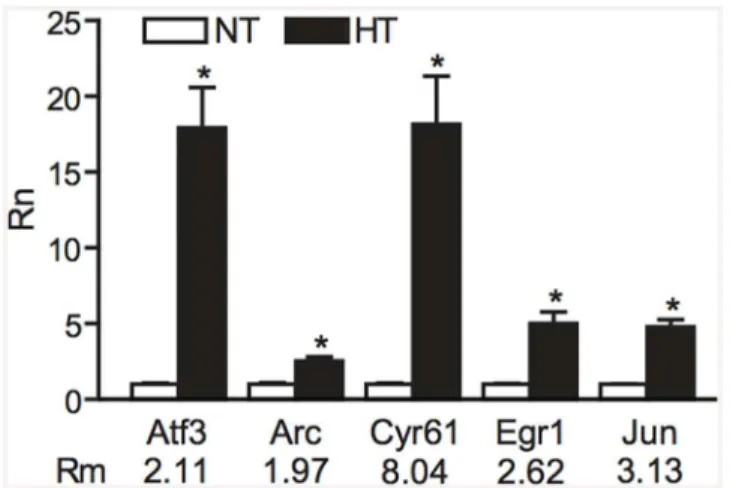
Analysis of the later time points identified 74, 15, and 1 significantly regulated probe(s) three, fourteen, and fifty-six days after eFS, respectively (Table 2, for all time points: NTn= 6, HTn= 6). Hierarchical cluster analysis performed on the total geneset of all differentially expressed genes from one hour, three and fourteen days after eFS (930 Ensembl annotated unique genes, excluding pseudo- and predicted- genes). Fifty-six days after eFS was excluded from the cluster analysis because only one significantly regulated gene was found. Differential expression levels (log2(Fc)) between each HT and NT littermate couple was used for clustering. Based on Pearson correlation of average linkage the HT samples and genes were clustered (Fig 2). Gene expression profiles of all samples showed strong clustering per time-point except for two samples (14 days post-eFS), which showed larger clustering distance to all other samples. To independently validate the one hour after eFS microarray results, we used qPCR to quan-tify mRNA levels of several regulated genes in the HT/NT couples.Jun,Cyr61,Atf3,Egr1, and
Arcwere selected for validation (Fig 3). In line with the microarray data, all five genes were found to be upregulated in HT animals compared to NT littermates.
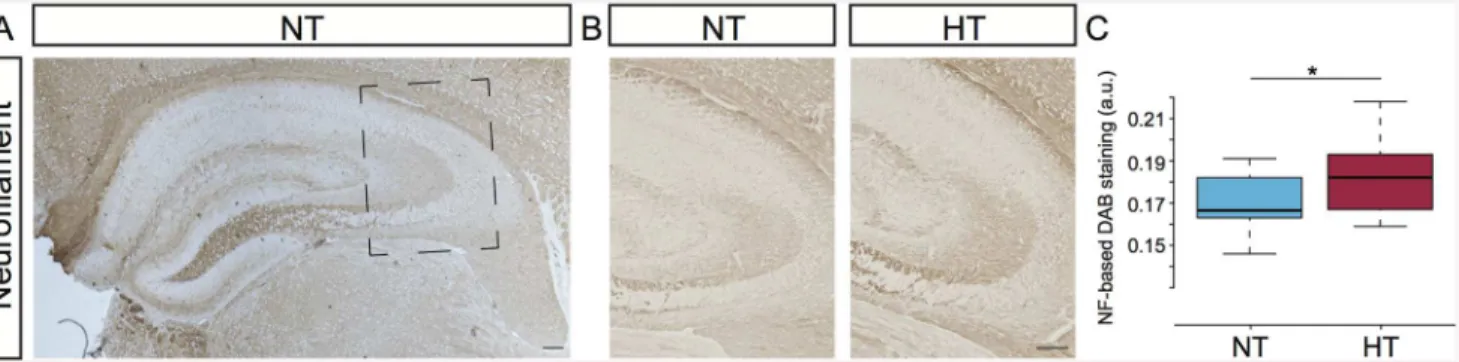
Fig 1. Hyperthermia induces upregulation of neurofilament protein-expression.(A) Neurofilament (NF) immunostaining in the hippocampus of a normothermic (NT) control animal, 14 days post-hyperthermia exposure. Square marks subfield enlargement; panel B. (B) Immunostaining for NF in the stratum lucidum of NT control animal (left panel) and in hyperthermia-exposed (HT) littermate (right panel). (C) Comparison of NF-based DAB staining in the stratum lucidum between NT and HT littermates. All HT (n= 10) animals showed increased DAB-staining in the stratum lucidum. Pair-wise comparison of DAB-staining intensities showed increased NF expression in HT animals compared to NT littermates (n= 10), Wilcoxon signed-rank test,*indicates a significance ofP= 0.0049. Tukey-style box plots. Scalebars: 100μm.
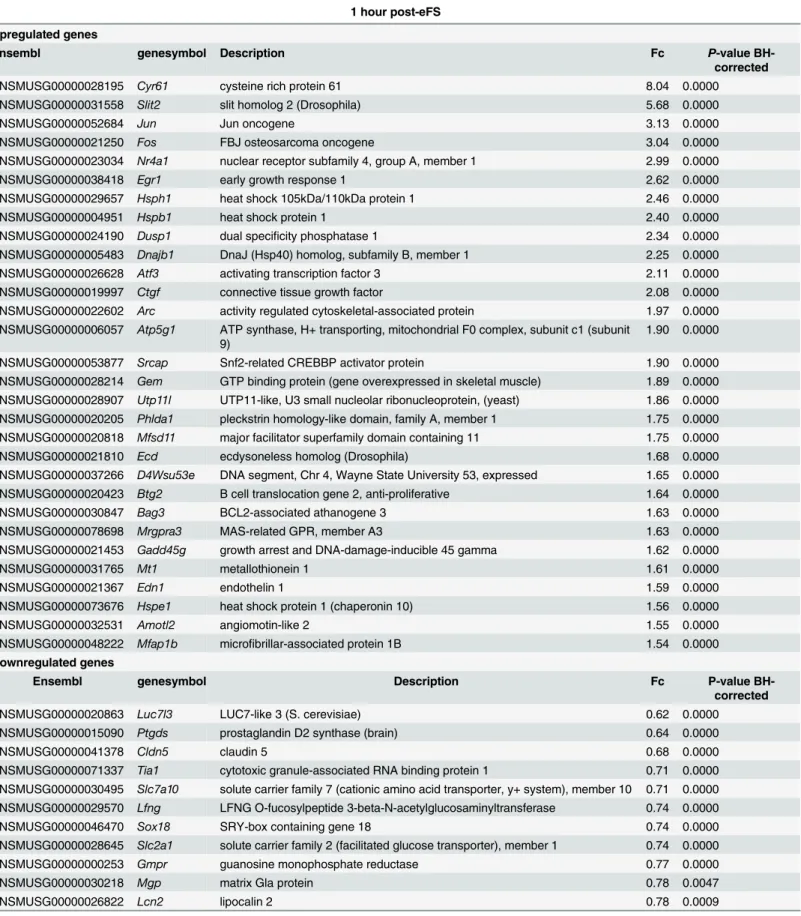
Table 1. Top 30 differentially expressed genes (up- and down- regulated) 1 hour after eFS.
1 hour post-eFS
Upregulated genes
Ensembl genesymbol Description Fc P-value
BH-corrected
ENSMUSG00000028195 Cyr61 cysteine rich protein 61 8.04 0.0000
ENSMUSG00000031558 Slit2 slit homolog 2 (Drosophila) 5.68 0.0000
ENSMUSG00000052684 Jun Jun oncogene 3.13 0.0000
ENSMUSG00000021250 Fos FBJ osteosarcoma oncogene 3.04 0.0000
ENSMUSG00000023034 Nr4a1 nuclear receptor subfamily 4, group A, member 1 2.99 0.0000
ENSMUSG00000038418 Egr1 early growth response 1 2.62 0.0000
ENSMUSG00000029657 Hsph1 heat shock 105kDa/110kDa protein 1 2.46 0.0000
ENSMUSG00000004951 Hspb1 heat shock protein 1 2.40 0.0000
ENSMUSG00000024190 Dusp1 dual specificity phosphatase 1 2.34 0.0000
ENSMUSG00000005483 Dnajb1 DnaJ (Hsp40) homolog, subfamily B, member 1 2.25 0.0000
ENSMUSG00000026628 Atf3 activating transcription factor 3 2.11 0.0000
ENSMUSG00000019997 Ctgf connective tissue growth factor 2.08 0.0000
ENSMUSG00000022602 Arc activity regulated cytoskeletal-associated protein 1.97 0.0000 ENSMUSG00000006057 Atp5g1 ATP synthase, H+ transporting, mitochondrial F0 complex, subunit c1 (subunit
9)
1.90 0.0000
ENSMUSG00000053877 Srcap Snf2-related CREBBP activator protein 1.90 0.0000
ENSMUSG00000028214 Gem GTP binding protein (gene overexpressed in skeletal muscle) 1.89 0.0000 ENSMUSG00000028907 Utp11l UTP11-like, U3 small nucleolar ribonucleoprotein, (yeast) 1.86 0.0000 ENSMUSG00000020205 Phlda1 pleckstrin homology-like domain, family A, member 1 1.75 0.0000 ENSMUSG00000020818 Mfsd11 major facilitator superfamily domain containing 11 1.75 0.0000
ENSMUSG00000021810 Ecd ecdysoneless homolog (Drosophila) 1.68 0.0000
ENSMUSG00000037266 D4Wsu53e DNA segment, Chr 4, Wayne State University 53, expressed 1.65 0.0000 ENSMUSG00000020423 Btg2 B cell translocation gene 2, anti-proliferative 1.64 0.0000
ENSMUSG00000030847 Bag3 BCL2-associated athanogene 3 1.63 0.0000
ENSMUSG00000078698 Mrgpra3 MAS-related GPR, member A3 1.63 0.0000
ENSMUSG00000021453 Gadd45g growth arrest and DNA-damage-inducible 45 gamma 1.62 0.0000
ENSMUSG00000031765 Mt1 metallothionein 1 1.61 0.0000
ENSMUSG00000021367 Edn1 endothelin 1 1.59 0.0000
ENSMUSG00000073676 Hspe1 heat shock protein 1 (chaperonin 10) 1.56 0.0000
ENSMUSG00000032531 Amotl2 angiomotin-like 2 1.55 0.0000
ENSMUSG00000048222 Mfap1b microfibrillar-associated protein 1B 1.54 0.0000
Downregulated genes
Ensembl genesymbol Description Fc P-value
BH-corrected
ENSMUSG00000020863 Luc7l3 LUC7-like 3 (S. cerevisiae) 0.62 0.0000
ENSMUSG00000015090 Ptgds prostaglandin D2 synthase (brain) 0.64 0.0000
ENSMUSG00000041378 Cldn5 claudin 5 0.68 0.0000
ENSMUSG00000071337 Tia1 cytotoxic granule-associated RNA binding protein 1 0.71 0.0000 ENSMUSG00000030495 Slc7a10 solute carrier family 7 (cationic amino acid transporter, y+ system), member 10 0.71 0.0000 ENSMUSG00000029570 Lfng LFNG O-fucosylpeptide 3-beta-N-acetylglucosaminyltransferase 0.74 0.0000
ENSMUSG00000046470 Sox18 SRY-box containing gene 18 0.74 0.0000
ENSMUSG00000028645 Slc2a1 solute carrier family 2 (facilitated glucose transporter), member 1 0.74 0.0000
ENSMUSG00000000253 Gmpr guanosine monophosphate reductase 0.77 0.0000
ENSMUSG00000030218 Mgp matrix Gla protein 0.78 0.0047
ENSMUSG00000026822 Lcn2 lipocalin 2 0.78 0.0009
Short- and long-term gene expression profile after eFS
To identify genes related to structural reorganization of the hippocampus we analyzed the gene sets three, fourteen, and fifty-six days after eFS. Compared to one hour after eFS, a limited number of genes was significantly regulated at three, fourteen, and fifty-six days after eFS (Table 2). Three days after eFS 22 upregulated and 18 downregulated unique genes were identi-fied. In the 3 day gene list, several genes implicated in structural reorganization such as cell adhesion molecules (Ptprd,Nrxn1,Dpysl3, andVcam1) were found to be upregulated, and myelin-sheath related genes (Mobo,Cnp, andMag) downregulated. Interestingly, the top three downregulated genes were hemoglobin subunits, alpha (Hba-a1 and Hba-a2)and beta ( Hbb-b1) chains. These three genes were upregulated at one hour after eFS. Information about the role of hemoglobin expression in the brain is limited [36]. Fourteen days after eFS 11 upregu-lated and 2 downreguupregu-lated unique genes were identified. At this time-point, in contrast to the three days after eFS gene set, myelin-sheath related genes (Cnp,Cldn11,Wasl, andMog) were upregulated. Analysis of fifty-six days after eFS samples revealed only 1 significantly downregu-lated gene (Camk2a).
Gene ontology (GO) analysis of regulated genes after eFS
To identify common biological processes underlying changes after eFS we performed GO anal-ysis using the DAVID web tool [32,37] based on GO Panther biological process (BP) annota-tion database (Mi 2012 Nucleic Acids Research). One hour after eFS upregulated genes significantly enriched GO biological process classifications such as mRNA transcription
Table 1. (Continued)
1 hour post-eFS
ENSMUSG00000030711 Sult1a1 sulfotransferase family 1A, phenol-preferring, member 1 0.79 0.0000
ENSMUSG00000040055 Gjb6 gap junction protein, beta 6 0.80 0.0000
ENSMUSG00000048001 Hes5 hairy and enhancer of split 5 (Drosophila) 0.81 0.0000
ENSMUSG00000046546 Fam43a family with sequence similarity 43, member A 0.81 0.0000
ENSMUSG00000032422 Snx14 sorting nexin 14 0.81 0.0000
ENSMUSG00000029231 Pdgfra platelet derived growth factor receptor, alpha polypeptide 0.81 0.0000
ENSMUSG00000050505 Pcdh20 protocadherin 20 0.81 0.0000
ENSMUSG00000022508 Bcl6 B cell leukemia/lymphoma 6 0.82 0.0000
ENSMUSG00000030707 Coro1a coronin, actin binding protein 1A 0.82 0.0000
ENSMUSG00000041073 Nacad NAC alpha domain containing 0.82 0.0000
ENSMUSG00000016921 Srsf6 serine/arginine-rich splicing factor 6 0.82 0.0000
ENSMUSG00000038175 Mylip myosin regulatory light chain interacting protein 0.82 0.0000
ENSMUSG00000017760 Ctsa cathepsin A 0.82 0.0000
ENSMUSG00000001240 Ramp2 receptor (calcitonin) activity modifying protein 2 0.82 0.0000
ENSMUSG00000043131 Mob1a MOB kinase activator 1A 0.82 0.0000
ENSMUSG00000070167 SNORA57 Small nucleolar RNA SNORA57 0.83 0.0000
ENSMUSG00000075602 Ly6a lymphocyte antigen 6 complex, locus A 0.83 0.0000
ENSMUSG00000028655 Mfsd2a major facilitator superfamily domain containing 2A 0.83 0.0000
ENSMUSG00000050295 Foxc1 forkhead box C1 0.84 0.0000
Fc: Fold change represents expression values of HT animals divided by expression values of NT animals.P-value BH-corrected: Benjamini and Hochberg (BH) error correctedp-values.
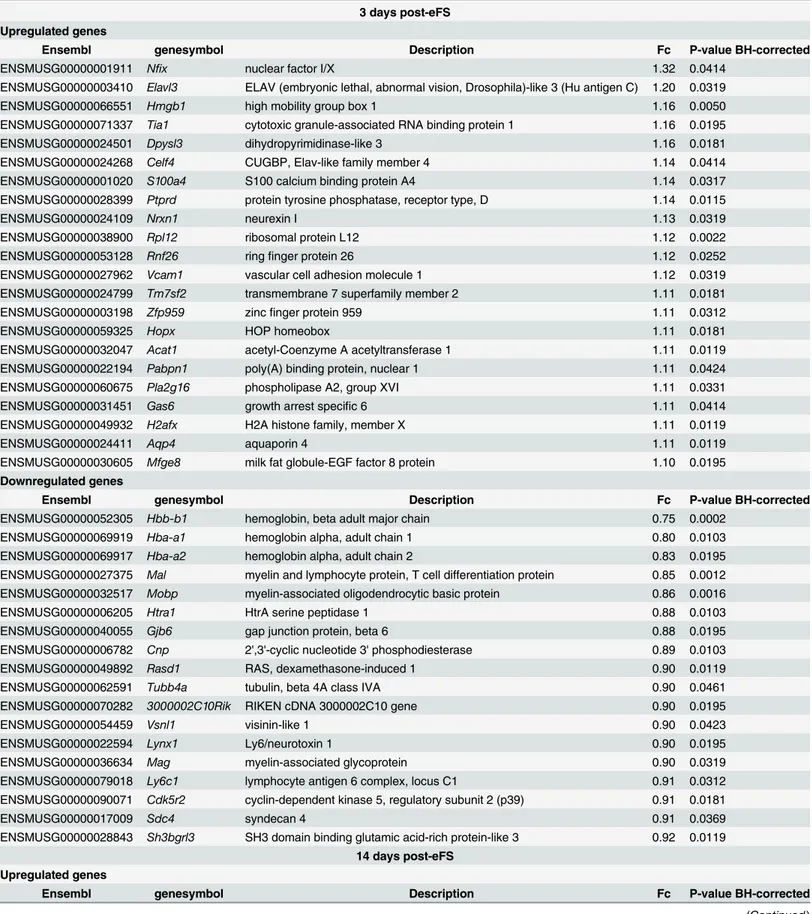
Table 2. Differentially expressed genes (up- and down- regulated) three, fourteen, and fifty-six days post-eFS.
3 days post-eFS Upregulated genes
Ensembl genesymbol Description Fc P-value BH-corrected
ENSMUSG00000001911 Nfix nuclear factor I/X 1.32 0.0414
ENSMUSG00000003410 Elavl3 ELAV (embryonic lethal, abnormal vision, Drosophila)-like 3 (Hu antigen C) 1.20 0.0319
ENSMUSG00000066551 Hmgb1 high mobility group box 1 1.16 0.0050
ENSMUSG00000071337 Tia1 cytotoxic granule-associated RNA binding protein 1 1.16 0.0195
ENSMUSG00000024501 Dpysl3 dihydropyrimidinase-like 3 1.16 0.0181
ENSMUSG00000024268 Celf4 CUGBP, Elav-like family member 4 1.14 0.0414
ENSMUSG00000001020 S100a4 S100 calcium binding protein A4 1.14 0.0317
ENSMUSG00000028399 Ptprd protein tyrosine phosphatase, receptor type, D 1.14 0.0115
ENSMUSG00000024109 Nrxn1 neurexin I 1.13 0.0319
ENSMUSG00000038900 Rpl12 ribosomal protein L12 1.12 0.0022
ENSMUSG00000053128 Rnf26 ringfinger protein 26 1.12 0.0252
ENSMUSG00000027962 Vcam1 vascular cell adhesion molecule 1 1.12 0.0319
ENSMUSG00000024799 Tm7sf2 transmembrane 7 superfamily member 2 1.11 0.0181
ENSMUSG00000003198 Zfp959 zincfinger protein 959 1.11 0.0312
ENSMUSG00000059325 Hopx HOP homeobox 1.11 0.0181
ENSMUSG00000032047 Acat1 acetyl-Coenzyme A acetyltransferase 1 1.11 0.0119
ENSMUSG00000022194 Pabpn1 poly(A) binding protein, nuclear 1 1.11 0.0424
ENSMUSG00000060675 Pla2g16 phospholipase A2, group XVI 1.11 0.0331
ENSMUSG00000031451 Gas6 growth arrest specific 6 1.11 0.0414
ENSMUSG00000049932 H2afx H2A histone family, member X 1.11 0.0119
ENSMUSG00000024411 Aqp4 aquaporin 4 1.11 0.0119
ENSMUSG00000030605 Mfge8 milk fat globule-EGF factor 8 protein 1.10 0.0195
Downregulated genes
Ensembl genesymbol Description Fc P-value BH-corrected
ENSMUSG00000052305 Hbb-b1 hemoglobin, beta adult major chain 0.75 0.0002
ENSMUSG00000069919 Hba-a1 hemoglobin alpha, adult chain 1 0.80 0.0103
ENSMUSG00000069917 Hba-a2 hemoglobin alpha, adult chain 2 0.83 0.0195
ENSMUSG00000027375 Mal myelin and lymphocyte protein, T cell differentiation protein 0.85 0.0012 ENSMUSG00000032517 Mobp myelin-associated oligodendrocytic basic protein 0.86 0.0016
ENSMUSG00000006205 Htra1 HtrA serine peptidase 1 0.88 0.0103
ENSMUSG00000040055 Gjb6 gap junction protein, beta 6 0.88 0.0195
ENSMUSG00000006782 Cnp 2',3'-cyclic nucleotide 3' phosphodiesterase 0.89 0.0103
ENSMUSG00000049892 Rasd1 RAS, dexamethasone-induced 1 0.90 0.0119
ENSMUSG00000062591 Tubb4a tubulin, beta 4A class IVA 0.90 0.0461
ENSMUSG00000070282 3000002C10Rik RIKEN cDNA 3000002C10 gene 0.90 0.0195
ENSMUSG00000054459 Vsnl1 visinin-like 1 0.90 0.0423
ENSMUSG00000022594 Lynx1 Ly6/neurotoxin 1 0.90 0.0195
ENSMUSG00000036634 Mag myelin-associated glycoprotein 0.90 0.0319
ENSMUSG00000079018 Ly6c1 lymphocyte antigen 6 complex, locus C1 0.91 0.0312
ENSMUSG00000090071 Cdk5r2 cyclin-dependent kinase 5, regulatory subunit 2 (p39) 0.91 0.0181
ENSMUSG00000017009 Sdc4 syndecan 4 0.91 0.0369
ENSMUSG00000028843 Sh3bgrl3 SH3 domain binding glutamic acid-rich protein-like 3 0.92 0.0119 14 days post-eFS
Upregulated genes
Ensembl genesymbol Description Fc P-value BH-corrected
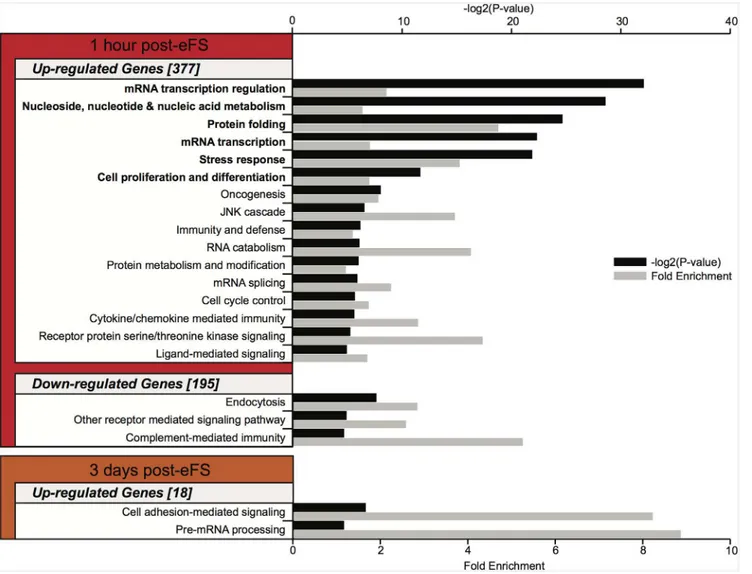
regulation, protein folding, stress response, and cell proliferation and differentiation (Fig 4, BH error correctedP<0.05). Downregulated genes one hour after eFS were associated (but not
significantly enriched after correction for multiple testing) to GO classification such as endocy-tosis and complement-mediated immunity. Three days after eFS upregulated genes were
Table 2. (Continued)
ENSMUSG00000018501 Ncor1 nuclear receptor co-repressor 1 1.27 0.0494
ENSMUSG00000006782 Cnp 2',3'-cyclic nucleotide 3' phosphodiesterase 1.26 0.0295
ENSMUSG00000037625 Cldn11 claudin 11 1.25 0.0078
ENSMUSG00000028385 Snx30 sorting nexin family member 30 1.21 0.0112
ENSMUSG00000063077 Kif1b kinesin family member 1B 1.18 0.0475
ENSMUSG00000025038 Efhc2 EF-hand domain (C-terminal) containing 2 1.17 0.0335
ENSMUSG00000029684 Wasl Wiskott-Aldrich syndrome-like (human) 1.15 0.0112
ENSMUSG00000054459 Vsnl1 visinin-like 1 1.15 0.0494
ENSMUSG00000036526 Card11 caspase recruitment domain family, member 11 1.15 0.0123
ENSMUSG00000036985 Zdhhc9 zincfinger, DHHC domain containing 9 1.15 0.0475
ENSMUSG00000076439 Mog myelin oligodendrocyte glycoprotein 1.13 0.0494
Downregulated genes
Ensembl genesymbol Description Fc P-value BH-corrected
ENSMUSG00000023087 Ccrn4l CCR4 carbon catabolite repression 4-like (S. cerevisiae) 0.86 0.0295
ENSMUSG00000030218 Mgp matrix Gla protein 0.86 0.0037
56 days post-eFS Downregulated genes
Ensembl genesymbol Description Fc P-value BH-corrected
ENSMUSG00000024617 Camk2a calcium/calmodulin-dependent protein kinase II alpha 0.89 0.0120
Fc: Fold change represents expression values of HT animals divided by expression values of NT animals.P-value BH-corrected: Benjamini and Hochberg (BH) error correctedp-values.
doi:10.1371/journal.pone.0145247.t002
Fig 2. Hierarchical clustering analysis of mRNA expression after eFS.Hierarchical clustering analysis of differentially expressed genes (930) in all experimental littermate couples (1 hour, 3 and 14 days post-eFS). Rows depict differential expression levels per HT/NT littermate couple, per time-point after eFS. Clustering was performed based on gene and sample clustering using Pearson correlation on average linkage. Tree cluster, right from heat-map, shows hierarchical distance between samples from the different time points. Differential gene expression (log2(Fc) between HT/NT littermate couples is shown in the heatmap as upregulated (red), downregulated (green), or no change (white) according to colored-scale bar.
associated to GO classifications cell-mediated adhesion signaling and pre-mRNA processing (but did not reach significance after correction for multiple testing). Due to the low number of genes in the geneset no enrichment of GO classification was found within the downregulated genes at three days after eFS, nor within all regulated genes at fourteen and fifty-six days after eFS.
All together, the GO analysis reveals that within the genelists, specific biological processes can be identified 1 hour and 3 days after eFS. This urges us to identify candidate genes impor-tant after hyperthermia-induced eFS.
Characterization of candidate genes implicated in structural
reorganization after eFS
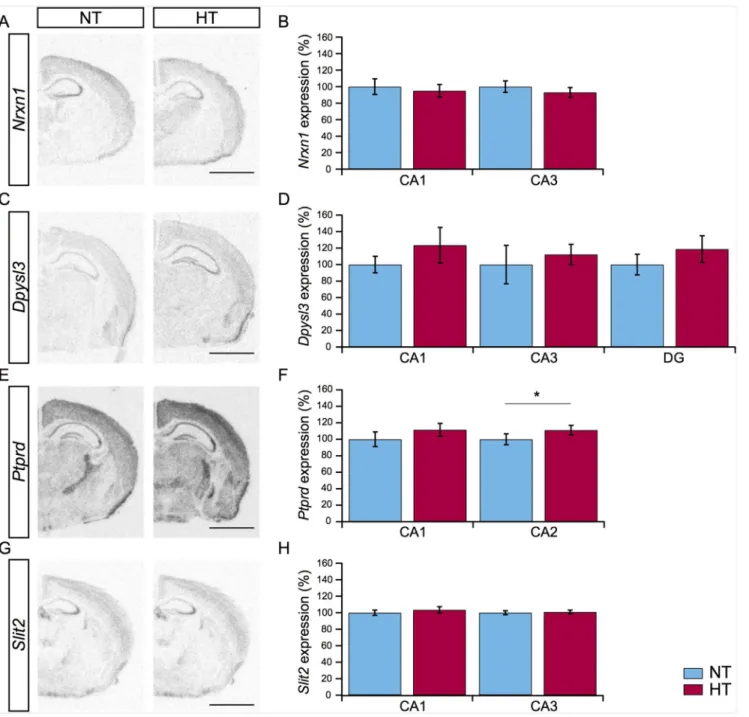
Transcriptional regulation at three days after eFS. Microarray gene expression analysis provided a list of significantly regulated genes three and fourteen days after eFS (Table 2). Closer examination of this list by GO analysis indeed showed transcriptional activity of genes related to structural reorganization. Based on literature and fold-change levels a number of candidate genes were selected. To characterize and validate the expression of these candidate genes we performed radioactive in-situ hybridization (RA-ISH) 3 days after eFS.33P RNA-probes specific againstNrxn1,Dpysl3,Ptprd, andSlit2were used for analysis of mRNA expres-sion in subfields of the hippocampus.
Neurexin1(Nrxn1) expression was prominent in the CA1 and CA3 subfields of the hippo-campus. Nrxn1 is important during the formation of excitatory synapses, synaptogenesis [38] (Fig 5A). Quantification ofNrxn1showed no significant regulation of expression in HT ani-mals within the CA1 and CA3 subfield (Fig 5B, NTn= 9, HTn= 9, littermate-paired Student’s t-test,P>0.05).Dpysl3, also known as collapsin response mediator protein 4 (Crmp4), acts as
a signaling molecule downstream from Sema3A, and is implicated in the regulation of neuronal dendrite development [39]. Expression ofDpysl3was quantified in the DG, CA1, and CA3 sub-field of the hippocampus. A widespread increase inDpysl3expression levels in all three sub-fields was observed (Fig 5C), but this increase was not statistically different between HT and NT littermates (Fig 5D, NTn= 9, HTn= 9, littermate-paired Student’s t-test,P>0.05).Ptprd,
Receptor-Type Tyrosine-Protein Phosphatase Delta, regulates axon guidance during brain
Fig 3. Validation of microarray results by qPCR analysis.Gene expression levels as determined by qPCR (Rn) in normothermic (NT) and hyperthermic (HT) animals compared to fold-change in expression of 5 genes as detected by microarray analysis (Rm).P<0.05 was considered significant (one-tailed Student’s
t-test). Indicated are mean±standard error of the mean.
development, and similar toNrxn1is important during synaptogenesis [40]. Expression of
Ptprdwas observed in the CA1 and, remarkably, clearly present in the CA2 subfield known to be resistant to cell death in TLE patients (Fig 5E, [41]). Expression ofPtprdwas significantly upregulated in CA2, but not in CA1, in HT animals compared to NT littermates (Fig 5F, NT
n= 9, HTn= 9, littermate-paired Student’s t-test, CA2:P= 0.0097 CA1:P>0.05).Slit2was
included in the analysis, because it was the highest (5.68-fold) upregulated gene involved in structural reorganization, 1 hour after eFS. It regulates axon guidance during development of the hippocampus and is differentially regulated during experimental epileptogenesis and in temporal lobe epilepsy patients [42]. Pronounced expression ofSlit2was observed in the CA3 subfield of the hippocampus (Fig 5G). No significant difference between HT and NT litter-mates was detected in relative expression levels 3 days after HT (Fig 5H, NTn= 9, HTn= 9, littermate-paired Student’s t-test,P>0.05).
Myelin sheath-associated changes fourteen days after eFS. The regulation of myelin-sheath associated genes three and fourteen days after eFS observed by the microarray gene
Fig 4. Gene ontology (GO) enrichment analysis on differentially expressed genes after hyperthermia exposure.GO biological process classifications with aP<0.05 are depicted (up- and downregulation) per time point. Numbers between brackets represent total Panther GO annotated genes used for GO analysis per geneset.P-value per GO classification is shown (black bar, -log2(Pvalue)), with corresponding fold enrichment (grey bar). Bold denoted GO classifications show significant enrichment (P<0.05) after Benjamini and Hochberg (BH) error correction.
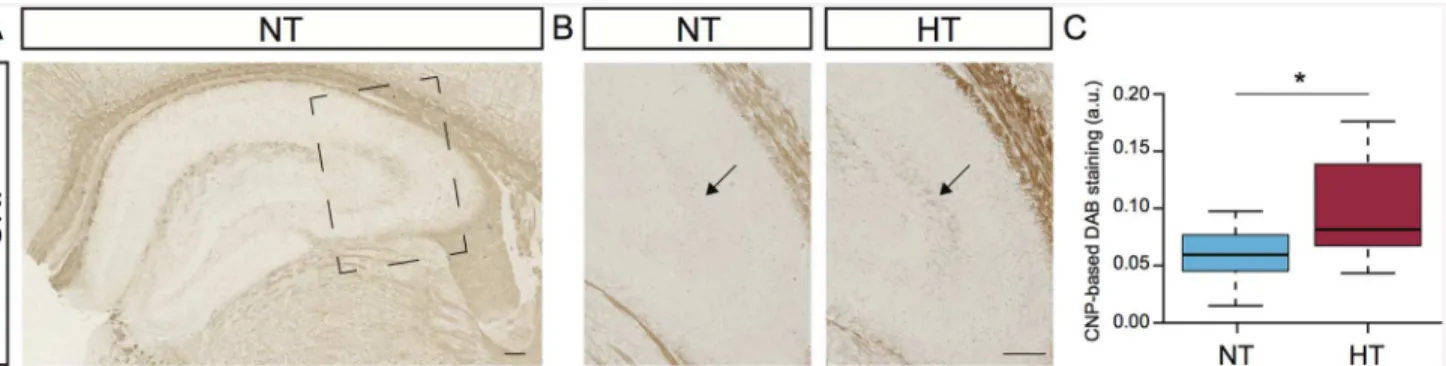
expression analysis prompted us to monitor protein expression of 2',3'-cyclic nucleotide 3' phosphodiesterase (CNP) in hippocampus. This gene was downregulated 3 days after eFS (0.8-fold) and upregulated 14 days after eFS (1.26-fold). CNP is predominantly expressed in myelin sheaths and oligodendrocytes, although it’s physiological function remains ambiguous, loss of CNP affects the stability of axons [43–45]. Immunostaining of CNP protein at fourteen days after eFS revealed expression mostly in the neurophil of the hippocampus (Fig 6A).
Fig 5. Expression of candidate genes mRNA related to structural reorganization.(A, C, E, G) Representative images ofNrxn1,Dpysl3,Ptprd, andSlit2
gene expression in the hippocampus of NT (left panel) and HT (right panel) animals three days after eFS. (B, D, F, H) Comparison ofNrxn1,Dpysl3,Ptprd, andSlit2gene expression levels in subfields of the hippocampus in HT (n= 9, red bars) animals compared to NT (n= 9, blue bars) littermates.Ptprdis upregulated in the CA2 subfield of the hippocampus of HT animals,*indicates a significant difference ofP= 0.0097, littermate-paired Student’s t-test. Bars represents mean±standard error of the mean. Scalebars in panel A, C, E, and G: 500μm.
Interestingly, comparison of CNP expression between HT and NT littermates indicated ele-vated levels of CNP within the stratum lucidum of the CA3 region, specifically. Quantification and pair-wise comparison of CNP-based DAB staining in the stratum lucidum between HT and NT littermates showed pronounced upregulation of CNP in HT animals (Fig 6B and 6C, Wilcoxon signed-rank testP= 0.0078).
Discussion
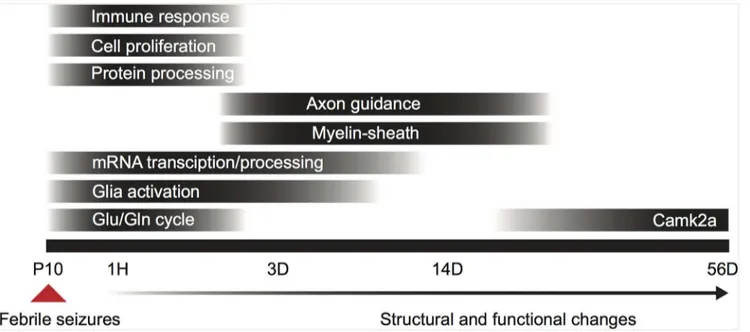
In this study we investigated the short- and long-term changes in hippocampal gene expression following hyperthermia-induced eFS in mice. To pinpoint molecular mechanisms underlying structural reorganization after eFS, we performed a genome-wide transcriptome analysis at 4 time-points: immediately (one hour), shortly (three days) and during the late phase (fourteen and fifty-six days) after induction of eFS. At these time-points we identified 877, 40, 13 and 1 eFS regulated genes, respectively. Here we show that timed regulation of multiple processes, such as heat-, immune- and inflammation response, glutamate-glutamine cycle, myelination, and structural reorganization, are triggered by eFS (Fig 7). Fourteen days after eFS expression of neurofilament, a marker for dentate gyrus mossy fibers, and CNP, a marker for oligodendrocyte activation and myelination, was increased in the stratum lucidum of the hippocampus. This indicates that already 14 days after eFS structural reorganization is taking place (Fig 7). We pro-vide epro-vidence that specific processes and molecular candidates are involved in structural reorga-nization within the hippocampus at three and fourteen days after eFS. This is the first study to characterize the transcriptional response to eFS in mice throughout a time-course of 56 days.
Transcriptional regulation after eFS
Analysis of hippocampal mRNA content identified 877, 40, 13, and 1 statistically significant regulated unique annotated gene(s) one hour, three, fourteen, and fifty-six days after eFS, respectively. Indicating a strong but transient regulation of gene expression during the first hour after eFS. As expected GO-analysis for gene enrichment related to specific biological pro-cesses reveals that eFS initially triggers a broad transcriptional response and a cellular response to heat (protein folding, stress response) as a direct response to the hyperthermia (Fig 7). Genes related to heat response includedHSP110,Hspb1,Hsph1, andDnajb1. Expression of IEGs (immediate early genes) such as,Arc,Fos,Egr1,Atf1,Nr4a1,Cyr61,Junduring and
Fig 6. Hyperthermia induced upregulation of 2',3'-cyclic nucleotide 3' phosphodiesterase (CNP) in the stratum lucidum.(A) Normal expression of CNP in the hippocampus of a normothermic (NT) control animal 14 days post-hyperthermia exposure. Square marks subfield enlargement, panel B and C. (B) Expression of CNP in the stratum lucidum of NT control animal (left panel) and hyperthermia-exposed (HT) littermate (right panel). Arrows indicates CNP-positive staining in the stratum lucidum. (C) Comparison of CNP-based DAB staining in the stratum lucidum between NT and HT littermates. All HT animals showed increased DAB-staining in the stratum lucidum. Increased expression of CNP were observed in HT animals compared to NT littermates, Wilcoxon signed-rank test,*indicatesP= 0.0078. Tukey-style box plots. Scalebars: 100μm.
directly after eFS is most likely due to the prolonged seizure activity. Expression of these IEGs probably represents profound neuronal activity in the hippocampal network as demonstrated earlier by intra-hippocampal EEG recordings during and after eFS [12,16,46,47]. The lack of regulation of these genes 56 days after eFS is in line with the fact that at this time-point (the majority of) HT mice do not yet suffer from recurrent seizures. Comparing the genelists at the different time-points revealed that 35% of all regulated genes (14 out of 40 genes) three days after eFS were also regulated one hour after eFS. The majority of upregulated genes three days after eFS (5 out of 6 genes) showed downregulation 1 hour after eFS. In contrast, downregu-lated genes (5 out of 8 genes), with exception of the top-three regudownregu-lated hemoglobin chain genes, 3 days after eFS were also downregulated 1 hour after eFS. Fourteen days after eFS, with exception of CNP, no overlap was observed with the regulated genes three days after eFS. How-ever, 23% (3 out of 13 genes) of the regulated genes fourteen days after eFS did overlap with those 1 hour after eFS. Due to the low number of differentially expressed genes per time-point it is difficult to make over-time expression wave profiles per GO biological process [48,49]. The observed switch between one hour and three days after eFS from down- to upregulation of sev-eral genes indicates that over-time expression wave profiles can be observed after eFS.
Glutamate-glutamine cycle. As a consequence of increased hippocampal neuronal activ-ity tight regulation of glutamate-glutamine cycle is of importance to avoid excitotoxic damage. Regulation of this process has already been described to play a key role in the susceptibility for febrile seizures and epileptogenesis in TLE patients [50–53]. Neuronal expressed glutaminase (Gls) converts glutamine to excitatory neurotransmitter glutamate. Glial glutamate transport-ers, such as excitatory amino acid transporter 2 (EAAT2, Slc1a2), avoid abnormal levels of extracellular released glutamate, by internalizing the neurotransmitter in the glial cells where it in turn is converted to glutamine by glutamine synthetase (Glul). One hour after eFS Glul is strongly reduced (0.90-fold), whereas Gls and Slc1a2 are upregulated (1.19-fold and 1.21-fold, respectively). The opposing regulation of Gls and Glul expression indicates an increase in glu-tamate production and less efficient synthesis of glutamine. As a consequence, changes in Glul and Gls expression may therefore contribute to an increase in neuronal excitability.
Fig 7. Timed regulation of biological processes after eFS.Bar blackness indicates the peak effect of the process. P10: postnatal day 10, 1H: 1 hour post-eFS, 3D: 3 days post-post-eFS, 14D: 14 days post-post-eFS, 56D: 56 days post-post-eFS, Glu/Gln cycle: glutamate/glutamine cycle.
Additionally, the upregulation of Slc1a2 might also reflect compensation to the increased gluta-mate production. Together with earlier findings of altered HCN-channel expression and func-tion after eFS, the above-stated observafunc-tions of Glul, Gls, and Slc1a2 expression indicate strong functional changes in neuronal excitability [17,21,54].
Immune and inflammatory response. Inflammatory processes, including regulation of chemokine and cytokine mediated immune response and complement-mediated immunity, are triggered during the first hour after eFS (Fig 7). Genes important in these processes included,CCL-2,CCL-3,ILr10-a/b,C1qa, andCr1l. Febrile seizures in rats also show a robust immune response directly after exposure to HT [49,55]. Similarly, electrical kindling of the dentate gyrus as a model for TLE, showed overlap in biological processes with our genelists. This initial regulation of genes related to stress- immune- and inflammatory response among several epileptic animal models indicates that seizure activity, independent of the precipitating event, triggers immune response in the hippocampus [48]. A growing body of evidence shows involvement of immune and inflammatory processes in epilepsy and febrile seizures [25,56,57]. For example the role of interleukin-1ß (IL-1ß) in febrile seizures is a prominent topic of debate [5,58]. IL-1ß is a, pyrogenic, fever-promoting proinflammatory cytokine, which promotes the development of febrile seizures. Typically, loss of IL-1ß receptor in mice results in resistance to eFS [59]. We did not observe differential regulation of IL-1ß or its receptor, which suggests that regulation of hippocampal IL-1ß and its receptor is not important after eFS. However this does not exclude function of IL-1ß during eFS.
Based on our data, increased expression of chemokines CCL-2 (1.25-fold) and CCL-3 (1.17-fold) suggests regulation of blood-brain barrier permeability. Interestingly, both chemo-kines are found to be upregulated in TLE patients at mRNA transcript and protein level [25,57]. Expression of CCL-3 at the apical membrane of vascular endothelial cells triggers adhesion of leucocyte, whereas basal localization of CCL-2 to the membrane facilitates the migration of the leucocytes through the endothelial surface [60–62]. The regulation of chemo-kines therefore contribute to the permeability of the blood-brain barrier, which is associated with epileptogenesis [56]. In addition, both CCL-2 and CCL-3 trigger Ca2+signaling in hippo-campal neurons resulting in increased excitability and synaptic transmission [63,64].
Cytokine receptor IL-10ra and IL-10rb are differentially regulated 1 hour after eFS. The ligand, IL-10, is generally regarded to have anti-epileptogenic effects [65,66], and is upregulated in hippocampus and cortex of TLE patients [57]. IL-10 and its receptor are both upregulated as a consequence of excitotoxic injury [67]. This suggests that, as a compensatory mechanism, IL-10 expression is induced to avoid exacerbation of the neuronal damage. Interestingly, the alpha and beta subunit of the heterotetrameric IL-10 receptor are up- (1.13-fold) and downregulated (0.90-fold), respectively, after eFS. Unfortunately not much is known about the differences in characteristics of IL-10 receptor subunits, especially regarding the receptor function in the brain. Also little is known about the specific functional implications of the downregulated com-plement factors C1qa (0.88-fold) and Cr1l (0.91-fold) in epilepsy. Reduced expression of the complement factors may suggest suppression of the complement cascade. However, activation of the complement system, i.e. upregulation of complement mediators including C1qa and C1r, has been reported in both experimental and human temporal lobe epilepsy [68] and is thought to contribute to neuronal hyper-excitability and seizures [56]. In summary, our findings indicate that chemokines, cytokines and complement factors are regulated as a result of eFS.
Genes involved in structural reorganization after eFS
study we found significant upregulation ofPtprdwithin the CA2 region of the hippocampus 3 days after eFS. Ptprd localizes to the pre-synapse where it interacts with post-synaptic neuro-trophin receptor tyrosine kinases (Trks) and bi-directionally activate signal transduction cas-cades to recruit synaptic proteins important for establishing and maintaining excitatory synapses [40]. Ablation ofPtprdmay therefore result in altered CA1 synaptic transmission and learning-deficits [69]. The observed increase ofPtprdwithin the CA2 may therefore trigger changes at excitatory synapse projecting to the CA1 [70]. Multiple lines of evidence suggest regulation of class 3 semaphorins after kainate acid-induced epilepsy in rodents [71,72]. Dpysl3, a downstream effector of Sema3A, was significantly regulated 3 days after eFS in our microarray and its mRNA expression was found in all subfields of the hippocampus. However, the widespread increase ofDpysl3expression in HT animals did not reach significance. Valida-tion of the candidate genes from the array, (Dpysl3,Nrxn1, andSlit2,) by in situ hybridization proved to be difficult. Most likely, this is due to heterogeneity in the transcriptional response of HT and NT littermates and detection sensitivity of RA-ISH.
Fourteen days after eFS, upregulation of CNP protein in the stratum lucidum confirmed our hypothesis that structural reorganization occurs after eFS. The upregulation of CNP indi-cates involvement of oligodendrocyte activation and myelin production. Interestingly,CNP
mRNA expression is downregulated (0.89-fold) three days after eFS, similar toMobp,Mal, and
Mag(0.86, 0.85, and 0.90-fold, respectively), which all represent myelination and oligodendro-cyte activation. However, fourteen days post HTCNPexpression as well as myelin oligoden-drocyte glycoprotein (Mog, 1.13-fold) is upregulated (1.26-fold). It would be interesting to learn what this switch in regulation of expression during the early to late phase after eFS means in terms of oligodendrocyte activation and myelination in the hippocampus. Possibly the rever-sal in expression has to do with different phases in structural reorganization, in which de- and re-myelination are required. It should be noted that mossy fibers to the CA3 are normally non-myelinated, hence the name stratum lucidum [73]. However, myelinated axons can be detected within the stratum lucidum, in particular after lesion of the enthorino-hippocampal perforant pathway [74]. This lesion induced axon sprouting in the stratum lucidum and recruited oligo-dendrocytes thought to myelinate the newly formed axon sprouts. Thus, our observed changes in CNP levels after eFS may indicate oligodendrocyte recruitment possibly contributing to myelination of newly sprouted axons. What the significance of these processes and oligoden-drocytes is during epileptogenesis remains to be determined [75].
All together, our data suggest that proteins related to structural organization of the nervous system, such as cell adhesion molecules, axon guidance proteins, and myelin production are regulated after eFS. Kainate acid-induced experimental mesial temporal lobe epilepsy in rats trigger regulation of proteins involved in structural organization, axon guidance signaling pathways, 14 days post-induction [76]. The observed eFS induced changes in axon guidance and myelin-related genes, as well as the immune response activity mentioned earlier, might therefore resemble processes underlying epileptogenesis independent of the precipitating event.
Glia activation
Interestingly, regulation of glia-associated genes was observed 1 hour and 3 days after eFS.
Gjb6(Connexin 30), a gap junction protein expressed in glial cells, remained downregulated (0.80-fold) until 3 days after eFS. Gap junction proteins are important for cell-to-cell commu-nication and exchange of small signaling molecules (<1000 Da) [77]. Other glia-associated
capillaries regulating transmembrane water transport [78]. BothAqp4andGjb6play important roles in regulation of osmolarity and energy metabolite housekeeping, therefore contribute to the epileptogenesis and are related to seizure severity [79]. Genetic ablation of either of the two genes results in prolongation of seizure duration or lowering of threshold for epileptic activity, respectively [79,80]. It remains to be determined by which mechanism these channels/junc-tions contribute to epileptogenesis. The regulation of these genes, including glia marker
S100a4, indicates activation of glial cells shortly after eFS.
Regulation of Camk2a 56 days after eFS
At 56 days after eFS, we found Camk2a to be the sole significantly (down)-regulated gene (Fig 7). Our results are in line with a recent study showing that Camk2a protein localization in the post-synaptic density (PSD) is reduced 25 days after recurrent febrile seizures [81]. In the same study, the phosphorylation state of Camk2a is changed in favor of Thr305over Thr286after recurrent febrile seizures. The reduction in Thr286phosphorylation results in higher dissocia-tion rates of Camk2a from the PSD [82]. Phosphoryladissocia-tion of Camk2a is a major trigger to consolidate synaptic potentiation during the early phase of long-term potentiation (LTP), an important mechanism for synaptic plasticity related to hippocampal learning [82]. The observed reduction in phosphorylation of Thr286and presence of Camk2a in the spine by Xionget al. [81] together with our observation of reduced Camk2a expression, may reflect a compensatory mechanism as a consequence to increased neuronal activity. Since lower number of and phosphorylation of Camk2a (Thr286), would result in decreased probability to elicit LTP at the synapse. Transcriptome analysis in the CA3 after electrical kindling of the DG also showed marked reduction of Camk2a during the latent phase, in addition to reduction directly and 1 week after kindling [48]. Our data support the notion that regulation of CaMK2a is involved in epileptogenesis.
Heterogeneity in transcriptional response during late phase after eFS in
mice
As mentioned earlier, in rat studies about 35–68% of all eFS animals show spontaneous epilep-tiform activity [15,22,23], which indicates that there is heterogeneity in response to eFS. All individual samples taken one hour, three days and fourteen days after eFS were used for hierar-chical clustering analysis and identified three clusters based on their transcription profiles. All samples within each cluster belonged to the same time-point. This indicates that transcrip-tional profiles of all individuals per time-point show a high degree of similarity, especially dur-ing the early phase after eFS. However, fourteen days after eFS sample cluster behavior shows a certain degree of heterogeneity in transcriptional response. This heterogeneity may reflect the process of epileptogenesis and its relation to susceptibility to develop spontaneous recurrent seizures. Because of the study design we cannot correlate transcriptional profiles with sponta-neous recurrent seizure outcome. Further longitudinal studies in mice will be required to deter-mine which animals develop spontaneous recurrent seizures after eFS and whether changes in transcriptome profiles can be used to predict seizure outcome.
Concluding Remarks
plasticity, described in other studies related to febrile seizures [14,18,47,54,83]. Other precipi-tating and susceptibility factors, such as stress [84] or genetic background [10,11], in concert with prolonged eFS, are likely to contribute to the development of TLE. It is of interest to study which factors increase the chance of spontaneous recurrent seizures later in life. The combina-tion of these factors with prolonged eFS, or repetitive exposure to eFS, will be required to vali-date our findings and provide valuable insight in the molecular mechanism behind the process of epileptogenesis. The observed local changes in NF and CNP expression indicate that hippo-campal subfield transcriptome analysis after eFS might contribute to the identification of can-didate genes. Additionally, identification of markers for epileptogenesis would greatly facilitate the ability to identify mice that will develop spontaneous recurrent seizures. This is the first study to identify regulated genes during a time-course of 56 days after eFS in mice (Fig 7). Our findings, in support with previous studies, identified initial regulation of immune and inflam-mation responses and glutamate-glutamine cycle. During the early phase and late phase glial-, myelin-, and axon guidance/cell adhesion related genes are regulated, together with increased expression of NF and CNP. These latter findings point to structural reorganization of the hip-pocampus after eFS in mice.
Supporting Information
S1 File. Sequences of primers used for qPCR and33P RNA probe generation.Table lists all primers used for qPCR experiments and the generation of33P RNA probes for radioactivein situhybridization.
(XLS)
S2 File. All differentially expressed genes (up- and down- regulated) 1 hour after eFS.Fc: Fold change represents expression values of HT animals divided by expression values of NT animals.P-value BH-corrected: Benjamini and Hochberg (BH) error correctedp-values. (XLS)
Acknowledgments
We thank members of the P.N.E.d.G laboratory for assistance and discussion.
Author Contributions
Conceived and designed the experiments: KLIvG AAK BCJ OvN FCPH PNEdG. Performed the experiments: BCJ AAK KLIvG AHOOE MdW IGWD MJAGK. Analyzed the data: BCJ KLIvG AAK AHOOE MJAGK. Contributed reagents/materials/analysis tools: MJAGK FCPH. Wrote the paper: BCJ KLIvG PNEdG.
References
1. Hauser WA. The prevalence and incidence of convulsive disorders in children. Epilepsia. 1994; 35 Suppl 2: S1–6. PMID:8275976
2. French JA, Williamson PD, Thadani VM, Darcey TM, Mattson RH, Spencer SS, et al. Characteristics of medial temporal lobe epilepsy: I. Results of history and physical examination. Ann Neurol. 1993; 34: 774–780. doi:10.1002/ana.410340604PMID:8250525
3. Theodore WH, Bhatia S, Hatta J, Fazilat S, DeCarli C, Bookheimer SY, et al. Hippocampal atrophy, epi-lepsy duration, and febrile seizures in patients with partial seizures. Neurology. 1999; 52: 132–136. PMID:9921860
4. Engel J. Mesial temporal lobe epilepsy: what have we learned? The Neuroscientist. 2001; 7: 340–352. PMID:11488399
6. Shinnar S, Bello JA, Chan S, Hesdorffer DC, Lewis DV, MacFall J, et al. MRI abnormalities following febrile status epilepticus in children: the FEBSTAT study. Neurology. 2012; 79: 871–877. doi:10.1212/ WNL.0b013e318266fcc5PMID:22843278
7. Lewis DV, Shinnar S, Hesdorffer DC, Bagiella E, Bello JA, Chan S, et al. Hippocampal sclerosis after febrile status epilepticus: the FEBSTAT study. Ann Neurol. 2014; 75: 178–185. doi:10.1002/ana. 24081PMID:24318290
8. Cross JH. Fever and fever-related epilepsies. Epilepsia. 2012; 53 Suppl 4: 3–8. doi: 10.1111/j.1528-1167.2012.03608.xPMID:22946716
9. Neligan A, Bell GS, Giavasi C, Johnson AL, Goodridge DM, Shorvon SD, et al. Long-term risk of devel-oping epilepsy after febrile seizures: a prospective cohort study. Neurology. 2012; 78: 1166–1170. doi: 10.1212/WNL.0b013e31824f807aPMID:22459683
10. Eckhaus J, Lawrence KM, Helbig I, Bui M, Vadlamudi L, Hopper JL, et al. Genetics of febrile seizure subtypes and syndromes: a twin study. Epilepsy Research. 2013; 105: 103–109. doi:10.1016/j. eplepsyres.2013.02.011PMID:23522981
11. Hessel EVS, de Wit M, Wolterink-Donselaar IG, Karst H, de Graaff E, van Lith HA, et al. Identification of Srp9 as a febrile seizure susceptibility gene. Ann Clin Transl Neurol. 2014; 1: 239–250. doi:10.1002/ acn3.48PMID:25590037
12. Hessel EVS, van Gassen KLI, Wolterink-Donselaar IG, Stienen PJ, Fernandes C, Brakkee JH, et al. Phenotyping mouse chromosome substitution strains reveal multiple QTLs for febrile seizure suscepti-bility. Genes, Brain and Behavior. 2009; 8: 248–255. doi:10.1111/j.1601-183X.2008.00466.x 13. Baram TZ, Gerth A, Schultz L. Febrile seizures: an appropriate-aged model suitable for long-term
stud-ies. Developmental Brain Research. 1997; 98: 265–270. doi:10.1016/S0165-3806(96)00190-3PMID: 9051269
14. van Gassen KLI, Hessel EVS, Ramakers GMJ, Notenboom RGE, Wolterink-Donselaar IG, Brakkee JH, et al. Characterization of febrile seizures and febrile seizure susceptibility in mouse inbred strains. Genes, Brain and Behavior. 2008; 7: 578–586. doi:10.1111/j.1601-183X.2008.00393.x
15. Koyama R, Tao K, Sasaki T, Ichikawa J, Miyamoto D, Muramatsu R, et al. GABAergic excitation after febrile seizures induces ectopic granule cells and adult epilepsy. Nature Medicine. 2012; 18: 1271–
1278. doi:10.1038/nm.2850PMID:22797810
16. Dube C, Chen K, Eghbal-Ahmadi M, Brunson K, Soltesz I, Baram TZ. Prolonged febrile seizures in the immature rat model enhance hippocampal excitability long term. Ann Neurol. 2000; 47: 336–344. PMID:10716253
17. Kamal A, Notenboom RGE, de Graan PNE, Ramakers GMJ. Persistent changes in action potential broadening and the slow afterhyperpolarization in rat CA1 pyramidal cells after febrile seizures. Euro-pean Journal of Neuroscience. 2006; 23: 2230–2234. doi:10.1111/j.1460-9568.2006.04732.xPMID: 16630069
18. Notenboom RGE, Ramakers GMJ, Kamal A, Spruijt BM, de Graan PNE. Long-lasting modulation of synaptic plasticity in rat hippocampus after early-life complex febrile seizures. Eur J Neurosci. 2010; 32: 749–758. doi:10.1111/j.1460-9568.2010.07321.xPMID:20646062
19. Jansen JFA, Lemmens EMP, Strijkers GJ, Prompers JJ, Schijns OEMG, Kooi ME, et al. Short- and long-term limbic abnormalities after experimental febrile seizures. Neurobiology of Disease. 2008; 32: 293–301. doi:10.1016/j.nbd.2008.07.010PMID:18707002
20. Toth Z, Yan XX, Haftoglou S, Ribak CE, Baram TZ. Seizure-induced neuronal injury: vulnerability to febrile seizures in an immature rat model. Journal of Neuroscience. 1998; 18: 4285–4294. PMID: 9592105
21. Brewster A, Bender RA, Chen Y, Dubé C, Eghbal-Ahmadi M, Baram TZ. Developmental febrile sei-zures modulate hippocampal gene expression of hyperpolarization-activated channels in an isoform-and cell-specific manner. J Neurosci. 2002; 22: 4591–4599. PMID:12040066
22. Dubé C, Richichi C, Bender RA, Chung G, Litt B, Baram TZ. Temporal lobe epilepsy after experimental prolonged febrile seizures: prospective analysis. Brain. 2006; 129: 911–922. doi:10.1093/brain/awl018 PMID:16446281
23. Kwak S-E, Kim J-E, Kim SC, Kwon O-S, Choi S-Y, Kang T-C. Hyperthermic seizure induces persistent alteration in excitability of the dentate gyrus in immature rats. Brain Research. 2008; 1216: 1–15. doi: 10.1016/j.brainres.2008.04.026PMID:18495095
25. van Gassen KLI, de Wit M, Koerkamp MJAG, Rensen MGA, van Rijen PC, Holstege FCP, et al. Possi-ble role of the innate immunity in temporal lobe epilepsy. Epilepsia. 2008; 49: 1055–1065. doi:10.1111/ j.1528-1167.2007.01470.xPMID:18076643
26. Yang YH, Dudoit S, Luu P, Lin DM, Peng V, Ngai J, et al. Normalization for cDNA microarray data: a robust composite method addressing single and multiple slide systematic variation. Nucleic Acids Research. 2002; 30: e15. PMID:11842121
27. Margaritis T, Lijnzaad P, van Leenen D, Bouwmeester D, Kemmeren P, van Hooff SR, et al. Adaptable gene-specific dye bias correction for two-channel DNA microarrays. Mol Syst Biol. 2009; 5: 266. doi: 10.1038/msb.2009.21PMID:19401678
28. Wu H, Kerr MK, Cui X, Churchill GA. MAANOVA: a software package for the analysis of spotted cDNA microarray experiments. The analysis of gene expression data. 2003. doi:10.1007/0-387-21679-0_14 29. Edgar R, Domrachev M, Lash AE. Gene Expression Omnibus: NCBI gene expression and hybridization
array data repository. Nucleic Acids Research. 2002; 30: 207–210. PMID:11752295
30. Pernot F, Dorandeu F, Beaup C, Peinnequin A. Selection of reference genes for real-time quantitative reverse transcription-polymerase chain reaction in hippocampal structure in a murine model of temporal lobe epilepsy with focal seizures. J Neurosci Res. 2010; 88: 1000–1008. doi:10.1002/jnr.22282PMID: 19937810
31. Saeed AI, Sharov V, White J, Li J, Liang W, Bhagabati N, et al. TM4: a free, open-source system for microarray data management and analysis. BioTechniques. 2003; 34: 374–378. PMID:12613259 32. Huang DW, Sherman BT, Lempicki RA. Bioinformatics enrichment tools: paths toward the
comprehen-sive functional analysis of large gene lists. Nucleic Acids Research. 2009; 37: 1–13. doi:10.1093/nar/ gkn923PMID:19033363
33. Huang DW, Sherman BT, Lempicki RA. Systematic and integrative analysis of large gene lists using DAVID bioinformatics resources. Nature Protocols. 2009; 4: 44–57. doi:10.1038/nprot.2008.211 PMID:19131956
34. Boender AJ, Koning NA, van den Heuvel JK, Luijendijk MCM, van Rozen AJ, la Fleur SE, et al. AAV-mediated gene transfer of the obesity-associated gene Etv5 in rat midbrain does not affect energy bal-ance or motivated behavior. PLoS ONE. 2014; 9: e94159. doi:10.1371/journal.pone.0094159PMID: 24710089
35. Malik AR, Urbanska M, Gozdz A, Swiech LJ, Nagalski A, Perycz M, et al. Cyr61, a matricellular protein, is needed for dendritic arborization of hippocampal neurons. J Biol Chem. 2013; 288: 8544–8559. doi: 10.1074/jbc.M112.411629PMID:23362279
36. Richter F, Meurers BH, Zhu C, Medvedeva VP, Chesselet M-F. Neurons express hemoglobin alpha-and beta-chains in rat alpha-and human brains. Journal of Comparative Neurology. 2009; 515: 538–547. doi: 10.1002/cne.22062PMID:19479992
37. Dennis G, Sherman BT, Hosack DA, Yang J, Gao W, Lane HC, et al. DAVID: Database for Annotation, Visualization, and Integrated Discovery. Genome Biol. 2003; 4: P3. PMID:12734009
38. de Wit J, Sylwestrak E, O'Sullivan ML, Otto S, Tiglio K, Savas JN, et al. LRRTM2 interacts with Neur-exin1 and regulates excitatory synapse formation. Neuron. 2009; 64: 799–806. doi:10.1016/j.neuron. 2009.12.019PMID:20064388
39. Niisato E, Nagai J, Yamashita N, Abe T, Kiyonari H, Goshima Y, et al. CRMP4 suppresses apical den-drite bifurcation of CA1 pyramidal neurons in the mouse hippocampus. Devel Neurobio. 2012; 72: 1447–1457. doi:10.1002/dneu.22007
40. Takahashi H, Arstikaitis P, Prasad T, Bartlett TE, Wang YT, Murphy TH, et al. Postsynaptic TrkC and presynaptic PTPσfunction as a bidirectional excitatory synaptic organizing complex. Neuron. 2011; 69:
287–303. doi:10.1016/j.neuron.2010.12.024PMID:21262467
41. Babb TL, Brown WJ, Pretorius J, Davenport C, Lieb JP, Crandall PH. Temporal lobe volumetric cell densities in temporal lobe epilepsy. Epilepsia. 1984; 25: 729–740. PMID:6510381
42. Fang M, Liu G-W, Pan Y-M, Shen L, Li C-S, Xi Z-Q, et al. Abnormal expression and spatiotemporal change of Slit2 in neurons and astrocytes in temporal lobe epileptic foci: A study of epileptic patients and experimental animals. Brain Research. 2010; 1324: 14–23. doi:10.1016/j.brainres.2010.02.007 PMID:20153733
43. Edgar JM, McLaughlin M, Werner HB, McCulloch MC, Barrie JA, Brown A, et al. Early ultrastructural defects of axons and axon-glia junctions in mice lacking expression of Cnp1. Glia. 2009; 57: 1815–
1824. doi:10.1002/glia.20893PMID:19459211