Information about the author
JEL classiication: E30, F15, O47 D. Stavárek, L. Tomanová
IS THE REGION OF VISEGRAD COUNTRIES
ON THE TRACK TO THE EURO AREA? RECENT EVIDENCE
FROM THE REAL CONVERGENCE PERSPECTIVE
1After enlargement of the European Union and subsequently joining of a new member states to the euro area, the question of economic convergence attracted considerable research interest. This paper adopts three alternative concepts to examine the level and trend of convergence in the Visegrad countries (Czech Republic, Hungary, Poland, Slovakia). We concurrently estimate the β-convergence, σ-convergence and business cycle synchronization to ind out whether all countries are on the way towards higher convergence with the euro area. The results suggest that convergence of all countries has been increasing. However, the recent acceler
-ation of the convergence process is caused mainly by external shocks in the form of the inancial crisis and following economic slowdowns. Hence, the current level of convergence in the Visegrad countries cannot be considered as fully adequate.
Keywords: convergence, Visegrad countries, euro, area
1. Introduction
The concept of convergence is a complex is-sue from the economic theory perspective. Convergence is understood as an aligning devel-opment of economic variables while the difference between two or more variables at a time decreases. Therefore, it is seen as a process that is approach-ing a certain equilibrium level.
Originally, the mainstream of the conver-gence debate was the question whether in-come levels of poorer countries are converging to those of richer countries. Further, this ques-tion was linked to the economic growth theory. In particular, convergence was considered as an implication of the neo-classical growth the-ory. Therefore, testing for convergence was
fre-1 © Stavárek D., Tomanová L. Text. 2014.
quently used as a test of validity of alternative economic growth theories. Growing importance of convergence along with rising interest of in-vestigators in this issue has consequently led to numerous different interpretations of conver-gence and a wide array of empirical results, so much that the current convergence research can give the impression of being spread across many aspects and disciplines.
The study [17] summarizes dichotomies that clearly indicate how differently the convergence can be understood in a literature. In addition, the following classiication helps in orientation with what are the current trends in the dispute over convergence.2
1. Convergence within an economy vs. conver-gence across economies.
2. Convergence in terms of growth rate vs. con-vergence in terms of income level.
3. β-convergence vs. σ-convergence.
4. Unconditional (absolute) convergence vs. conditional convergence.
5. Global convergence vs. local or club-convergence.
6. Income convergence vs. total factor produc-tivity convergence.
7. Nominal convergence vs. real convergence. 8. Deterministic convergence vs. stochastic convergence.1
In this paper, we address convergence from the perspective of integration to the euro area. Accordingly, we restrict the analysis only on some of the above-mentioned classiications. We par-ticularly deal with convergence across economies, however, on the local or club level. We compare results of alternative approaches including β-con-vergence and σ-conβ-con-vergence.
The real convergence usually captures ap-proaching of standard of living (typically meas-ured by GDP per capita in purchasing power par-ity basis) in different countries to a common long-term equilibrium state, thus how a less developed country catches up with more developed country. A comprehensive elaboration of this concept of the real convergence is provided in [12], [4] or [21]. Alternatively, the real convergence can be under-stood as synchronization of the business cycle of a country to the reference country or group of the countries [7] or as cohesion of individual regions/ countries within the integration group [8].
The phenomenon of economic convergence has been tightly connected with the process of economic integration. Convergence possesses a crucial importance in integration groups, particu-larly in economic and monetary unions. One can distinguish between two general approaches that link economic convergence and monetary integra-tion. The irst requires a suficient level of busi-ness synchronization, which is considered as a precondition of joining the monetary union with a single currency and monetary policy. This con-cept is proposed by [18] or [6]. The second concon-cept, by contrast, assumes that the convergence process is inherently stimulated and speeded up after a country joins the monetary union. As argued by [14], establishment of a monetary union strength-ens trade ties and may lead to more closely syn-chronized business cycles.
1 We refer to [18] or [35] for a detailed discussion on all conver-gence dichotomies.
After the eastern enlargement of the EU many of the EU newcomers already had joined the euro area and the remaining countries are likely to do so as well at some point. Therefore, economic con-vergence is one of the most important economic developments in the EU and the euro area, and there is a continuous need for evaluation of the progress achieved by the new member states in economic convergence. Although the EU evalu-ates new member stevalu-ates from a nominal conver-gence approach, and publishes the Converconver-gence report annually, the real convergence seems to be a better tool for assessment of a country’s prepar-edness to proceed with integration and join the monetary union. In other words, while the nomi-nal convergence is a necessity for application and joining the euro area, the real convergence pro-vides the assumption that beneits outweigh the cons of monetary integration.
The aim of the paper is to quantify and eval-uate the convergence achieved by the group of Visegrad countries (Czech Republic, Hungary, Poland, Slovakia) towards the euro area. We use a parallel application of various empirical methods to obtain a relevant and full-bodied set of results. In particular, we estimate the β-convergence, σ-convergence and business cycle synchroniza-tion. The main advantage of this approach is that we can simultaneously examine outcomes of in-dividual methods that shed some light on conver-gence from different perspectives. This is also the key aspect that distinguishes the present paper from previously published studies on convergence in the Visegrad countries (hereafter V4 countries), e. g. [19], [29] or [11]. In addition, the selection of the countries allows us to not only compare the level of convergence across the countries but also to reveal whether joining the euro area with a par-ticular interest in Slovakia has stimulated the con-vergence process more than ‘simple’ membership in the EU.
The remainder of the paper is structured as follows. In Section 2, a review of relevant litera-ture is provided. In Section 3, we examine the real convergence with the above-mentioned methods. Section 4 concludes the paper with a summary of main indings.
2. Literature review
con-vergence examined in the cited papers. The same structure then applies for the empirical section of the paper to make our results easily comparable with outcomes of previous research.
A burgeoning set of literature has also been published in the ield of real convergence of the EU new member states towards the euro area. However, the papers differ in many aspects such as country structure of datasets, period under es-timation, and methods to determine the conver-gence or deinition of a steady state. Hence, only a few robust patterns can be derived from these studies. First studies were applying the concepts of β-convergence and σ-convergence for analy-sis of real convergence in the Central and Eastern European (CEE) countries began to appear in the late 1990s. However, the studies employing suf-iciently large datasets from CEE countries were published not earlier than 2002.
The studies usually came to the conclusion that real convergence in CEE countries had been relatively fast. For example [20] reports that seven CEE countries have converged signiicantly to-wards the average EU15 GDP per capita level in 1993–2001. Based on results of cross-sectional approach, he estimates the rate of income conver-gence of 3.4 % annually for all CEE countries un-der estimation. He also inds an increase of σ -con-vergence if the seven CEE countries are included in the investigation group along with the old 15 EU members. These results are largely supported by indings in [30]. Using the pooled least squares method, they identify the rapidest process of con-vergence in Baltic countries followed by Hungary and Slovenia. The speed of converging with the EU level was especially remarkable during the period 2001–2004 when the growth differential between EU15 and the accession countries was around 2.2 % per annum. They also discovered a reduction in the dispersion of income levels between the accession countries, which is evidence that σ-convergence also existed. Similarly with previously cited stud-ies, [23] use data on GDP per capita at purchasing power parity standards and other economic indi-cators like industrial production or business con-idence and apply them on pooled regression anal-ysis to estimate the speed of β-convergence. They show that the rate of real convergence was higher in the period 1998–2003 (4.1 %) than in the pe-riod 1993–1998 (2.7 %). Next, [28] estimated β-convergence for some Central European coun-tries (Czech Republic, Slovakia, Slovenia, Poland, and Hungary) from 1992 to 2004. The results sup-port convergence to the EU15 countries by 1.74 % annually and new EU member countries converge to the EU average by 1.77 % annually.
The recent literature which covers the period after the EU enlargement in 2004 conirms the previous indings on ongoing real convergence in CEE countries towards the EU. For instance, [31] present analysis of β-convergence and σ-conver-gence among 10 new EU members and extend the estimation period to the end of 2006. Estimations of panel regressions lead to the conclusion that the speed of convergence accelerated over time. During 1995–2006 and 2002–2006, convergence occurred at the rate of 7.0 % and 9.6 %, respec-tively. This implies effective integration go-ing on among the 10 new member states which joined EU in 2004. They also conirm presence of σ-convergence and its hastening in 2003–2006. Contemporary studies also come up with new ap-proaches to estimation of the real convergence pace. Further, [1] introduced Gini coeficients esti-mated on basis of Lorenz curve model as a tool for measurement of real convergence in CEE coun-tries. One such estimating procedure in case of the GDP per capita time series in the period 2000-2011 demonstrated an accentuated convergence process inside the group of 10 new members, but a signiicant divergence inside the group EU15. The crisis seems to have no detectable impact on the convergence process inside of the two groups of EU countries. The study [24] uses Bayesian model averaging (BMA), time dummies and Blundell and Bond’s GMM system estimator on new EU mem-bers data from 1993–2010.The analysis revealed that the EU27 countries converged at the rate of about 5 % per annum during the EU15 countries at 3 % per annum.
The synchronization of business cycles among EU member states, both within the euro area and between candidate countries and the monetary union, has been studied extensively in the liter-ature. There are two basic questions raised in the business cycles synchronization literature. First, the authors attempt to ind out whether a com-mon business cycle exists within a group of coun-tries. Second, the level of business cycles synchro-nization of a particular country is estimated in or-der to determine whether this country could be a member of the monetary union. A lack of synchro-nization would mean ineficient use of the sin-gle currency and thus an obstacle for entering the euro area.
conirmed existence of an ongoing convergence process. By contrast, [9] applied similar analysis to a set of EU countries, new EU member states and some industrialized countries. They argue that strong synchronization was found only in the core EU countries, but they found no evidence in favor of the existence of just one European business cy-cle. Next, [15] applied meta-analysis and surveyed nearly 30 studies with almost 350 point estimates of business cycle correlation between central and eastern European countries and the euro area. The results show that economic cycles in these coun-tries are highly correlated with the euro area cy-cle, especially in the case of Hungary, Poland and Slovenia. For the majority of the new EU mem-bers, the business cycle correlation is suficiently high as not to hinder a membership in the mone-tary union.
The most recent literature conirms previ-ous results and provides evidence on the contin-uing process of convergence. The study [25] ana-lyzed business cycles synchronization of central and eastern European and Baltic countries using a rolling window correlation of GDP and industrial production time series. The results suggest chang-ing convergence patterns and point to divergchang-ing trends in CEE countries between 2001 and 2007. However, countries converged signiicantly dur-ing 2008–2011 which possibly relects negative GDP performance of developed European econ-omies. Moreover, [18] support this conclusion by their inding of a global European factor1 that cap-tures well the sharp fall in real output observed during 2008 and 2009, and the weak recovery in 2010 and 2011. Their results also show that the business cycle of most euro area countries is ex-tremely tightly matched with the global European factor. Most central and eastern European coun-tries (with the exception of the Czech Republic) also show a strong correlation with the European business cycle.
3. Real convergence in the visegrad countries The real convergence is based on the neoclas-sical growth theory, which deals with the conver-gence of economic variables to a steady state and is understood as convergence of economic level of one country to other country’s economic level [32]. Real convergence is usually expressed in terms of GDP per capita. International comparisons are performed in terms of purchasing power parity (PPP), which relects the purchasing power of the
1 Global European factor is one the factors included in the multi-factor model thought to characterize the temporal co-movements in the cross-country panel of time series.
domestic currency and thus eliminates price dif-ferences between economies. The relationship be-tween two economies’ levels can be formally writ-ten as follows:
1, 1 1,
2, 1 2,
t t
t t
y y
y y
-< for y1,t<y2,t (1)
where y is the real income of country 1 and 2 at the time t–1 and t. This relationship can be in-terpreted as decreasing of the relative distance of economic levels over time.
Real convergence can also be understood as a structural convergence of economies or used tech-nologies [28]. In this paper, we estimate the con-vergence of GDP per capita that is the most com-monly used indicator when estimating the eco-nomic convergence. We particularly analyze real convergence by considering the process of approx-imation of the V4 economies to the average levels of income of the euro zone countries as more ad-vanced countries. The process of convergence can be formulated similarly based on the absolute dif-ference, written as follows [28]:
1, 1t 2, 1t 1,t 2,t ,
y - -y - > y -y (2) where y1,t and y2,t again represent the GDP per cap-ita of two different countries (V4 country and the euro area) in current (t) and previous (t–1) time periods. When the opposite sign occurs, the situ-ation is called divergence, meaning the economic levels of two countries are drifting apart from each other.
3.1. β-convergence
β-convergence is typically tested by regress-ing the growth measured as GDP per capita on the initial relative level across a cross-section of countries. Following the concept proposed by [3], β-convergence can be approximated by:
,
,0 ,
,0
1log i T log( ) ,
i i T i
i y
y Z
T y
= α + β + γ + e
(3)
where the left side of equation expresses average growth rate of real GDP per capita in period 0 to
T depending on its initial level yi,0, T is the num-ber of years from 0 to T, Z includes other factors
supposedly affecting the growth rate (if other fac-tors are not included, the convergence is said to be unconditional). Coeficients β, γ and α are pa-rameters to be estimated and ei is a residual com-ponent. If a negative relationship between the growth rate and the initial level of GDP per cap-ita yi,0 is signiicant and negative, the sign of ongo-ing convergence process can be conirmed. The es-timated value of β also relects the rate of conver-gence towards the steady state.
Equation (3) implies the convergence of meas-uring the size difference in steady state, long-term level with constant income per capita (at zero growth). However, we do not assume zero growths but consider GDP development through the analyzed period. Therefore, we determined a steady state as the economic performance of the euro area (EA 17) countries. Our model is based on nonlinear regression and estimated by the classi-cal method of least squares. We estimate a sepa-rate model for each country rather than estimat-ing groups of countries followestimat-ing a model speci-ication proposed in [16]. A similar approach was used e.g. in [10]:
,
, , , ,
,
log i t log ,
i t i t EA t i t EA t
y
y y
= α + β + e
(4)
where , ,
i t
EA t y
y is the GDP per capita in purchasing power parity standards of a Visegrad country i di-vided by average level of real euro area GDP per capita in time t, αi,t is a constant, βi,t represents a regression coeficient, ei,t represents a random component and t denotes the years from 1995 to 2012. An important target of the empirical re-search is to estimate the value of parameter βi,t since convergence occurs in the case of a positive slope of βi,t. A positive slope is caused by the econ-omies’ convergence from the bottom towards the euro area level. On the other hand, a negative sign of the parameter value indicates β-divergence.
The analysis covers the period 1995–2012 and is based on annual GDP per capita at purchasing
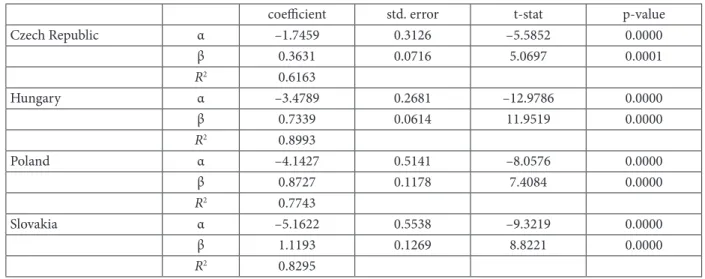
power parity standards. All data used are drawn from the Eurostat database. Based on the esti-mation of separate national models we obtained four regression parameters of β-convergence. All important estimation results are summarized in Table I. During estimation, we applied all standard diagnostic tests and, hence, the models are veri-ied to be statistically and econometrically correct. We are particularly interested in value and signii-cance of parameter β because these are indicators whether the process of convergence is ongoing.
The estimated regression coeficients are sta-tistically signiicant at the 1 % signiicance level. This means that we can objectively evaluate, on the basis of the formulation of the model (4) that the real convergence in all V4 countries occurred during the period of estimation. However, the speed of convergence differed across the coun-tries. Relevance of the obtained results is also ev-idenced by the relatively high value of the coefi-cient of determination (R2).
We found the strongest evidence of conver-gence to the euro area in Slovakia where the co-eficient β reached value of 1.12. If the period of estimation is widened to 1994–2012, we can ob-serve an even faster pace of convergence of 1.77. Slovakia is followed by Poland and Hungary with coeficient β of 0.87 and 0.74 respectively. We identiied the Czech Republic as the Visegrad country with the slowest real convergence towards the EA 17 average. The respective coeficient β was only 0.36 which is roughly three times less that in Slovakia and half of the two other analyzed coun-tries. Results on convergence for the V4 countries are generally in line with the results obtained by other researchers as far as the general inding of ongoing real convergence is concerned. The re-sults indicate that economic growth paths of the V4 countries conirm the existence of β-conver-gence. However, the speed of convergence es-timated in the present study seems to be slower than suggested by previous research. Only results for Slovakia, which is the only euro area member country in our sample, conirm values of the coef-icient β (speed of convergence) that have been es-timated in earlier studies.
3.2. σ-convergence
model estimation. Criterion of σ-convergence was constructed in order to obtain additional informa-tion on the convergence path. Similarly with the β-convergence, it is also based on the neoclassi-cal growth model according to which all countries converge to the same level of maturity or to the same economic performance. In general, less ad-vanced countries grow faster than more adad-vanced countries; however, this does not guarantee a sys-tematical reduction of income dispersion between these countries. Existence of β-convergence is a necessary condition for σ-convergence; how-ever, the reverse relationship may not apply [5]. The σ-convergence takes place if the less devel-oped areas close the gap in per capita income be-tween them and a more afluent economies over time. Thus, σ-convergence is deined as a reduc-tion of variance of real GDP per capita logarithm
between economies over time. The coeficient of variation is a normalized measure of dispersion of a probability distribution. It is deined as the ratio of the standard deviation to the mean. If we de-note the variance of the logarithm of real GDP per capita in the group of countries at time t, then the σ-convergence between period t and t + 1 can be expressed as:
σt>σt+ 1 (5)
To test σ-convergence, we analyze the ten-dency of income dispersion by estimating the var-iance of GDP per capita in purchasing power par-ity standards. The estimation was made for the pe-riod 1995–2012. Veriication of σ-convergence can be best accomplished through visible changes of variance from a chart. For this reason, we present Figure 1 that depicts development of variability Table I Estimations of β-convergence
coeicient std. error t-stat p-value
Czech Republic α –1.7459 0.3126 –5.5852 0.0000
β 0.3631 0.0716 5.0697 0.0001
R2 0.6163
Hungary α –3.4789 0.2681 –12.9786 0.0000
β 0.7339 0.0614 11.9519 0.0000
R2 0.8993
Poland α –4.1427 0.5141 –8.0576 0.0000
β 0.8727 0.1178 7.4084 0.0000
R2 0.7743
Slovakia α –5.1622 0.5538 –9.3219 0.0000
β 1.1193 0.1269 8.8221 0.0000
R2 0.8295
Source: Authors’ calculations based on data from Eurostat
coeficients in income between V4 countries and separately between a particular country and EA 17 average.
It is shown that even if income dispersion among the V4 countries was generally decreasing, one can also observe some episodes of increased dispersion. While the disparities among V4 coun-tries remained relatively stable during the period 1998–2007, the recent development shows greater convergence even within the V4 region. In the case of particular countries, the convergence process towards the EA 17 accelerated in 2000 (post-trans-formation period) and has been continuing since then. Hungarian variance, on the other hand, in-creased in 2007, caused by economic slowdown connected with the reduction of domestic demand and expenditures as a result of iscal measures. Moreover, after the outbreak of the crisis in the USA, Hungary was the irst V4 country which was fully hit by its global implications.
In the next period, the convergence process continued until 2009. A slight slowdown of conver-gence occurred since 2009 in the case of Slovakia and Poland, which relects the economic down-turn. In the case of the Czech Republic, income differentiation increased in the period 1996– 2000 when the Czech Republic faced an economic downturn caused by a combination of issues (lin-gering transformation, structural changes, and currency crisis). Development of variance gained a slight increasing trend again during 2010–2012. It is evident that the dispersion between particular Visegrad countries and the euro area has signii-cantly decreased over the analyzed period. Hence, the σ-convergence approach reveals ongoing con-vergence of the V4 countries towards the euro area. In summary, we can conclude that the abso-lute convergence of the V4 countries towards the euro area revealed in the β-convergence estima-tions is conirmed by results of the σ-convergence.
3.3. Synchronization of business cycles
Joining the euro area is automatically associ-ated with implementation of a common monetary policy that relects economic development of the entire monetary union and not a single country. Therefore, the common monetary policy can cause disadvantages in terms of higher economic costs for a country that is in a different stage of the eco-nomic cycle than the euro area average. In terms of the theory of optimum currency areas, partic-ipation in the euro area of a country with higher synchronization of the business cycle is less costly than for a country with low synchronization. The occurrence of asymmetric shocks in a monetary un-ion may hamper monetary policy implementatun-ion. If a potential member of a monetary union is
sub-ject to symmetric economic shocks, the beneits of a common currency exceed the cost of relinquish-ing a national autonomous monetary policy [6]. The business cycle synchronization is, therefore, a complement to the real convergence analysis since it takes a different view on joining the monetary union. By estimation of business cycle synchroni-zation, we can reveal whether a suficient level of achieved convergence would not be ruined by a di-vergence in business cycle evolution. Therefore, we consider the analysis of the business cycle synchro-nization as essential to complete the investigation of the V4 convergence to the euro area.
Cyclical synchronization can be estimated by means of correlation coeficients. Therefore, if business cycles correlation between V4 countries and the euro area is suficiently high and signif-icant, these countries fulil the condition of a cy-clical synchronization, which suggests better pre-paredness for single currency adoption and the subsequent beneits. A simple method to deter-mine the cyclical synchronization is to compute correlation coeficients between V4 and euro area cycles. If there is a signiicant correlation between the cycles, the analyzed economies should respond similarly to external shocks. If the correlation is not signiicant, it would not be possible to set up a common economic policy so that the policy would result in desirable economic development.
Figure 3 shows the ive-year rolling correla-tion of business cycles derived from GDP. A con-verging trend is signiicant, especially in recent years (2008–2012). However, estimation also re-veals a divergence of business cycles before the hit of the inancial crisis. A sharp increase of corre-lation since 2008 in the case of all V4 countries can be partly attributed to an increase in busi-ness cycle synchronization; however, the effect of a severe economic downturn probably had a dom-inant impact. During 2007, the pace of economic growth began to slow in V4 countries and the euro area, which can be interpreted as a transition to a downward phase after reaching the peak of the economic cycle. Among the V4 countries, Poland shows strong improvement in cyclical correla-tion since 2002 and a great synchronizacorrela-tion of the business cycle with the euro area business cycle
since the end of 2007. A converging trend started to take place in the case of the Czech Republic in 2005 with coeficients ranging from 0.3–0.6 which is rather sharp increase. The Hungarian cycle shows almost no tendency to move toward greater synchronization and thus reveals a diverg-ing trend until 2007. Regarddiverg-ing Hungary’s GDP and economic situation development, domes-tic factors had a signiicant inluence on the cy-cle. Surprisingly, Slovakia shows a similar pace of the correlation coeficients as Hungary. Although increasing synchronization since 2007 can indi-cate a higher convergence of all V4 countries, one should bear in mind that this was mainly caused by an external shock and its effect is likely to van-ish over time. Hence, the conclusion that business cycles synchronization is high, convergence sufi-cient and monetary integration easily practicable
Fig. 2. Five-year rolling correlation of business cycles (GDP) to the EA17 average. Source: Authors’ calculations based on data from Eurostat
would be misleading. In other words, the recent high correlation coeficients should not be used as an argument in favor of joining the euro area in the near future.
Figure 3 shows the correlation of industrial production indices of V4 countries to the euro area in the period from 2004 to 2012. All V4 coun-tries show a great convergence during 2009–2012. The recent levels of convergence are at a stable and high level close to the range 0.8–1. Figure 3 indicates a strong inluence of recession and sub-sequent slow recovery of the economies in the last period. The correlation of the Czech Republic and euro area countries average industrial produc-tion was signiicant throughout the whole period with a downward trend in 2005 — mid-2006. Since then the correlation rose signiicantly and after a slight decline in 2008, the correlation increased since 2009 and remains at high levels. In 2008, the Czech Republic was caught-up in terms of busi-ness cycles convergence by Hungary. Slovakia and Poland maintain similar levels of correlation since 2009; however, Slovakia has shown an increasing trend of correlation since 2007, meanwhile, Poland faced a downturn in correlation in 2008. These re-sults are consistent with [25], [15] and [18].1
4. Conclusion
The aim of this paper was to quantify and eval-uate the level of convergence achieved by the group of V4 countries towards the euro area. A low rate of convergence can indicate some challenges in terms of euro adoption, which is conirmed by developments in the euro area countries over the last few years. We adopted a multi-dimensional approach and concurrently examined nominal and real convergence by alternative methods.
We employed three methods to estimate real convergence of the V4 countries. The outputs of
1 On the other hand [9] argue that strong business cycle syn-chronization was found only in the core EU countries.
all estimation unanimously suggest that the con-vergence is an ongoing and continuous process, and the level of real convergence in all countries has been increasing. The respective coeficients in the β-convergence estimations are signiicant in all countries. Based on the σ-convergence con-cept, dispersion of income levels has been reduced over time, although slightly slowing since 2009. Estimations of business cycles synchronization provide mixed results. Whereas the pre-crisis pe-riod is characteristic of a diverging trend in many countries, the recent inancial crisis and following economic recession established a new trend of ris-ing synchronization.
In summary, we revealed robust evidence of continuing convergence in the V4 countries. We also found that the convergence is more percep-tible the in case of Slovakia in terms of β-con-vergence and σ-convergence, according to IP cy-cles synchronization converging faster since join-ing the EU. However, accordjoin-ing to GDP cycles syn-chronization approach, Slovakia is a country with the least synchronized cycle until 2007. On the other hand, business cycles are now more syn-chronized due to external shock in the form of a i-nancial crisis not due to fundamental approxima-tion of the economies. Subsequently, joining the euro area may still cause serious economic prob-lems in the V4 countries with independent mon-etary policy. Based on the results obtained, and convergence trends revealed we could suggest a clear policy implication for the three non-euro V4 countries. Although the level of convergence seems to be suficient, staying outside the euro area and keeping independent monetary policy is desirable. At least until the next growth stage of the economic cycle is over. This time is necessary to prove if the increased convergence obtained in the post-crisis period is not only temporary and spurious episode, but it can also persist in a more standard economic environment.
Research behind this paper was supported by the Student Grant Competition of Silesian University within the project SGS/7/2013 “Efect of exchange rates on companies and economic environment in small open economies.” he support is gratefully acknowledged. We also thank Adrienne Dinneen for comments and suggestions on an earlier version of the paper.
References
1. Albu, L. L. (2012). he convergence process in the EU estimated by Gini coeicients, Romanian Journal of Economic Forecasting 4, 5-16.
2. Artis, M. J., Krolzig, H., & Toro, J. (2002). he European Business Cycle, Economic Working Papers at Centro de Estudios Andaluces, E2002/19.
3. Barro, R. J. & Sala-i-Martin, X. (1991). Convergence Across States and Regions, Brookings Papers on Economic Activity, 22,107-182.
4. Barro, R. J., & Sala-i-Martin, X. (2004). Economic growth, 2nd ed. Boston: MIT Press.
6. Bayoumi, T. & Eichengreen, B. (1997). Ever closer to heaven? An Optimum-Currency-Area Index for European Countries, European Economic Review, 41 , 761-770.
7. Begg, I. (2005). Catch-up, the Transition to Full Participation in EMU and Financial Stability, Paper presented at Research Conference on Financial Stability and the Convergence Process in Europe, Brussels . Available at: http://ec.europa.eu/economy_i-nance/events/2005/bxlforum1005/begg_en.pdf.
8. Bradley, J., Morgenroth, E. & Untiedt, G. (2003). Macro-regional Evaluation of the Structural Funds Using the HERMIN Modelling Framework. Economic and Social Research Institute (ESRI). Working Paper no. 152. Available at: http://www-sre.wu-wien.ac.at/ersa/ersaconfs/ersa03/cdrom/papers/313.pdf.
9. Camacho, M., Perez-Quiros, G. & Saiz, L. (2005). Do European Business Cycles Look Like One? Banco de Espaňa Working Papers, 0518.
10. Canova, F., & Marcet, A. (1995). he Poor Stay Poor: Non-Convergence Across Countries and Regions, CEPR Discussion Papers, 1265.
11. Drastichová, M. (2012). he relations of real and nominal convergence in the EU with impacts on the euro area participa-tion, Central European Review of Economic Issues, 15 , 107-122.
12. de la Fuente (2000). Convergence Across Countries And Regions: heory And Empirics, CEPR Discussion Papers, 2465 . 13. Frait, J., & Komárek, L. (2004). Exchange Rate and Monetary Developments in Accession Countries, in: S. Polouček, (ed.), Reforming the Financial Sector in Central European Countries , Houndmills, Basingstoke: Palgrave Macmillan, 169–210.
14. Frankel, J. A. & Rose, A.K. (1998). he Endogeneity of the Optimum Currency Area Criteria, Economic Journal, 108 , 1009-1025.
15. Fidrmuc, J., & Korhonen, I. (2006). Meta-analysis of business cycle correlation between the euro area and CEEC’s, J Comp Econ, 34, 518-537.
16. Hančlová, J., Kubicová, I., Melecký, A., Melecký, L., Melecký, M., Ramík, J., Nevima J. & Macháček, M. (2010). Makroekonometrické modelování české ekonomiky a vybraných ekonomik EU, Ostrava: VŠB-TU Ostrava, 190-280.
17. Islam, N. (2003). What have we learnt from the convergence debate? Journal of Comparative Economics, 17, 309-362. 18. Jiménez-Rodríguez, R., Morales-Zumaquero, A. & Égert, B. (2013). Business Cycle Synchronization between Euro Area and Central and Eastern European Countries, Review of Development Economics, 17, 379-395.
19. Kowalski, P.A. (2003). Nominal and real convergence in alternative exchange rate regimes in transition countries: Implications for the EMU accession. CASE Network Studies and Analysis , 270, Warsaw: Center for Social and Economic Research.
20. Kaitila, V. (2004). Convergence of Real GDP per capita in the EU15. How do the accession countries it in? ENEPRI Discussion Paper, 25.
21. López-Salido, J.D. & Quirós, G.P. (2006). Real Convergence, Cyclical Synchrony and Inlation Diferentials . he Analysis of the Spanish Economy: Data. Instruments and Procedures, Banco de Espaňa, 409-433. Available at: http://www.bde.es/f/webbde/SES/ Secciones/Publicaciones/OtrasPublicaciones/Fich/analysis_spanish_economy.pdf
22. Masson, P.R. & Taylor, M.P. (1992). Common Currency Areas and Currency Unions: An Analysis of the Issues, CEPR Discussion Papers, 617 .
23. Matkowski, Z. & Próchniak, M. (2004). Real Economic Convergence in the EU Accession Countries. International Journal of Applied Econometrics and Quantitative Studies, 3 , 5-38.
24. Próchniak, M. & Witkowski, B. (2013). Time stability of the beta convergence among EU countries: Bayesian model aver-aging perspective, Economic Model, 30, 322-333.
25. Rozmahel, P. (2011). Real Convergence Trends in CEE Countries: Time varying correlation approach, Acta Academica Karviniensia, 2, 156-164.
26. Sala-i-Martin, X. (1994). Cross-sectional Regressions and the Empirics of Economic Growth. European Economic Review, 38, 739-747.
27. Schadler, S., Drummond, P. Kuijs, L., Murgasova Z. & R. van Elkan (2005). Adopting the Euro in Central Europe. Challenges of the Next Step in European Integration, IMF Occasional Paper, 234 , Washington, DC: International Monetary Fund.
28. Slavík, C. (2007). Real convergence of the Czech Republic to the EU in comparison with the other new member countries , Politická ekonomie, 54, 23-40.
29. Spěváček, V. & Vintrová, R. (2010). Růst, stabilita a konvergence české ekonomiky letech 2001-2008, Politická ekonomie, 58, 20-47.
30. Varblane, U. & Vahter, P. (2005). An Analysis of the Economic Convergence Process in the Transition Countries, University of Tartu — Faculty of Economics and Business Administration, Working Paper Series, 37.
31. Vojinović, B., Acharya, S. & Próchniak, M. (2009). Convergence analysis among the ten European transition econo-mies, Hitotsubashi Journal of Economics, 50, 123-141.
32. Žďárek, V. & Šindel, J. (2007). Real and Nominal Convergence and the New EU Member States –Actual State and Implication, Prague Economic Paper, 3, 197–215.
Information about the authors
Stavárek Daniel (Karvina, Czech Republic) — PhD, Professor, Department of Finance, School of Business Administration in Karviná, Silesian University in Opava (Univerzitní nám. 1934/3, 733 40 Karviná, Czech Republic, e-mail: [email protected]).