PONTIFÍCIA UNIVERSIDADE CATÓLICA DO RIO GRANDE DO SUL PRÓ-REITORIA DE PESQUISA E PÓS-GRADUAÇÃO
FACULDADE DE MEDICINA
PROGRAMA DE PÓS-GRADUAÇÃO EM MEDICINA E CIÊNCIAS DA SAÚDE ÁREA DE CONCENTRAÇÃO: CLÍNICA CIRÚRGICA
ESTUDO EXPERIMENTAL PARA AVALIAÇÃO DA RESISTÊNCIA À COMPRESSÃO ENTRE DOIS MODELOS DE FIXAÇÃO DA OSTEOTOMIA EM “L” DO FÊMUR
PROXIMAL
LUCIANO URNAUER
LUCIANO URNAUER
Estudo experimental para avaliação da resistência à compressão entre dois modelos de fixação da osteotomia em “L” do fêmur proximal
ORIENTADOR
Prof. Dr. GUSTAVO FRANCO CARVALHAL
Porto Alegre 2013
DADOS DE CATALOGAÇÃO
Isabel Merlo Crespo
Bibliotecária CRB 10/1201 U77e Urnauer, Luciano
Estudo experimental para avaliação da resistência à compressão e tre dois odelos de fixação da osteoto ia e L do fê ur proxi al / Luciano Urnauer. Porto Alegre: PUCRS, 2013.
45 f.: il.; tab. Inclui artigo científico encaminhado para publicação. Orientador: Prof. Dr. Gustavo Franco Carvalhal.
Dissertação (Mestrado) – Pontifícia Universidade Católica do Rio Grande do Sul. Faculdade de Medicina. Pós-Graduação em Medicina e Ciências da Saúde. Área de concentração: Clínica Cirúrgica.
1. FÊMUR. . O“TEOTOMIA. . O“TEOTOMIA EM L . . COXA BREVIS. 5. DOENÇA DE LEGG-CALVÉ-PERTHES. 6. BIOMECÂNICA DO QUADRIL. 7. CIRURGIA. 8. ENSAIO MECANICO IN VITRO. I. Carvalhal, Gustavo Franco. II. Título. CDD617.58
RESUMO
Introdução: Coxa brevis é uma deformidade do fêmur proximal causada pela diminuição ou ausência de crescimento da fise da extremidade proximal do fêmur, geralmente causada por necrose avascular condição presente nas patologias como displasia do desenvolvimento do quadril, epifisiólise femoral proximal, artrite séptica ou doença de Legg-Calvé-Perthes. Diversas cirurgias tem sido propostas para rebaixar o grande trocânter ou alongar o colo femoral reestabelecendo a anatomia.
Objetivo: comparar através de testes mecânicos em modelos ósseos de poliuretano a resistência à compressão entre duas montagens diferentes de placas para fixação osteotomia em “L” do fêmur proximal.
Material e Métodos: Foram utilizados modelos anatômicos de fêmur proximal em poliuretano no qual foi realizado uma osteotomia longitudinal e divididos em dois grupos sendo um grupo fixado com placa 4,5 DCP 10 furos com quatro parafusos proximais e três parafusos distais e um grupo fixado com placa 4,5 DCP 6 furos com dois parafusos proximais e dois distais. O modelos anatômicos foram submetidos a teste de flexocompressão em máquina universal de ensaios mecânicos e foi avaliado a rigidez relativa e o deslocamento linear.
Resultados: Ao comparar os dois grupos nos ensaios de flexocompressão, o valor médio da rigidez relativa no grupo 1 fixado com a placa longa foi de 386,17 x10⁻³ N/m. No grupo fixado com a placa menor o valor médio da rigidez relativa foi de 261,89 x10 -3 N/m. O valor médio do deslocamento linear, observado para uma força aplicada de 1000 N, no grupo 1 foi de 2,53 x10⁻³. No grupo 2 o valor médio do deslocamento linear foi de 3,49 x10⁻³m.
ABSTRACT
Introduction: Coxa brevis is a deformity of the proximal femur caused by a decrease or absence of growth of the physis of the proximal femur, usually caused by avascular
necrosis present condition in conditions such as developmental dysplasia of the hip,
proximal femoral epiphysiolysis, septic arthritis or disease Legg-Calvé-Perthes
disease. Several surgeries have been proposed to lower the greater trochanter and
femoral neck lengthening reestablishing the anatomy.
Objective: To compare the mechanical tests by polyurethane in bone models the compressive strength of two different assemblies of plates for fixing osteotomy "L" of
the proximal femur.
Material and Methods: We used anatomical models of the proximal femur polyurethane which underwent an osteotomy longitudinal and divided into two groups
with one group fixed with 4.5 DCP plate 10 holes with four screws proximal and three
distal screws and fixed with a group 4.5 DCP plate 6 holes with two proximal and two
distal screws. The anatomical models were tested for flexo in mechanical universal
testing machine and was evaluated relative stiffness and linear movement.
Results: By comparing the two groups in flexo tests, the average value of the relative stiffness in group 1 set with the long plate was 386.17 x10⁻³ N / m. In the group with
the smaller plate fixed average value of the relative stiffness was 261,89 x10⁻³ N / m.
The average linear displacement observed for an applied force of 1000 N in group 1
Conclusion: Based on the parameters measured in the tests flexo, stability obtained by fixing the first group with a plate of ten holes was significantly higher than that
obtained by fixing the second group with six holes of the plate.
LISTA DE FIGURAS
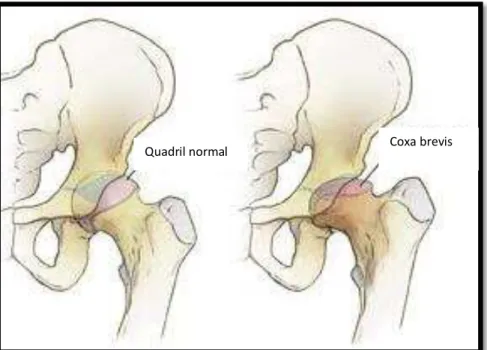
Figura 1- representação anatômica de um quadril normal e de um quadril com coxa brevis...12
Figura 2 - Técnica cirúrgica descrita por Papavasiliou et al...13
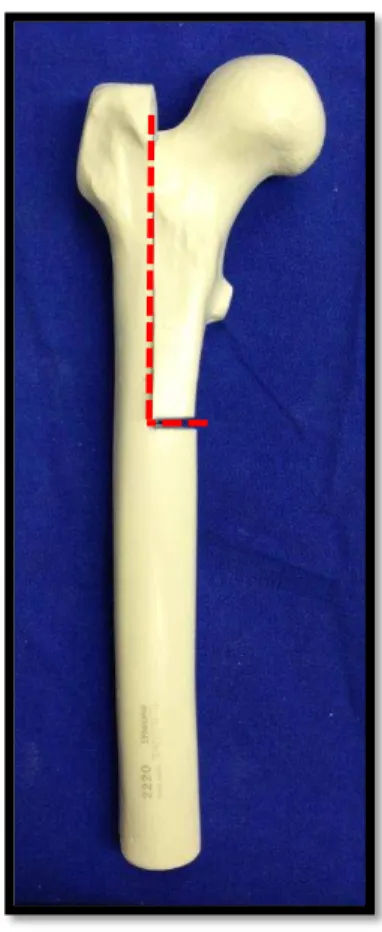
Figura 3- desenho mostrando tamanho da osteotomia e quantidade da parafusos proposto por Ching-Lung Tai et al 11 através de análise de elementos finitos e cálculos
matemáticos...14
Figura 4- Modelo artificial de fêmur marca Synbone® com marcação para a
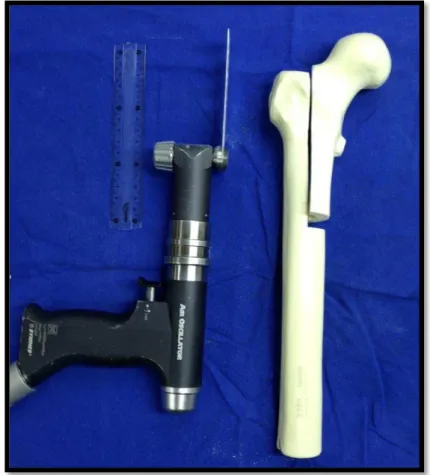
osteotomia em “L” ...17 Figura 5- serra oscilante para realização da osteotomia...18 Figura 6- instrumental para fixação dos implantes após a realização da
osteotomia...19
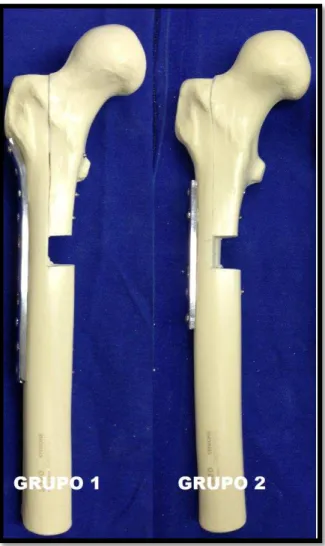
Figura 7 – modelos ósseos do fêmur proximal após a realização da osteotomia em ”L” divididos em dois grupos de acordo com a fixação...20
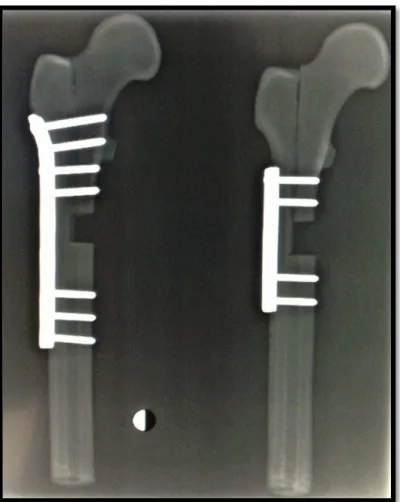
Figura 8 – Rx dos modelos ósseos após a osteotomia e fixados com placa do Grupo 1 e Grupo 2...21
Figura 9- Representação gráfica dos valores de rigidez relativa...26
LISTA DE TABELAS
Tabela 1 – Tabela descritiva dos dados da variável rigidez relativa encontrados nos ensaios entre o grupo 1 e o grupo 2...25
LISTA DE SIGLAS E SIMBOLOS
/ Por
> Maior
= Igual < Menor
± Mais ou menos § Parágrafo
® Marca registrada cm centímetros DP Desvio padrão et al E demais g Gramas h Hora Kg Kilograma min Minuto
ref. referência
IC 95 intervalo de confiança de 95% LI limite inferior
LS limite superior
OMS Organização Mundial da Saúde
mm/s milímetro por segundo N Newton
m metro
SUMÁRIO
1 INTRODUÇÃO ... 12
1.1Objetivo ... 17
2. MATERIAL E MÉTODOS ... 18
2.1 Modelos Ósseos...18
2.2 Procedimento Cirúrgico...19
2.3 Método de Fixação...20
2.4 Ensaios Mecânicos...22
3. ANALISE ESTATISTICA...25
4. RESULTADOS ... 26
4.1 Ensaios de flexocompressão ... 27
5. DISCUSSÃO ... 31
6. CONCLUSÕES ... 32
REFERÊNCIAS ...33
ANEXO A: Aprovação do Comissão Científica ...36
INTRODUÇÃO
A articulação do quadril é muito importante na manutenção da postura do
indivíduo e para sua locomoção. A articulação é formada pela porção proximal do
fêmur - cabeça femoral e grande trocânter e pelo acetábulo e qualquer alteração na
anatomia desses ossos repercute em forças mecânicas anormais na articulação13.
Coxa brevis é uma deformidade do fêmur proximal causada pela diminuição ou
ausência de crescimento da fise (placa de crescimento) da extremidade proximal do
fêmur, geralmente causada por necrose avascular 1,2 condição presente nas
patologias como displasia do desenvolvimento do quadril, epifisiólise femoral proximal,
artrite séptica ou doença de Legg-Calvé-Perthes.
Uma vez em que o colo femoral curto e a posição elevada do ápice do grande
trocânter (figura 1) são as principais características dessa condição 3,4,5, causando um
desequilíbrio na biomecânica do quadril e como consequências da coxa brevis
podemos citar o encurtamento do membro inferior afetado, fraqueza da musculatura
abdutora (glúteo médio e mínimo) e como sintomatologia clínica teremos a marcha de
Figura 1- representação anatômica de um quadril normal e de um quadril com coxa brevis.
Diversas técnicas têm sido propostas para o tratamento da coxa brevis como a
epifisiodese do grande trocânter, osteotomia com rebaixamento e lateralização do
grande trocânter.8,9 No entanto, todas as técnicas, visando corrigir apenas a falta de
tensão da musculatura abdutora.
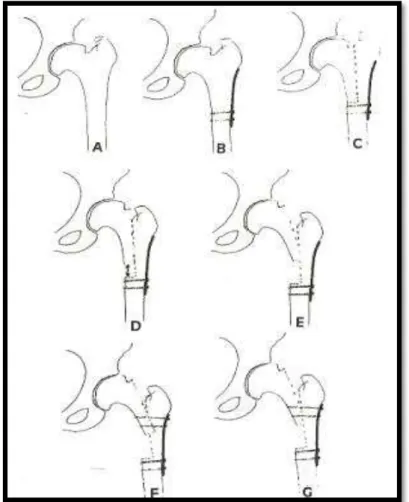
Papavasiliou et al 10publicaram em 1997 uma técnica de osteotomia do fêmur
proximal que corrigia simultaneamente a falta de tensão da musculatura abdutora,
corrigia o encurtamento e melhorava a congruência articular (figura 2). Entretanto o
método de fixação da osteotomia consistia no uso de uma placa metálica de
osteossíntese fixada com dois parafusos proximais e dois parafusos distais.
Entretanto tal fixação não possuía grande estabilidade, necessitando de
aparelho gessado adicionalmente por seis semanas até a consolidação da
osteotomia.
Figura 2 - Técnica cirúrgica descrita por Papavasiliou et al 10: a) coxa brevis; b) fixação da placa com dois parafusos distais; c) osteotomia longitudinal fêmur proximal; d-e)
Em 2009 Ching-Lung Tai et al 11, publicaram um estudo em que através da
análise de elementos finitos e com fórmulas matemáticas, constataram que
aumentando o número de parafusos na fixação da porção proximal da osteotomia e
limitando a extensão da osteotomia levaria a um aumento da estabilidade durante o
período pós-operatório (figura 3).
Figura 3- desenho mostrando o comprimento da osteotomia e quantidade de parafusos proposto por Ching-Lung Tai et al 11 através de análise de elementos finitos e cálculos matemáticos.
Em grande parte, o sucesso dos procedimentos múltiplos que envolvem
cirurgias ósseas depende da obtenção de fixação rígida dos segmentos
osteotomizados, o que possibilita movimentação e descarga de peso precoces 20.
Nossa hipótese é que se utilizarmos uma placa mais longa e aumentando a
quantidade de parafusos proximais e distais, estaremos aumentando a estabilidade
após a cirurgia. O objetivo desse estudo é comparar através de testes mecânicos em
modelos ósseos de poliuretano a resistência à compressão de duas montagens
OBJETIVOS
Comparar, através de testes mecânicos em modelos ósseos sintéticos, a
resistência à compressão entre a montagem para fixação da osteotomia em “L” do fêmur proximal com uma placa de seis furos fixada com dois parafusos proximais e
dois distais e outra fixação com uma placa de dez furos fixada com quatro parafusos
MATERIAIS E MÉTODOS
Modelos Ósseos
Foram utilizados modelos anatômicos de fêmur proximal em poliuretano tipo
2220 –Synbone, Malans-Swiss. Escolhemos usar osso sintético (Synbone) em nosso estudo ao invés de osso de cadáver, pois com o osso sintético poderemos ter certeza
de que estaremos trabalhando com amostras uniformes em relação à consistência,
geometria e propriedades mecânicas12 e constando em vários trabalhos na
literatura14, 15, 16.
Procedimento Cirúrgico
Foi realizado uma osteotomia no plano sagital desde a fossa trocantérica e na
linha média da face anterior do fêmur em direção distal até 126mm no eixo longitudinal
do fêmur utilizando uma serra oscilante Powerdrive – Synthes. Foi realizado deslizamento do fragmento proximal em 20 mm cranialmente.
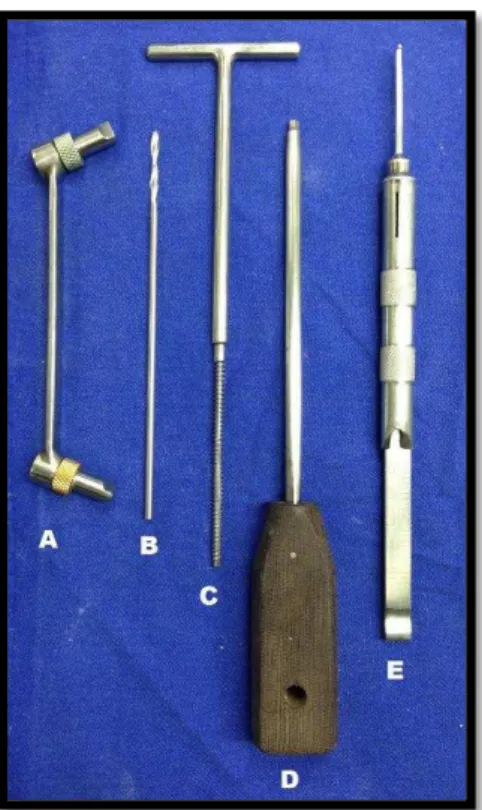
Figura 6- instrumental para fixação dos implantes após a realização da osteotomia. (A- guia DCP para broca; B- broca 3,2mm; C- trifina; D- chave sextavada; E –
medidor para parafusos).
Método de Fixação
Foram formados dois grupos, cada um com 15 (quinze) unidades de osso
sintetico: um grupo fixado com placa de compressão dinâmica (DCP) 4,5 mm de dez
furos e com quatro parafusos proximais e três parafusos distais denominado GRUPO
1, fixados através da perfuração com broca 3,2 mm e parafusos 4,5 mm com comprimento suficiente para alcançar a cortical lateral e medial e outro grupo fixado
GRUPO 2, fixados através da perfuração com broca 3,2 mm e parafusos 4,5 mm com comprimento suficiente para alcançar a cortical lateral e medial.
Figura 8 – Rx dos modelos ósseos após a osteotomia e fixados com placa do Grupo 1 e Grupo 2.
Ensaios mecânicos
Para a realização dos ensaios mecânicos de compressão foi utilizada a
máquina universal de ensaios mecânicos do LABELO - Laboratórios Especializados
em Eletro-Eletrônica, Calibração e Ensaios – PUCRS.
Os modelos foram submetidos a teste de compressão na máquina universal de
de carga de 200 kgf. Foi utilizado o software Tesc versão 3.04 para a programação
dos parâmetros estipulados para o ensaio.
Suportes metálicos foram confeccionados para a perfeita adaptação das peças
à máquina de ensaios durante a aplicação das cargas. As peças foram posicionadas
com adução de 11º no plano frontal, para simular a inclinação do eixo mecânico do
fêmur na posição ortostática21. Após o posicionamento adequado, as peças foram
submetidas a cargas que aumentadas progressivamente com velocidade de 01
milímetro por segundo (mm/seg), mensuradas por meio de gráficos analógicos
medidos em quilograma-força (kgf), até o ponto de falha mecânica, que foi definida
como uma alteração da forma no gráfico de força versus falha mecânica. As falhas
observadas durante os ensaios ocorridas no osso (fratura) ou nos parafusos proximais
das placas (soltura) e serão devidamente anotadas e analisadas estatisticamente.
A força foi aplicada verticalmente na porção superior das cabeças femorais dos
conjuntos através de um dispositivo metálico em forma de cúpula acoplado à célula
de carga, com o intuito de promover uma distribuição mais homogênea da carga.
A máquina universal de ensaios foi programada com os seguintes comandos:
1. Descer com velocidade constante de 0,1 mm/s até atingir a força de 30 N, estipulada
2. Zerar o deslocamento registrado e reiniciar a descida com a velocidade constante
de 0,1 mm/s até o limite máximo de força de 1000 N ou deslocamento linear máximo
de 10,0 mm, quando o experimento foi dado por encerrado.
Os parâmetros utilizados nos ensaios de compressão para comparação entre
as duas montagens foram rigidez relativa encontrada até a aplicação da força de 1000
N e o deslocamento linear acusado nesta situação.
ANÁLISE ESTATÍSTICA
As variáveis foram descritas por média, desvio padrão, mediana e amplitude de
variação e foram comparadas entre os grupos pelo teste t-student para amostras
independentes. Para estimar a magnitude do efeito na população, o intervalo de 95%
de confiança foi calculado.
O nível de significância estatística foi de 5% (p0,05) e as análises foram
RESULTADOS
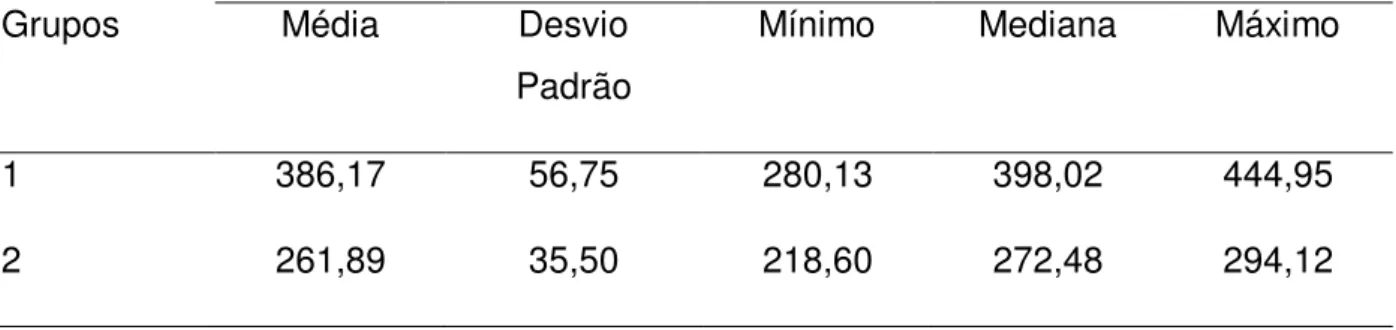
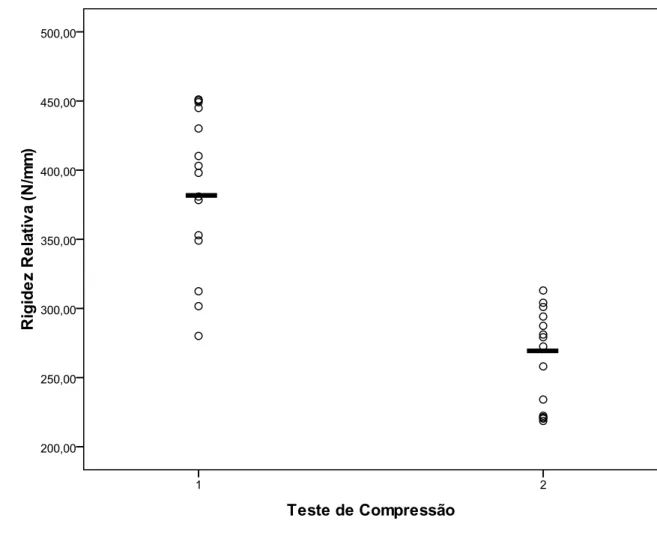
Nos ensaios de flexocompressão, o valor médio da rigidez relativa no grupo 1
fixado com a placa longa foi de 386,17 x10⁻³ N/m. No grupo fixado com a placa menor
o valor médio da rigidez relativa foi de 261,89 x10⁻³ N/m. A média, desvio padrão,
valor mínimo, mediana e valor máximo da rigidez relativa estão mostrados na tabela
1. Os dados relativos à rigidez relativa encontrados nos ensaios de flexocompressão
estão representados na figura 8.
Rigidez relativa (x103 N/m)
Grupos Média Desvio
Padrão
Mínimo Mediana Máximo
1 386,17 56,75 280,13 398,02 444,95
2 261,89 35,50 218,60 272,48 294,12
Figura 9- Representação gráfica dos valores de rigidez relativa encontrados nos ensaios de flexocompressão segundo o tipo de fixação dos grupos 1 e 2. Os valores
estão representados por círculos e as médias estão representadas por traços
O valor médio do deslocamento linear, observado para uma força aplicada de
1000 N, no grupo 1 foi de 2,53 x10⁻³. No grupo 2 o valor médio do deslocamento linear
foi de 3,49 x10⁻³m. A média, desvio padrão, valor mínimo, mediana e valor máximo do
deslocamento linear estão mostrados na tabela 2. Os dados relativos ao
deslocamento linear encontrados nos ensaios de flexocompressão estão
representados na figura 10.
Deslocamento Linear (mm)
Grupos Média Desvio
Padrão
Mínimo Mediana Máximo
1 2,53 0,49 2,03 2,36 2,70
2 3,49 0,42 2,83 3,46 3,80
Figura 10 - O valor médio do deslocamento linear, observado para uma força aplicada de 1000 N, no grupo 1 foi de 2,53 x10⁻³. No grupo 2 o valor médio do deslocamento
linear foi de 3,49 x10⁻³m.
Houve diferença estatística significativa (p<0,001) entre o grupo 1 e o grupo 2
fixado com placa onze furos e seis furos respectivamente, em relação aos parâmetros
Medida Grupo Média Diferença média
IC 95%
LI LS p-valor
Rigidez Relativa 1 386,17 124,3 88,9 159,7 <0,001
2 261,89
Deslocamento linear
1 2,53 -0,97 -1,31 -0,63 <0,001
2 3,49
IC 95%=intervalo com 95% de confiança; LI=Limite inferior; LS=Limite superior
Tabela 3 – tabela descritiva intervalo de confiança.
Com base nos parâmetros analisados nos ensaios de flexocompressão, a
estabilidade obtida pela fixação do grupo 1 com placa de dez furos foi
DISCUSSÃO
Um modelo sintético de osso foi escolhido devido à dificuldade para obtenção
de amostras de ossos humanos. Estes modelos têm sido empregados em estudos
biomecânicos de implantes devido à consistência entre as amostras e sua mínima
variabilidade de tamanho e propriedades físicas. 14,15,16
A utilização de ensaios mecânicos permite quantificar as diferenças entre as
montagens de maneira a reproduzir situações de carga. Os parâmetros estabelecidos
para a realização dos ensaios mecânicos de flexocompressão tiveram base nas
estimativas das forças que atuam no plano frontal na fase de apoio monopodal.
Estudos indicam que a força de reação que atua sobre a cabeça femoral pode
corresponder a valores de 3,08 vezes o peso corporal 17. Em um cálculo simplificado
poderíamos estimar que uma criança de 10 anos, cujo peso está em torno de 31 a 32
kg segundo as curvas de crescimento da OMS 18, resultaria em uma força entre 955
e 985 N. Portanto, utilizar um valor de 1000N para a carga máxima nos ensaios de
flexocompressão pareceu-nos razoável como estimativa das forças em uma situação
de apoio monopodal.
Quando os conjuntos modelo ósseo e haste e modelo ósseo e placa foram
submetidos aos ensaios mecânicos que utilizaram os parâmetros acima descritos,
foram encontrados resultados de rigidez relativa significativamente maiores nas
montagens que utilizaram placas, tanto para os testes de flexocompressão, quanto
CONCLUSÃO
REFERENCIAS BIBLIOGÁFICAS
1. EILERT RE, HILL K, BACH J. Greater trochanteric transfer for the treatment of coxa brevis. Clin Orthop Relat Res. 2005;434:92–101.
2. STEVENS PM, COLEMAN SS. Coxa breva: its pathogenesis and a rationale for its management. J Pediatr Orthop. 1985;5:515–521.
3. FERNBACH SK, POZNANSKI AK, KELIKIAN AS, TACHJDIAN MO, MARZANO MJ. Greater trochanteric overgrowth: development and surgical correction. Radiology. 1985;154:661–664.
4. JOO SY, LEE KS, KOH IH, PARK HW, KIM HW. Trochanteric advancement in patients with Legg-Calve´-Perthes disease does not improve pain or limp. Clin Orthop Relat Res. 2008;466: 927–934.
5. SCHNEIDMUELLER D, CARSTENS C, THOMSEN M. Surgical treatment of overgrowth of the greater trochanter in children and adolescents. J Pediatr Orthop. 2006;26:486–490.
6. PAUWELS F. Osteoarthritis. In: Biomechanics of the Normal and Diseased Hip: Theoretical Foundation, Technique and Results of Treatment: An Atlas. New York, NY: Springer; 1976:129–271.
7. HARDCASTLE P, NADE S. The significance of the Trendelenburg test. J Bone Joint Surg Br. 1985;67:741–746.
9. SCHNEIDMUELLER D, CARSTENS C, THOMSEN M. Surgical treatment of overgrowth of the greater trochanter in children and adolescents. J Pediatr Orthop. 2006;26:486–490
10. PAPAVASILIOU VA, KIRKOS JM: Reconstruction of residual deformities of the hip. Clin Orthop 1997, 341:123-127.
11. CHING-LUNG TAI, WENG-PIN CHEN, HSIH-HAO CHEN, CHIEN-YU LIN AND MEL S LEE. Biomechanical optimization of different fixation modes for a proximal femoral L-osteotomy. BMC Musculoskeletal Disorders 2009, 10:112
12. ALI AM, SALEH M, BOLONGARO S, YANG L. Experimental model of tibial plateau fracture for biomechanical testing. J Biomech 2006;39(7):1355–60.
13. DELP SL, MALONEY W, Effects of hip center location on the moment-generation capacity of the muscles. J. Biomech 1993, 26(4-5):485-499.
14. FRICKA, K. B.; MAHAR, A. T.; LEE, S. S.; NEWTON, P. O. Biomechanical analysis of antegrade and retrograde flexible intramedullary nail fixation of pediatric femoral fractures using a synthetic bone model. J. Pediatr. Orthop. New York, v. 24, n. 2, p.167-171, 2004.
15. GREEN, J. K.; WERNER, F. W.; DHAWAN, R.; EVANS, P. J.; KELLEY, S.; WEBSTER, D. A. A biomechanical study on flexible intramedullary nails used to treat pediatric femoral fractures. J. Orthop. Res., New York, v. 23, n. 6, p. 1315-1320, 2005.
16. LEE, S. S.; MAHAR, A. T.; NEWTON, P. O. Ender nail fixation of pediatric fêmur fractures: A biomechanical analysis. J. Pediatr. Orthop., New York, v. 21, n. 4, p. 442-445, 2001.
Congenital dysplasia and discolocation of the hip. Berlin: Springer, 1987. p. 26-57.
18. BRASIL. Ministério da Saúde. Curvas de crescimento da Organização Mundial de Saúde. 2007. Disponível em: <http://nutricao.saude.gov.br/sisvan.php?conteudo= curvas_cresc_oms>. Acesso em: 10 abr. 2010.
19. SCHALL, R. Estimation in generalized linear models with random effects. Biometrika, Oxford, v. 78, n. 4, p. 719-727, 1991.
20. NOVACHECK, T. F. Displegia and quadriplegia: pathology and treatment. In: GAGE, J. R. (Ed.). The treatment of gait problems in cerebral palsy. London: Mac Keith Press, 2004. p. 345-381.
21. CRISTOFOLINI, L.; VICECONTI, M.; CAPPELLO, A.; TONI, A. Mechanical
Experimental study to evaluate the resistance to compression of two models for setting the osteotomy “L” of the proximal fêmur.
Urnauer, L.1 ; Carvalhal, G.F.2
1 Service of Orthopaedic and Traumatology , São Lucas Hospital, Pontifical Catholic University of Rio Grande do Sul - PUCRS, Brazil.
2 Service of Surgery and Urology, São Lucas Hospital, Pontifical Catholic University of Rio Grande do Sul - PUCRS, Brazil.
* Author correspondence. Av. Ipiranga 6690, conj 806 ZIP Code: 90610000.Phone: (5551) 98089391 and (5551) 33367734
* E-mail address: urnauer@gmail.com (Luciano Urnauer)
ABSTRACT
Introduction: Coxa brevis is a deformity of the proximal femur caused by a decrease or absence of growth of the physis of the proximal femur, usually caused by avascular
necrosis present condition in conditions such as developmental dysplasia of the hip,
proximal femoral epiphysiolysis, septic arthritis or disease Legg-Calvé-Perthes
disease. Several surgeries have been proposed to lower the greater trochanter and
femoral neck lengthening reestablishing the anatomy.
Objective: To compare the mechanical tests by polyurethane in bone models the compressive strength of two different assemblies of plates for fixing osteotomy "L" of
the proximal femur.
Material and Methods: We used anatomical models of the proximal femur polyurethane which underwent an osteotomy longitudinal and divided into two groups
distal screws and fixed with a group 4.5 DCP plate 6 holes with two proximal and two
distal screws. The anatomical models were tested for flexo in mechanical universal
testing machine and was evaluated relative stiffness and linear movement.
Results: By comparing the two groups in flexo tests, the average value of the relative stiffness in group 1 set with the long plate was 386.17 x10⁻³ N / m. In the group with
the smaller plate fixed average value of the relative stiffness was 261,89 x10⁻³ N / m.
The average linear displacement observed for an applied force of 1000 N in group 1
was 2.53 x10⁻³. In group 2, the mean value of linear displacement was 3.49 x 10⁻³m.
Conclusion: Based on the parameters measured in the tests flexo, stability obtained by fixing the first group with a plate of ten holes was significantly higher than that
obtained by fixing the second group with six holes of the plate.
Keywords: femur; osteotomy, osteotomy "L"; coxa brevis; Legg-Calvé-Perthes disease, hip biomechanics, surgery.
INTRODUCTION
The hip joint is very important in maintaining the posture of the individual and to
and femoral head and the acetabulum and any changes in the anatomy of these bones
has in abnormal mechanical forces in13 joint.
Thigh brevis is a deformity of the proximal femur caused by the reduction or
absence of Physeal growth (growth plate) of the proximal end of the femur, usually
caused by 1.2 condition avascular necrosis in diseases such as developmental
Dysplasia of the hip, femoral proximal epiphysiolysis, septic arthritis or
Legg-Calvé-Perthes.
A time in which the femoral neck short and high position of great trochanter
(Figure 1) are the main features of this condition 3, 4, 5, causing an imbalance in the
Biomechanics of the hip and thigh brevis consequences as we mention the affected
lower limb shortening, weakness of the abductor muscles (gluteus medius and
Figure 1 -anatomical representation of a normal hip and hip with thigh brevis.
Several techniques have been proposed for the treatment of thigh brevis as the
great trochanter epiphysiodesis, osteotomy with relegation and lateralization of the
great trochanter.8.9however, all techniques to fix just the abductor muscle power failure.
Papavasiliou et al 10 published in 1997 a proximal femur osteotomy technique
that simultaneously addressed the abductor muscle power failure, rectify the
shortening and improved joint congruity (Figure 2). However the osteotomy fixation
method consisted in the use of a metal plate secured with two screws osteosynthesis
of proximal and two distal screws.
However such non-possessed great stability, requiring casting Additionally for
six weeks until the consolidation of the osteotomy.
Figure 2 - Surgical technique described by Papavasiliou et al 10: a) thigh brevis; b) plate fixation with two distal screws; c) longitudinal proximal femur osteotomy; d-e)
sliding femoral osteotomy;f-g) with two screws proximal.
In 2009 Ching-Lung Tai et al 11, published a study in which through finite element
fixation of proximal osteotomy and limiting the extent of the osteotomy increased
stability during the postoperative period (Figure 3).
Figure 3 -drawing showing the length of osteotomy and screw quantity proposed by Ching-Lung Tai et al 11 through finite element analysis and mathematical calculations.
In large part, the success of multiple procedures involving bone surgery
depends on the production of rigid fixation of the osteotomizados segments, allowing
for handling and disposal of early weight 20.
Our hypothesis is that if we use a longer Board and increasing the amount of
proximal and distal screws, we will be increasing the stability of the osteotomy fixation,
through mechanical tests on bone polyurethane models compressive strength of two
different mounts mounting plate "L" osteotomy of proximal femur.
GOALS
Compare, through mechanical tests on synthetic bone models, compressive
strength between for bracketing of "L" osteotomy of proximal femur with a six-hole plate
fixed with two screws proximal and two distal and another fixation with a plate of ten
holes fixed with four screws proximal and distal three.
MATERIALS AND METHODS
Bone Models
Anatomical models were used of proximal femur in 2220-type polyurethane
Synbone, Malans-Swiss. We chose to use synthetic bone (Synbone) in our study
instead of cadaver bone, because with the synthetic bone we can be sure that we will
be working with uniform samples in relation to consistency, geometry and mechanical
properties12 and consisting in several papers in the literature14, 15, 16.
Surgical Procedure
Was an osteotomy in the sagittal plane since the trochanteric fossa and the
anterior midline of the femur distal direction up to 126 mm in the longitudinal axis of
the femur using an oscillating saw Powerdrive-Synthes. Proximal fragment slip was
performed in 20 mm cranially.
Figure 6 -for attachment of the implants after the completion of the osteotomy. (The DCP Guide to drill; B-drill 3 mm; C-trifina; D-hex wrench; And-meter for screws).
Fixing method
Two groups were formed, each with 15 (fifteen) bone sintetico units: a group
fixed with dynamic compression plate (DCP) 4.5 mm of ten holes and with four screws
proximal and distal screws three called GROUP 1, fixed by drilling with drill 3.2 mm and 4.5 mm screws with sufficient length to reach the lateral and medial cortex and
another group set with DCP plate with six holes and screws proximal and two distal
named GROUP 2, fixed by drilling with drill 3.2 mm and 4.5 mm screws with sufficient
Figure 8 -Rx bone models after the osteotomy and fixed with 1 Group Board
and Group 2.
Mechanical tests
For the realization of the mechanical tests of compression was used the
universal mechanical tests of LABELLUM-specialized laboratories in
The models were subjected to compression test on a universal mechanical tests
EMIC-DL 10000, coupled to a microcomputer and a load cell of 200 kgf. We used
the Tesc softwareversion 3.04 for programming of the parameters set for the test.
Metal stands were made for the perfect adaptation of the test machine parts
during the application of loads. The pieces were positioned with adduction of the 11th
front plane, to simulate the femur mechanical axis tilt in orthostatic position21. After
proper placement, the specimens were subjected to loads which increased
progressively with 01 mm per second speed (mm/sec), measured by means of analog
graphics measured in kilogram-force (kgf), to the point of mechanical failure, which
was defined as a shape on the graph of force versus mechanical failure. The failings
observed during tests that occurred in the bone (fracture) or proximal plate screws
(release) and will be duly noted and analyzed statistically.
The force was applied vertically on the upper portion of the femoral heads
through a dome-shaped metal device attached to the load cell, in order to promote a
more homogeneous distribution of the load.
The universal testing machine was programmed with the following commands:
1. Down with constant speed of 0.1 mm/s until the force of 30 N, stipulated as preload
2. Reset the offset registered and restart the descent with the constant speed of 0.1
mm/s until the maximum force of 1000 N or linear displacement up to 10.0 mm, when
the experiment was given by.
The parameters used in the compression test for comparison between the two
assemblies were relative rigidity found in up to 1000 N force application and the linear
displacement accused in this situation.
The tests were carried out at room temperature
STATISTICAL ANALYSIS
The variables were described by mean, standard deviation, median and range
of variation and were compared between groups by t-student test for independent
samples. To estimate the magnitude of the effect on the population, the 95%
confidence interval was calculated.
The statistical significance level was 5% (p0.05) and the analyses were
RESULTS
In flexo-compression tests, the average value of relative rigidity in Group 1 set
with long Board was 386.17-3 x 10 N/m. The Group fixed with the plate lower average
value of relative stiffness was 261.89-3 x 10 N/m. The mean, standard deviation,
minimum, median and maximum value of the relative rigidity are shown in table 1. The
relative stiffness data found in flexo-compression test are represented in Figure 8.
Relative rigidity (x 103 N/m)
Groups Average Standard
Deviation
Minimum Median Maximum
1 386.17 56.75 280.13 398.02 444.95
2 261.89 35.50 218.60 272.48 294.12
Table 1 -Descriptive Table of variable stiffness on data found in the tests between the Group 1 and group 2.
Figure 9 -Graphical representation of the relative stiffness values found in
flexo-compression tests according to the type of groups 1 and 2. Values are represented
The average value of the linear displacement, noted for a force 1000 N, applied
in Group 1 was 2.53 x 10⁻³. In Group 2 the average value of the linear displacement
was 3.49 x 10⁻³m. The mean, standard deviation, minimum, median and maximum
value of the linear displacement are shown in table 2. Linear displacement data found
in flexo-compression test are represented in Figure 10.
Linear displacement (mm)
Groups Average Standard
Deviation
Minimum Median Maximum
1 2.53 0.49 2.03 2.36 2.70
2 3.49 0.42 2.83 3.46 3.80
Table 2 -Descriptive variable data Table linear displacement
Figure 10 -The average value of the linear displacement, noted for a force 1000 N, applied in Group 1 was 2.53 x 10⁻³. In Group 2 the average value of the linear
displacement was 3.49 x 10⁻³m.
There was a statistically significant difference (p < 0.001) between group 1 and
group 2 set with eleven holes and six holes respectively, in relation to the relative
rigidity and linear displacement parameters for flexocompresão (table 3).
Measure Group Average Average
difference
IC 95%
LI LS p-value
Relative Stiffness 1 386.17 124.3 88.9 159.7 < 0.001
2 261.89
Linear
displacement
1 2.53 -0.97 -1.31 -0.63 < 0.001
2 3.49
IC 95% = range with 95% confidence; LI = lower bound; LS = upper limit
Table 3- descriptive confidence interval table.
On the basis of the parameters analyzed for flexo-compression, stability
obtained by fixing the Group 1 with ten holes was significantly greater than the obtained
DISCUSSION
A synthetic model of bone was chosen due to the difficulty to obtain samples of
human bones. These models have been used in biomechanical studies of implants
due to the consistency between the samples and minimum size variability and its
physical properties. 14, 15.16
The use of mechanical tests allows to quantify the differences between the
mounts to make load situations. The parameters established for flexo-compression
mechanical essays were the basis of the estimates of the forces acting in the frontal
stance phase with Mono.
Studies indicate that the reaction force that acts on the femoral head may
correspond to values of 3.08 times the body weight 17. In a simplified calculation could
estimate that a 10-year-old child, whose weight is around 31 to 32 kg according to the
growth curves of 18who, would result in a force between 955 and 985 N. Therefore, use
a value of 1000N for the maximum load in flexo-compression test seemed reasonable
When the bone model sets and stem and bone and plate model were subjected
to mechanical tests that used the parameters described above, were found on
significantly higher stiffness results in mounts that used plates, both for the
flexo-compression, and torsion tests.
CONCLUSION
On the basis of the parameters analyzed for flexo-compression, stability
obtained by fixing the Group 1 with ten holes and four screws proximal and distal three
was significantly greater than the obtained by fixing in Group 2 with six holes and
screws proximal and two distal.
REFERENCES BIBLIOGÁFICAS
1.
EASTON, HILL K, BACH J
. Greater trochanteric transfer for the
treatment of thigh brevis
. Clin Orthop Reports Res. 2005; 434: 92-101.
2.
STEVENS PM, COLEMAN SS.
Thigh breva: its pathogenesis and the
rationale for its management.
J Pediatr Orthop. 1985; 5: 515-521.
3
. SK FERNBACH, POZNANSKI AK, KELIKIAN, TACHJDIAN MO,
MARZANO MJ.
Greater trochanteric overgrowth: development and
surgical correction
. Radiology. 1985; 154: 661-664.
4.
JOHN SY, LEE KS, KOH IH, PARK HW, KIM HW.
Trochanteric
advancement in patients with Legg-Calve-Perthes disease ´ does not
improve pain or limp
. Clin Orthop Reports Res. 2008; 466: 927-934.
5.
SCHNEIDMUELLER D, CARSTENS, THOMSEN C m.
Surgical
treatment of overgrowth of the greater trochanter in children and
adolescents.
J Pediatr Orthop. 2006; 26: 486-490.
6.
PAUWELS f.
Osteoarthritis. In: Biomechanics of the Normal and
Diseased Hip: Theoretical Foundation, Technique and Results of
Treatment: An Atlas
. New York, NY: Springer;1976: 129-271.
7
. P HARDCASTLE, SWIM S.
The significance of the Trendelenburg test.
J Bone Joint Surg Br. 1985; 67: 741-746.
8.
PUCHER, RUSZKOWSKI K, BERNARDCZYK K, J NOWICKI.
The value
of greater trochanter distal transfer in the treatment of deformity of the
proximal femur owing to vascular necrosis.
J Pediatr Orthop. 2000; 20:
311-316.
9
. SCHNEIDMUELLER D, CARSTENS, THOMSEN C m.
Surgical
treatment of overgrowth of the greater trochanter in children and
adolescents.
J Pediatr Orthop. 2006; 26: 486-490
10.
PAPAVASILIOU VA, KIRKOS JM:
Reconstruction of residual
deformities of the hip.
Clin Orthop
1997, 341: 123-127.
11.
CHING-LUNG TAI, WENG-PIN CHEN HSIH-HAO CHEN, CHIEN-YU LIN
modes for the femoral proximal osteotomy-L
.
BMC Musculoskeletal
Disorders
, 10 2009: 112
12
. ALI AM, SALEH M, BOLONGARO 's, YANG l.
tibial plateau fracture
model of Experimental for biomechanical testing.
J Biomech 2006; 39
(7): 1355-60.
13
. DELP SL, MALONEY W,
Effects of hip center location on the
moment-generation capacity of the muscles.
J. Biomech 1993, 26 (4-5):
485-499.
14 . FRICKA, K. B.; MAHAR, A. T.; LEE, S. S.; NEWTON, P.O. Biomechanical analysis of flexible intramedullary nail retrograde and antegrade Continence fixation of pediatric femoral fractures using the synthetic bone model. J. Pediatr. Orthop. New York, v. 24, n. 2, p. 167-171, 2004.
15 . GREEN, J. K.; WERNER, F. W.; DHAWAN, R.; EVANS, P. J.; KELLEY, N.; WEBSTER, d. a. the biomechanical study on flexible intramedullary nails used
to treat pediatric femoral fractures. J. Orthop. Res. , New York, v. 23, n. 6, p. 1315-1320, 2005.
16 . LEE, S. S.; MAHAR, A. T.; NEWTON, P.O. Ender nail fixation of pediatric femoral fractures: A biomechanical analysis. J. Pediatr. Orthop. , New York, v. 21, n. 4, p. 442-445, 2001.
17 . COOL, H. Introduction to the biomechanics of the hip. In: TONNIS, D. (Ed.). Congenital dysplasia and discolocation of the hip. Berlin: Springer, 1987 p. 26-57.
18 . Brazil. The Ministry of health. Growth curves of the World Health
Organization. 2007. available at:
http://nutricao.saude.gov.br/sisvan.php?conteudo= <
curvas_cresc_oms >. Accessed: April 10, 2010.
19. SCHALL, r. Estimation in generalized linear models with random effects. Biometrika, Oxford, v. 78, n. 4, p. 719-727, 1991.
20 . NOVACHECK, t. f. Displegia and quadriplegia: pathology and treatment. In: GAGE, J. R. (Ed.). The treatment of cerebral palsy in gait problems. London: Mac
Keith Press, 2004 p. 345-381.
21 . CRISTOFOLINI, L.; VICECONTI, M.; CAPPELLO, A.; TONI, THE. Mechanical