BGD
11, 11943–11983, 2014
Uncertainty analysis of eddy covariance
CO2 flux
measurements
H. Post et al.
Title Page
Abstract Introduction
Conclusions References
Tables Figures
◭ ◮
◭ ◮
Back Close
Full Screen / Esc
Printer-friendly Version
Interactive Discussion
Discussion
P
a
per
|
Discus
sion
P
a
per
|
Discussion
P
a
per
|
Discussion
P
a
per
|
Biogeosciences Discuss., 11, 11943–11983, 2014 www.biogeosciences-discuss.net/11/11943/2014/ doi:10.5194/bgd-11-11943-2014
© Author(s) 2014. CC Attribution 3.0 License.
This discussion paper is/has been under review for the journal Biogeosciences (BG). Please refer to the corresponding final paper in BG if available.
Uncertainty analysis of eddy covariance
CO
2
flux measurements for di
ff
erent EC
tower distances using an extended
two-tower approach
H. Post, H. J. Hendricks Franssen, A. Graf, M. Schmidt, and H. Vereecken
Agrosphere (IBG-3), Forschungszentrum Jülich GmbH, 52425 Jülich, Germany
Received: 30 May 2014 – Accepted: 16 July 2014 – Published: 6 August 2014
Correspondence to: H. Post ([email protected])
BGD
11, 11943–11983, 2014
Uncertainty analysis of eddy covariance
CO2 flux
measurements
H. Post et al.
Title Page
Abstract Introduction
Conclusions References
Tables Figures
◭ ◮
◭ ◮
Back Close
Full Screen / Esc
Printer-friendly Version
Interactive Discussion
Discussion
P
a
per
|
Discus
sion
P
a
per
|
Discussion
P
a
per
|
Discussion
P
a
per
|
Abstract
The use of eddy covariance CO2 flux measurements in data assimilation and other applications requires an estimate of the random uncertainty. In previous studies, the two-tower approach has yielded robust uncertainty estimates, but care must be taken to meet the often competing requirements of statistical independence (non-overlapping
5
footprints) and ecosystem homogeneity when choosing an appropriate tower distance. The role of the tower distance was investigated with help of a roving station sepa-rated between 8 m and 34 km from a permanent EC grassland station. Random un-certainty was estimated for five separation distances with an extended two-tower ap-proach which removed systematic differences of CO2fluxes measured at two EC
tow-10
ers. This analysis was made for a dataset where (i) only similar weather conditions at the two sites were included and (ii) an unfiltered one. The extended approach, applied to weather-filtered data for separation distances of 95 m and 173 m gave uncertainty estimates in best correspondence with the independent reference method The intro-duced correction for systematic flux differences considerably reduced the
overestima-15
tion of the two-tower based uncertainty of net CO2flux measurements, e.g. caused by different environmental conditions at both EC towers. It is concluded that the extension of the two-tower approach can help to receive more reliable uncertainty estimates be-cause systematic differences of measured CO2 fluxes which are not part of random error are filtered out.
20
1 Introduction
Eddy covariance (EC) measurements of the CO2 flux are commonly used to analyze the interactions between terrestrial ecosystems and the atmosphere. This is crucial for the understanding of climate-ecosystem feedbacks as well as for an improved rep-resentation of vegetation and related processes (photosynthesis, respiration,
transpi-25
BGD
11, 11943–11983, 2014
Uncertainty analysis of eddy covariance
CO2 flux
measurements
H. Post et al.
Title Page
Abstract Introduction
Conclusions References
Tables Figures
◭ ◮
◭ ◮
Back Close
Full Screen / Esc
Printer-friendly Version
Interactive Discussion
Discussion
P
a
per
|
Discus
sion
P
a
per
|
Discussion
P
a
per
|
Discussion
P
a
per
|
land surface models. Because both model predictions and measurements comprise errors and because measurements are sparse in geographical space, the application of data assimilation and parameter optimization approaches in climate-ecosystem re-search is increasing (e.g. Braswell et al., 2005; Hill et al., 2012; Kuppel et al., 2012). These approaches allow for an identification of model deficits and can enhance model
5
accuracy. During data assimilation (DA) model estimates are updated or corrected with measurement data that are weighted by the according uncertainty values. Therefore, a reliable uncertainty estimate of the EC measurement data is necessary for DA based studies (Richardson et al., 2008, 2006). Due to the widespread application of land sur-face models which are often combined with data assimilation and parameter estimation
10
approaches there is a need for reliable EC data uncertainty estimates.
Following the definition in Dragoni et al. (2007) we denote uncertainty as the ran-dom error which differs from the systematic error in terms of properties and sources. Systematic errors are considered to remain constant for a given set of environmental conditions. Ideally they can be corrected, but in case of EC measurements this is still
15
limited by either our understanding of various error sources or insufficient background data. Systematic errors arise not only from instrumental calibration and data processing deficits, but also from unmet underlying assumptions about the meteorological condi-tions (Richardson et al., 2012). As described in Sect. 3.1, a main assumption is, e.g. that turbulence is always well developed in the lowest atmospheric boundary layer and
20
responsible for the mass transport. In case of CO2 fluxes, nighttime respiration is of-ten underestimated due to low wind velocities conditions and a temperature inversion which hinders the upward carbon dioxide transport (Baldocchi, 2001). Hence, nighttime data are commonly rejected for further analysis (Barr et al., 2006). Besides, the sum of measured energy fluxes (latent heat, sensible heat and ground heat flux) is often
25
BGD
11, 11943–11983, 2014
Uncertainty analysis of eddy covariance
CO2 flux
measurements
H. Post et al.
Title Page
Abstract Introduction
Conclusions References
Tables Figures
◭ ◮
◭ ◮
Back Close
Full Screen / Esc
Printer-friendly Version
Interactive Discussion
Discussion
P
a
per
|
Discus
sion
P
a
per
|
Discussion
P
a
per
|
Discussion
P
a
per
|
the underestimation of turbulent energy fluxes and/or an overestimation of the available energy (Wilson et al., 2002). The latter is closely linked to (c) an omission of low or high frequency turbulent fluxes (Foken, 2008; Wilson et al., 2002) and the situation that (d) land surface heterogeneity can even on flat terrain induce advection (Finnigan, 2008; Foken et al., 2006; Liu et al., 2006; Panin et al., 1998).
5
Sometimes, measured energy fluxes are corrected for EBD (e.g. Todd et al., 2000; Twine et al., 2000; Hendricks Franssen et al., 2010). Because atmospheric CO2 trans-port processes are very similar to those of latent and sensible heat and because their calculation with the eddy covariance method is based on the same physical assump-tions, the energy balance closure problem might also result in a systematic
underes-10
timation of errors of the CO2 fluxes (Mauder et al., 2010; Foken, 2008; Wilson et al., 2002). However, the correction of measured CO2 fluxes with the EBD is not widely accepted, because the connection between energy- and CO2 deficits has not been firmly proven and depends on the actual reason for the imbalance (Barr et al., 2006; Foken et al., 2006; Wilson et al., 2002). In a comparison of EC and chamber
measure-15
ments, Graf et al. (2013) found different biases for CO2 flux and latent heat flux, and only the latter showed some relation to the EBD of the EC systems. Oren et al. (2006) also pointed out that errors related to the EBD do not necessarily translate to errors in measured CO2which is supported by findings of Scanlon and Albertson (2001).
After a possible correction of the EC flux data for systematic errors a random
er-20
ror will remain which originates e.g. from instrumentation errors, flux footprint hetero-geneity or turbulence sampling errors (Flanagan and Johnson, 2005). The uncertainty cannot be corrected or predicted like systematic errors due to its random character but can be quantified by statistical analysis and characterized by probability distribu-tion funcdistribu-tions (Richardson et al., 2012). Errors due to flux footprint heterogeneity are
25
BGD
11, 11943–11983, 2014
Uncertainty analysis of eddy covariance
CO2 flux
measurements
H. Post et al.
Title Page
Abstract Introduction
Conclusions References
Tables Figures
◭ ◮
◭ ◮
Back Close
Full Screen / Esc
Printer-friendly Version
Interactive Discussion
Discussion
P
a
per
|
Discus
sion
P
a
per
|
Discussion
P
a
per
|
Discussion
P
a
per
|
is a highly stochastic process and especially the sampling or not sampling of larger eddies is associated with considerable random fluctuations of fluxes, even if they are already averaged over a 30 min period.
Within the past decade, several approaches have been proposed to quantify the un-certainty of eddy covariance CO2flux measurements. With the “two-tower” or “paired
5
tower” approach simultaneous flux measurements of two EC towers are analyzed (Hollinger and Richardson, 2005; Hollinger et al., 2004). For the uncertainty quantifica-tion with the two-tower approach, it is necessary that environmental condiquantifica-tions for both towers are nearly identical (Hollinger and Richardson, 2005; Hollinger et al., 2004). However, most eddy covariance sites do not have a nearby second EC tower to
pro-10
vide nearly identical environmental conditions. Therefore, Richardson et al. (2006) in-troduced the “one-tower” or “24 h differencing” method which is based on the two-tower approach. The main difference is that the uncertainty estimate is based on differences between fluxes measured on subsequent days if environmental conditions were similar on both days. Because most often environmental conditions are not the same on two
15
subsequent days (Liu et al., 2006), the applicability of this method suffers from a lack of data and the random error is overestimated (Dragoni et al., 2007). The model resid-ual approach (Dragoni et al., 2007; Hollinger and Richardson, 2005; Richardson et al., 2008) calculates CO2fluxes with a simple model and compares calculated values with measured values. The model residual is attributed to the random measurement error.
20
The method is based on the assumption that the model error is negligible, which is how-ever a very questionable assumption. The instrumental uncertainty contributing to the total random error can be estimated with the random shuffle method (Billesbach, 2011). Finkelstein and Sims (2001) introduced an operational quantification of the instrumen-tal noise and the stochastic error by calculating the auto- and cross-covariances of the
25
BGD
11, 11943–11983, 2014
Uncertainty analysis of eddy covariance
CO2 flux
measurements
H. Post et al.
Title Page
Abstract Introduction
Conclusions References
Tables Figures
◭ ◮
◭ ◮
Back Close
Full Screen / Esc
Printer-friendly Version
Interactive Discussion
Discussion
P
a
per
|
Discus
sion
P
a
per
|
Discussion
P
a
per
|
Discussion
P
a
per
|
uncertainty is no longer required. Hence, the raw-data based uncertainty estimate is not affected by not fulfilled underlying assumptions such as similar environmental con-ditions or a correct simulation model. However, because many data users do not have access to the raw-data but to processed EC data only, random error estimates by the raw-data based approach are not commonly available. Therefore a two-tower based
5
approach is still of great potential. Important advantages of the two-tower approach are (1) its simplicity and user friendliness, (2) its usability for relatively short non gap-filled time series of several months, and (3) the independence of a model. Given the fact that site specific, adequate uncertainty estimates for eddy covariance data are very important but still often neglected due to a lack of resources, we are aiming to advance
10
the two-tower approach so that it can also be applied if environmental conditions at both eddy covariance towers are not very similar.
The main objectives of this study were (1) to analyze the effect of the EC tower dis-tance on the two-tower based CO2flux measurement uncertainty estimate and (2) to extend the two-tower approach with a simple correction term that corrects for
system-15
atic differences in CO2fluxes measured at the two sites. This extension follows the idea of the extended two-tower approach for the uncertainty estimation of energy fluxes pre-sented in Kessomkiat et al. (2013). The correction step is important for providing a more reliable random error estimate. In correspondence with these objectives we analyzed the following questions: what is an appropriate EC tower distance to get a reliable
two-20
tower based uncertainty estimate? Can the random error be quantified in reasonable manner with the extended two-tower approach, even though environmental conditions at both EC towers are clearly not identical? The total random error estimated with the raw-data based method (Mauder et al., 2013) was used as a reference to evaluate our extended two-tower approach based results.
BGD
11, 11943–11983, 2014
Uncertainty analysis of eddy covariance
CO2 flux
measurements
H. Post et al.
Title Page
Abstract Introduction
Conclusions References
Tables Figures
◭ ◮
◭ ◮
Back Close
Full Screen / Esc
Printer-friendly Version
Interactive Discussion
Discussion
P
a
per
|
Discus
sion
P
a
per
|
Discussion
P
a
per
|
Discussion
P
a
per
|
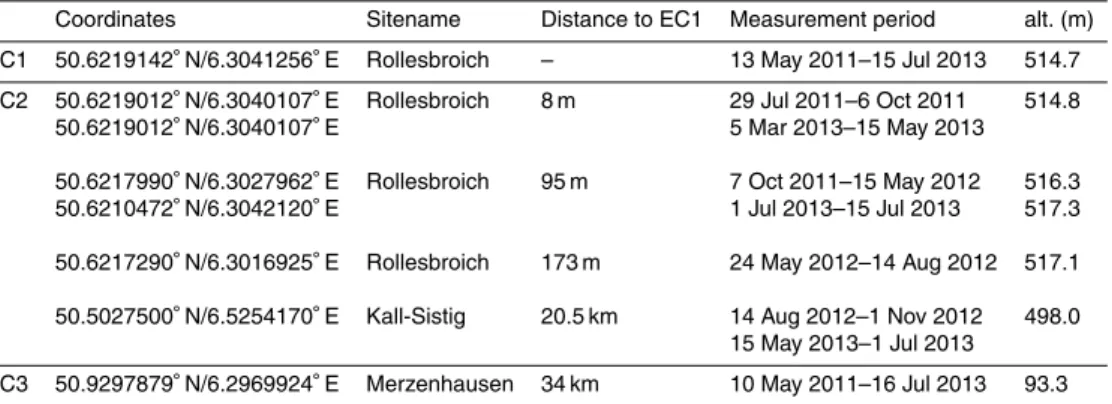
2 Test sites and EC Tower setup
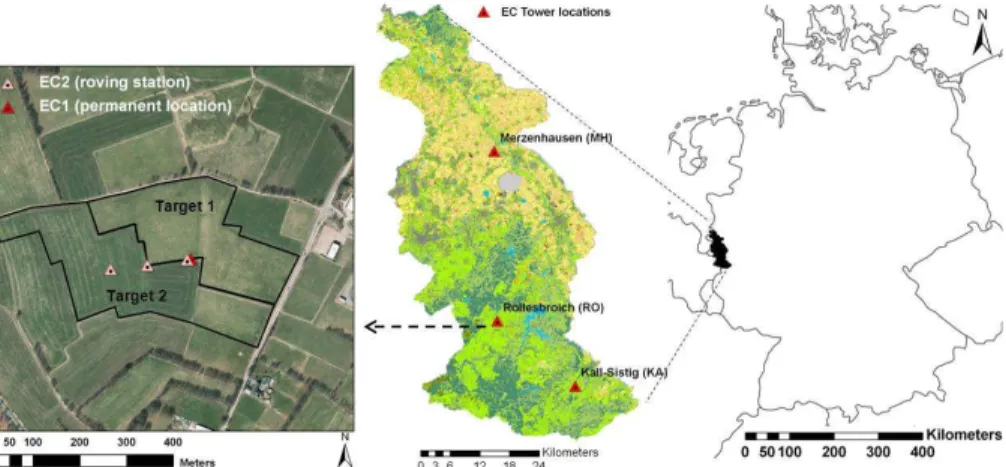
The Rollesbroich test site is an extensively used grassland site, located in the Eifel region of western Germany (Fig. 1). The mean temperature in Rollesbroich is∼7.7◦C and the mean precipitation is∼1033 mm year−1 (Korres et al., 2010). Predominating soil types at the site are Cambisols with a high clay and silt content (Arbeitsgruppe
5
BK50, 2001). The grass species grown in Rollesbroich are mainly ryegrass, particularly perennial ryegrass (lolium perenne) and smooth meadow grass (poa pratensis) (Korres et al., 2010). A permanent eddy covariance tower (EC1) is installed at the Rollesbroich site since May 2011 at a fixed position (Table 1). The measurement height of the sonic anemometer (CSAT3, Campbell Scientific, Logan, UT, USA) and the open-path gas
10
analyzer (Li7500, Li-Cor, Lincoln, NE, USA) is 2.6 m above ground. The canopy height in the two target areas of EC1 (Fig. 1) was measured every 1–2 weeks and varied between 0.03 m and 0.88 m during the measurement period. A second EC tower, the roving station (EC2), has been installed at four different distances (8 m, 95 m, 173 m and 20.5 km) from EC1 for time periods ranging between 3 and 7.5 months (Table 1).
15
The EC2 location “Kall-Sistig” 20.5 km north-east of Rollesbroich is another grassland site with similar environmental conditions as Rollesbroich. The vegetation in Kall-Sistig is extensively managed C3 grass, the same as for Rollesbroich. However, the average plant height measured between 14 August and 30 October 2012 was lower (∼0.15 m) than the respective average for Rollesbroich (∼0.2 m), which is also true for the plant
20
height measured in May and June 2012 (Kall-Sistig:∼0.22 m; Rollesbroich:∼0.29 m). As in Rollesbroich, clayey-silty Cambisols are most widespread (Arbeitsgruppe BK50, 2001) The mean temperature for the entire measurement interval in Kall-Sistig (Table 1) measured at the EC station is 11.4◦C and the soil moisture 32 % compared to 11.0◦C and 35 % in Rollesbroich (same time interval for averaging). Additionally a third EC
25
BGD
11, 11943–11983, 2014
Uncertainty analysis of eddy covariance
CO2 flux
measurements
H. Post et al.
Title Page
Abstract Introduction
Conclusions References
Tables Figures
◭ ◮
◭ ◮
Back Close
Full Screen / Esc
Printer-friendly Version
Interactive Discussion
Discussion
P
a
per
|
Discus
sion
P
a
per
|
Discussion
P
a
per
|
Discussion
P
a
per
|
those in Rollesbroich and Kall-Sistig. The climate at the lowland site Merzenhausen is comparable to the one in Selhausen in 13 km distance to Merzenhausen, where the mean precipitation is∼690 mm year−1 and the yearly mean temperature∼9.8◦C (Korres et al., 2010). The soils are mainly Luvisols with some patches of Kolluvisols (Arbeitsgruppe BK50, 2001). The measurement devices of EC2 and EC3 are the same
5
as the EC1 devices and were installed in 2.6 m above ground as well. Both, the sonic anemometers and the open-path gas analyzers have been calibrated every 1–3 months thoroughly and consistently. Rollesbroich is part of the TERENO network (Zacharias et al., 2011) and in this regard equipped with multiple measurement devices in addition to the EC towers, such as the wireless sensor network “SoilNet” (Bogena et al., 2009).
10
3 Data and methods
3.1 The eddy covariance method
The net ecosystem exchange of CO2 between the land surface and the atmosphere (NEE) can be determined with the eddy covariance method. Eddy covariance stations measure the wind speed in three dimensions and simultaneously the gas
concentra-15
tion with an infrared gas analyzer (Pumpanen et al., 2009) at a temporal resolution of e.g. 10 or 20 Hz. The height of the measurement devices is usually ∼1.5–3 m at agricultural and grassland sites and>20 m at forest sites (e.g. Hollinger et al., 2004). In the lowest atmospheric boundary layer close to the land surface turbulent flow pre-dominates. Accordingly, the eddy covariance method determines the turbulent mass
20
transfer assuming that all vertical mass transport within this part of the boundary layer is transported by turbulent flow (so called “eddies”). The EC-method assumes that hor-izontal divergence of flow and advection are negligible, and therefore the terrain where EC stations are located is ideally flat and the land surface homogeneous (Baldocchi, 2001). A main fundament which allows the utilization of the EC method is the mass
BGD
11, 11943–11983, 2014
Uncertainty analysis of eddy covariance
CO2 flux
measurements
H. Post et al.
Title Page
Abstract Introduction
Conclusions References
Tables Figures
◭ ◮
◭ ◮
Back Close
Full Screen / Esc
Printer-friendly Version
Interactive Discussion
Discussion
P
a
per
|
Discus
sion
P
a
per
|
Discussion
P
a
per
|
Discussion
P
a
per
|
conservation principle, which requires the assumption of steady state conditions of the meteorological variables (Baldocchi, 2003).
By sampling both wind speed in three dimensions and the CO2 concentration over time, the vertical net flux density F of CO2 [mmol m−
2
s−1] across the canopy– atmosphere interface can be calculated as a function of the dry air molar densityρa,
5
the CO2mixing ratioc[mmol m 3
] and the vertical wind velocityω(m s−1):
F =ρa×ω′×c′ (1)
The prime denotes fluctuations around the mean; the bar the average over the mea-surement interval (e.g. half hour), i.e.:
10
c′×ω′=Xn
k=0
ωk−ω ck−c
n−1 (2)
withnbeing the number of measurements during the measurement interval.
The CO2 mixing ratioc is equal to the ratio of the CO2 molar densityρc to the dry air molar densityρa, implying the necessity of a correction (Webb et al., 1980) if CO2
15
concentration was originally measured per unit volume (as in our case).
NEE is positive if the amount of CO2 released to the atmosphere via respiration is higher than the amount of CO2assimilated during photosynthesis. In contrast, negative NEE values denote a higher CO2uptake and a net flux from the atmosphere into the ecosystem.
20
3.2 EC data processing
The EC raw data were measured with a frequency of 20 Hz and fluxes were calculated for intervals of 30 min. The complete processing of the data was performed with the TK3.1 software (Bayreuth, Department of Micrometeorology, Germany; Mauder and Foken, 2011), using the standardized strategy for EC data calculation and quality
as-25
BGD
11, 11943–11983, 2014
Uncertainty analysis of eddy covariance
CO2 flux
measurements
H. Post et al.
Title Page
Abstract Introduction
Conclusions References
Tables Figures
◭ ◮
◭ ◮
Back Close
Full Screen / Esc
Printer-friendly Version
Interactive Discussion
Discussion
P
a
per
|
Discus
sion
P
a
per
|
Discussion
P
a
per
|
Discussion
P
a
per
|
EC conversions and corrections such as e.g. correction of spectral loss and correc-tion for density fluctuacorrec-tions (Webb et al., 1980). It includes tests on high frequency data (site specific plausibility limits, statistical spike detection) as well as on processed half hourly fluxes such as stationarity and integral turbulence tests, footprint analysis (Kormann and Meixner, 2001) and uncertainty estimates for final fluxes. All tests lead
5
to a standardized quality flagging with data flagged as high, moderate or low quality data. For this analysis only high and moderate quality data were used, while low qual-ity data were treated as missing values. To avoid introduction of additional uncertainty no gap filling was performed.
3.3 Uncertainty estimation based on the two-tower approach
10
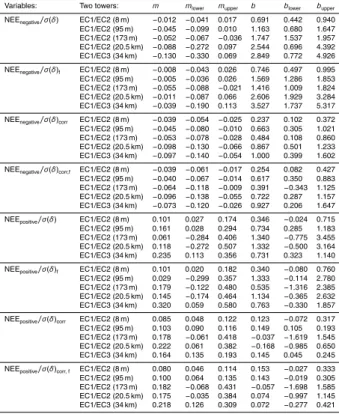
The two-tower approach (Hollinger and Richardson, 2005; Hollinger et al., 2004; Richardson et al., 2006) defines the random error of NEE eddy covariance mea-surements as the standard deviation σ(δ) of the difference between the CO2 fluxes [µmol m−2s−1] simultaneously measured at two different EC towers (NEE1, NEE2):
σ(δ)=σ(NEE√1−NEE2)
2 (3)
15
Based on Eq. (3) we calculated the two-tower based uncertainty estimates using the NEE1 data measured at the permanent EC tower in Rollesbroich (EC1) and the NEE2 data of a second tower which was either the rowing station (EC2) or – in case of the 32 km EC tower distance – another permanent EC tower (EC3, Table 1). For
20
comparison, the measurement uncertainty σ(δ) was calculated separately for each EC tower distance (Table 1) and independently for each of the following schemes:
BGD
11, 11943–11983, 2014
Uncertainty analysis of eddy covariance
CO2 flux
measurements
H. Post et al.
Title Page
Abstract Introduction
Conclusions References
Tables Figures
◭ ◮
◭ ◮
Back Close
Full Screen / Esc
Printer-friendly Version
Interactive Discussion
Discussion
P
a
per
|
Discus
sion
P
a
per
|
Discussion
P
a
per
|
Discussion
P
a
per
|
2. the classical two-tower approach including a weather-filter previously applied to the actual uncertainty estimation procedure (conditions of weather filter summa-rized in Sect. 3.5)
3. the extended two-tower approach with an added correction for systematic flux differences (sfd-correction; Sect. 3.4), without weather-filter
5
4. the extended two-tower approach with weather-filter
The uncertainty estimate of the two-tower approach is obtained by dividing the NEE data series into several groups (“bins”) according to the flux magnitude and then us-ing Eq. (3) to calculate the standard deviationσ(δ) for each group (Richardson et al., 2006). Finally, a linear regression function between the flux magnitude and the
stan-10
dard deviation can be derived. The linear correlation of the uncertainty and the flux magnitude can be explained by the fact that the flux magnitude is a main driving factor for the random error and can explain about 63 % of the variance in the CO2flux error as shown in a case study by Richardson et al. (2006). Accordingly, we calculated the standard deviationσ(δ) [µmol m−2s−1] based on 12 groups of the CO2flux magnitude;
15
six groups for positive and six groups for negative fluxes. Fixed class limits for the flux magnitude would have led to a different number of samples in each group. Separately for positive and negative NEE values, the data were sorted and divided into 6 groups with an equal amount of half hourly data. For each single group the standard deviation
σ(δ) was calculated using the single half-hourly flux differences of NEE1 and NEE2.
20
The corresponding mean NEE magnitude for each group member was determined by averaging all half-hourly means of NEE1and NEE2in the respective group. Then, the linear regression equation was derived separately for negative and positive NEE val-ues using the 6 calculated standard deviationsσ(δ) and the 6 mean NEE values. This procedure was carried out for each dataset of the five EC tower distances and again
25
BGD
11, 11943–11983, 2014
Uncertainty analysis of eddy covariance
CO2 flux
measurements
H. Post et al.
Title Page
Abstract Introduction
Conclusions References
Tables Figures
◭ ◮
◭ ◮
Back Close
Full Screen / Esc
Printer-friendly Version
Interactive Discussion
Discussion
P
a
per
|
Discus
sion
P
a
per
|
Discussion
P
a
per
|
Discussion
P
a
per
|
with the Student’s t test based on Pearson’s product moment correlation coefficient
r. Moreover, the 95 % confidence intervals of the slope and the intercept for each liner regression equation were determined. The linear regression equations were calculated imposing as constraint an intercept≥0, because a negative standard deviation is not possible. With those linear regression equations, the uncertainty for the individual
half-5
hourly NEE measurement values of the permanent EC tower in Rollesbroich (EC1) were estimated using the individual half-hourly NEE1 values [µmol m−2s−1] as input (x) to calculate the corresponding uncertaintyσ(δ) [µmol m−2s−1] (y).
The described calculation of the individual NEE uncertainty values was done for all half hourly NEE data, including those data points that were discarded by the weather
10
filter and/or the sfd-correction. Hence, for each of the four two-tower based uncertainty estimation schemes the same amount of individual NEE uncertainty values was gen-erated In correspondence with the NEE uncertainty datasets gengen-erated for the 5 EC tower distances × 4 schemes, 20 mean two-tower approach basedNEE uncertainty estimates for the EC1 station were calculated by averaging the individual half hourly
15
uncertainty values (Table 2). These mean uncertainty estimates were used to evaluate the effect of the EC tower distance as well as the sfd-correction (Sect. 3.4) and the weather-filter (Sect. 3.5) on the two-tower based uncertainty estimation. Even though Hollinger et al. (2004) and Richardson and Hollinger (2005) already pointed out that the two-tower approach assumes similar environmental conditions and non-overlapping
20
footprints, we applied the classical approach for all EC tower distances, even if these basic assumptions were not fulfilled, to allow for a comparison of the results before and after the usage of the weather-filter and the sfd-correction (extended two-tower approach).
3.4 Correction for systematic flux differences (sfd-correction) 25
guar-BGD
11, 11943–11983, 2014
Uncertainty analysis of eddy covariance
CO2 flux
measurements
H. Post et al.
Title Page
Abstract Introduction
Conclusions References
Tables Figures
◭ ◮
◭ ◮
Back Close
Full Screen / Esc
Printer-friendly Version
Interactive Discussion
Discussion
P
a
per
|
Discus
sion
P
a
per
|
Discussion
P
a
per
|
Discussion
P
a
per
|
antee statistical independence. Hollinger and Richardson (2005) use threshold values for three variables (photosynthetically active photon flux density PPFD, temperature and wind speed) to determine whether environmental conditions are equivalent. In-dependent of this definition, our understanding of “environmental conditions” includes both weather conditions and land surface properties such as soil properties (texture,
5
density, moisture, etc.), plant characteristics (types, height, density, rooting depth, etc.) nutrient availability and fauna (rabbits, earthworms, microorganisms, etc.), which are irregularly distributed and effect respiration and/or photosynthesis. Strictly speaking, if footprints do not overlap 100 %, the assumption of identical environmental conditions is already not fulfilled. When applying a two-tower based approach it is important to
10
assure that systematic differences of the measured fluxes which are partly caused by within site or among site heterogeneity are not attributed to the random error estimate of the measured NEE. Our assumption that even within a site with apparently one uniformly distributed vegetation type (and for very short EC tower distances) land sur-face heterogeneity can cause significant spatial and temporal variability in measured
15
NEE is e.g. supported by Oren et al. (2006). They found that the spatial variability of ecosystem activity (plants and decomposers) and LAI within a uniform pine plantation contributes to about half of the uncertainty in annual eddy covariance NEE measure-ments while the other half is attributed to micrometeorological and statistical sampling errors. This elucidates the relevance of considering systematic flux differences caused
20
by within site ecosystem heterogeneity when calculating a two-tower based uncertainty estimate.
The introduced sfd-correction ensures that the random error estimate determined with a two-tower approach does not include systematic flux differences because they are not inherent to the actual random error of the measured NEE at one EC tower
sta-25
BGD
11, 11943–11983, 2014
Uncertainty analysis of eddy covariance
CO2 flux
measurements
H. Post et al.
Title Page
Abstract Introduction
Conclusions References
Tables Figures
◭ ◮
◭ ◮
Back Close
Full Screen / Esc
Printer-friendly Version
Interactive Discussion
Discussion
P
a
per
|
Discus
sion
P
a
per
|
Discussion
P
a
per
|
Discussion
P
a
per
|
statistically be separated quite easily from random differences of the EC flux measure-ments is their fundamentally different behavior in time: random differences fluctuate highly in time whereas systematic differences tend to be constant over time or show slow variations. The sfd-correction introduced is similar to the second correction step in Kessomkiat et al. (2013, Eq. 6 therein), but adapted to the measured NEE instead
5
of latent and sensible heat fluxes. To define the correction term it was necessary to find a moving averaging interval that is long enough to exclude most of the random error part but short enough to consider daily changes of these systematic flux diff er-ences. Twelve hours (including 24 half hourly time steps) were found to be a suitable time interval to calculate the running mean for the sfd-correction term. This period also
10
corresponds well with the coefficient of spatial variation (CV) which Oren et al. (2006) found to be stable after∼7 daytime and∼12 nighttime hours in case of a uniform pine plantation.
For each moving averaging interval, the meanNEE12hof one EC tower (separately for EC1 and EC2) [µmol m−2s−1] and the mean CO2 flux averaged over both EC towers
15
NEE2T12h [µmol m− 2
s−1] were calculated to define the sfdcorrection term which was used to calculate the corrected NEEcorr[µmol m−
2 s−1]:
NEEcorr=NEE2T12h
NEE12h ×NEE (4)
NEE is the single half-hourly, processed NEE value [µmol m−2s−1] of one EC tower.
20
Only if both NEE data, NEE-EC1- for the permanent EC1 tower and NEE-EC2- for the second tower, were available at a particular half hourly time step and if both values were either positive or negative the respective data were included to calculate the sfd-correction term. The sfd-correction was done separately for positive and negative fluxes, due to the different sources, properties and magnitudes of the CO2flux measurements
25
BGD
11, 11943–11983, 2014
Uncertainty analysis of eddy covariance
CO2 flux
measurements
H. Post et al.
Title Page
Abstract Introduction
Conclusions References
Tables Figures
◭ ◮
◭ ◮
Back Close
Full Screen / Esc
Printer-friendly Version
Interactive Discussion
Discussion
P
a
per
|
Discus
sion
P
a
per
|
Discussion
P
a
per
|
Discussion
P
a
per
|
least 50 % of the data for NEE-EC1- and NEE-EC2- were available for a particular mov-ing averagmov-ing interval. Due to the frequent occurrence of gaps in the data series the amount of available NEEcorrvalues considerably decreased by applying this 50 % cri-terion. Hence it was not possible to choose a stricter criterion such as 70 % or 90 % data availability. The final sfd-corrected NEE1corrvalues for EC1 and NEE2corrvalues
5
for EC2 should not be understood as corrected NEE flux data. They were used only to enhance the two-tower based uncertainty estimation in a way that systematic flux dif-ferences which cause an overestimation of the uncertainty are filtered out. Moreover, systematic flux differences at two EC towers are not to be confused with systematic errors, which are independent of the uncertainty estimation method and optimally
cor-10
rected before the random error is estimated.
3.5 Filter for weather conditions
For larger distances of two EC towers, such as the 20.5 km and 34 km distance in this study, different weather conditions can cause differences of the measured fluxes in addition to the different land surface properties. Some weather variables (e.g.
tem-15
perature) are following a clear diurnal and annual course and differences in e.g. tem-perature at two EC towers are therefore relatively constant. This is expected to cause rather systematic differences in the measured NEE which can be captured with the sfd-correction. However, other variables such as wind speed or incoming short wave radia-tion are spatially and temporally much more variable, for example related to single wind
20
gusts or cloud movement. Differences in the measured fluxes at two EC towers caused by those spatial-temporally highly variable weather variables cannot be captured well with the sfd-correction term due to this “random character”. However, a weather filter can account for this because it compares the differences in weather variables at each single time step. Hence, we additionally applied a weather filter to investigate its effect
25
BGD
11, 11943–11983, 2014
Uncertainty analysis of eddy covariance
CO2 flux
measurements
H. Post et al.
Title Page
Abstract Introduction
Conclusions References
Tables Figures
◭ ◮
◭ ◮
Back Close
Full Screen / Esc
Printer-friendly Version
Interactive Discussion
Discussion
P
a
per
|
Discus
sion
P
a
per
|
Discussion
P
a
per
|
Discussion
P
a
per
|
used in e.g. Hill et al. (2012) and Richardson et al. (2006) as indicators for similar environmental conditions. Accordingly, a filter for different weather conditions was in-troduced to only include half hourly NEE data, if the weather conditions at the second EC tower are similar to those at the permanent EC1 tower location in Rollesbroich. Following the definition in Richardson et al. (2006), similar weather conditions were
5
assumed to be present if the temperature difference was<3◦C; the difference in wind speed<1 m s−1and the difference in PPFD<75 µmol m−2s−1. The weather-filter was applied for each half-hourly time step for both the sfd-corrected dataset as well as for the non-corrected NEE data. As shown e.g. in Tsubo and Walker (2005), the incoming short wave radiation (or solar irradiance SI) and the photosynthetically active radiation
10
(PAR) are linearly correlated. Accordingly SI and PPFD measured at the EC1 station in Rollesbroich were also linearly correlated. Because direct PPFD measurements were not available for all measurement periods, we derived a linear regression equation on the basis of all SI and PPFD data for the permanent EC tower station (EC1). Using this equation, missing PPFD values were estimated if only SI but no PPFD data were
15
available at a certain time step.
3.6 Footprint analysis
The footprint analysis was applied to quantify the percentage footprint overlap of the two EC-stations during the measurement periods. This information was not used to filter the data but to allow for a better understanding of the mean uncertainty estimates
20
for the different scenarios. Using the analytical model of Kormann and Meixner (2001) implemented in the TK3.1 software (Mauder et al., 2013), the cumulative source contri-bution was quantified separately for two contiguous areas adjacent to the tower. Both contiguous areas (target 1 and target 2; Fig. 1) were covered with grass, but managed by different farmers. The footprints of two halfhourly flux measurements were defined
25
correspond-BGD
11, 11943–11983, 2014
Uncertainty analysis of eddy covariance
CO2 flux
measurements
H. Post et al.
Title Page
Abstract Introduction
Conclusions References
Tables Figures
◭ ◮
◭ ◮
Back Close
Full Screen / Esc
Printer-friendly Version
Interactive Discussion
Discussion
P
a
per
|
Discus
sion
P
a
per
|
Discussion
P
a
per
|
Discussion
P
a
per
|
ing measurement period (Table 1) was calculated by dividing the number of NEE data with overlapping footprints (×100) by the total number of NEE data available for the same measurement period. This implies that the calculated average footprint overlap [%] for a particular EC tower distance is not the total percentage area of footprint over-lap but the percentage of time steps CO2 fluxes originate from nearly the same area
5
(defined by target 1 and target 2).
3.7 Comparison measures
To compare and evaluate the two-tower based uncertainty estimates, we calculated random error estimates based on Mauder et al. (2013) as a reference. This reference method is independent of the two-tower based approach, because data of only one
10
EC tower are used to quantify the random error of the measured fluxes and raw data instead of the processed fluxes are used. The raw-data based random error estimates – the instrumental noise σcovnoise and the stochastic error σ
stoch
cov – were calculated in-dependently. Generally, the instrument noise σcovnoise was considerably lower than the stochastic errorσcovstoch. The total raw-data based random error σcov was calculated by
15
adding σcovnoise and σ stoch
cov The absolute random error σcov [µmol m− 2
s−1] used for the evaluation of the two-tower based random error estimates was calculated by averaging the single raw-data based NEE uncertainty values measured at the permanent EC1 tower in Rollesbroich. In order to be consistent with the two-tower based calculations, exactly the same half hourly time steps of the EC1 data series used for the two-tower
20
based uncertainty estimation were used to calculate the corresponding mean refer-ence valuesσcov. As indicator for the performance of the two-tower based uncertainty estimation schemes applied for the five different EC tower distances, the relative diff er-ence∆σcov[%] of a two-tower based uncertainty value [µmol m−
2
s−1] and the reference valueσcov [µmol m−
2
s−1] was calculated:
25
∆σcov[%]=
σ(δ)−σcov
BGD
11, 11943–11983, 2014
Uncertainty analysis of eddy covariance
CO2 flux
measurements
H. Post et al.
Title Page
Abstract Introduction
Conclusions References
Tables Figures
◭ ◮
◭ ◮
Back Close
Full Screen / Esc
Printer-friendly Version
Interactive Discussion
Discussion
P
a
per
|
Discus
sion
P
a
per
|
Discussion
P
a
per
|
Discussion
P
a
per
|
Then,∆σcov values were compared for the different EC tower separation distances and two-tower based uncertainty estimation schemes outlined in Sect. 3.3. The perfor-mance of the two-tower based uncertainty estimation was considered better ifσcov[%] was smaller.
4 Results
5
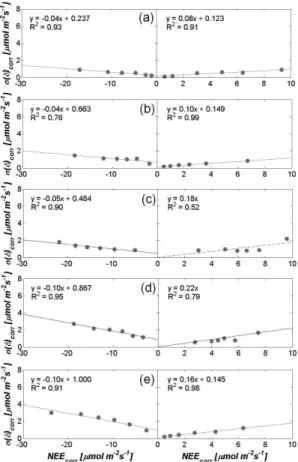
4.1 Classical two-tower based random error estimates
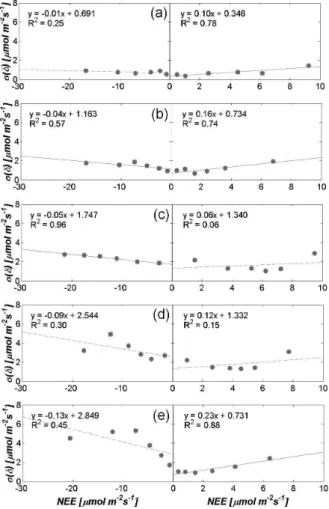
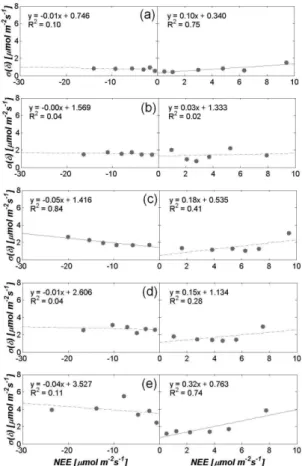
Figures 2 and 3 show the linear regressions of the random error σ(δ) (also referred to as “standard error” or “uncertainty”) as function of the NEE magnitude determined with the classical two-tower approach (without sfd-correction) for the different EC tower distances without weather-filter (Fig. 2) and with weather-filter (Fig. 3). The dashed
lin-10
ear regression lines denote that the linear correlation betweenσ(δ) and NEE is weak (p >0.1), which is in particular true for the positive NEE values measured at 173 m and 20.5 km EC tower distances as well as for the negative NEE values at 20.5 km and 34 km distance. The 95 % confidence intervals of the respective slopes and the intercepts are summarized in the Appendix (A1). Uncertainty estimation with the
clas-15
sical two-tower approach is critical for those larger distances because measured flux differences caused by different environmental conditions at both EC towers can super-impose the random error signal which e.g. originates from instrumental or turbulence sampling errors. This weakens the correlation of the random error and the flux magni-tude. This is not surprising since Hollinger et al. (2004) and Richardson and Hollinger
20
(2005) already pointed out that similar environmental conditions are a basic assump-tion of the two-tower approach. Therefore, statements of how the weather filter affects the mean uncertainty estimateσ(δ) for those large distances need to be treated with caution. The weather-filtering only increased the correlation between the flux magni-tude and the random error σ(δ) for positive fluxes for separation distances of 173 m
25
BGD
11, 11943–11983, 2014
Uncertainty analysis of eddy covariance
CO2 flux
measurements
H. Post et al.
Title Page
Abstract Introduction
Conclusions References
Tables Figures
◭ ◮
◭ ◮
Back Close
Full Screen / Esc
Printer-friendly Version
Interactive Discussion
Discussion
P
a
per
|
Discus
sion
P
a
per
|
Discussion
P
a
per
|
Discussion
P
a
per
|
to a decreased number of samples in each averaging group of the NEE flux mag-nitude. Therefore, testing stricter weather-filter criteria (e.g. wind speed <0.5 m s−1, PPFD<50 µmol m−2s−1,T <2◦C) which caused a decline of samples in each group fromn >1000 to 24 or less, resulted in an even weaker correlation of the flux magni-tude and the random errorσ(δ).
5
As illustrated in Table 2, the mean NEE uncertainty estimate based on the classical two-tower approach increased as a function of EC tower distance. However, without applying the weather-filter the mean uncertaintyσ(δ) was nearly identical for the two largest distances (20.5 km and 34 km), although e.g. the land cover and management in Merzenhausen (EC3 tower at 34 km separation) were different to the Rollesbroich
10
site. As a result of the weather-filtering, the mean uncertainty estimate decreased for the distances 173 m (by 10.8 %) and 20.5 km (by 13.6 %). However, for the 95 m and 34 km distance, the mean uncertainty estimate increased by the weather-filtering by up to 15 % (95 m). This implies that for the classical two-tower approach (without sfd-correction) weather-filtering did not clearly reduce the overestimation of the uncertainty
15
for largest EC tower distances (20.5 km and 34 km) where weather-filtering is expected to be particularly relevant.
Comparing the mean uncertainty estimates determined with the classical two-tower approach without weather filter (σ(δ)) and with weather filter (σ(δ)f) with the reference random error estimatesσcov(Table 2) indicates thatσ(δ) andσ(δ)f were overestimated
20
for each of the five EC tower differences. This could be expected for the large distances, because basic assumptions for the application of the classical two-tower approach are violated for these large distances. But results illustrate that even for short EC tower distances the classical two-tower approach results in an overestimation of the NEE uncertainty compared to the raw-data based approach (Table 2).
25
4.2 Extended two-tower approach
BGD
11, 11943–11983, 2014
Uncertainty analysis of eddy covariance
CO2 flux
measurements
H. Post et al.
Title Page
Abstract Introduction
Conclusions References
Tables Figures
◭ ◮
◭ ◮
Back Close
Full Screen / Esc
Printer-friendly Version
Interactive Discussion
Discussion
P
a
per
|
Discus
sion
P
a
per
|
Discussion
P
a
per
|
Discussion
P
a
per
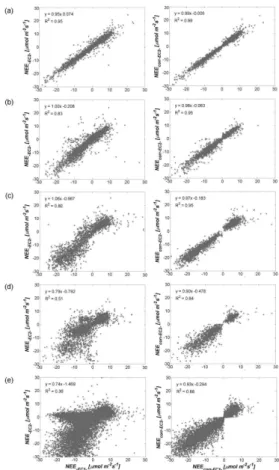
|
NEE-EC2-). The sfd-correction reduced the bias and scattering, because systematic dif-ferences of the measured fluxes, e.g. induced by different environmental conditions, were removed. As expected, the effect of the sfd-correction was considerably higher for the larger EC tower distances because environmental conditions are also expected to differ more if the distance of two locations is larger. For the 8 m EC tower distance
5
for instance, the effect of the sfd-correction is very minor because footprints are often nearly overlapping. However, for the EC tower distances≥173 m, the bias and scatter-ing of NEE-EC1-and NEE-EC2-was considerably reduced by the sfd-correction.
A comparison of Figs. 2 and 4 illustrates how the sfd-correction affected the lin-ear regression of the NEE standard error as function of NEE flux magnitude: the
10
sfd-correction considerably improved the correlation of NEEcorr and the standard er-rorσ(δ)corrfor the EC tower distances 20.5 km and 34 km from R
2
≥0.15 toR2≥0.79 (withp≤0.05).
Applying the sfd-correction (without weather-filter) reduced the mean uncertainty value by 36.7 % for the 8 m distance, 48.4 % for the 95 m distance, 48.7 % for the
15
173 m, 47 % for the 20.5 km distance, and 54.2 % for the 34 km EC tower distance. Comparing the relative differences ∆σcov (Eq. 5) of the mean two-tower based un-certainty estimates and the raw-data based reference value σcov (Table 2) indicates that the correction for systematic flux differences considerably improved the two-tower based uncertainty estimate: as Table 2 shows, the difference∆σcovof the independent
20
uncertainty estimatesσ(δ)corrandσcovwas notably smaller (≤49.6 %) for all distances except the 8 m distance compared to∆σcov betweenσcovand the uncertainty estimate
σ(δ) determined with the classical two-tower approach (≤249.1 %). The most consid-erable improvement was achieved for the 95 m EC tower distance (∆σcov=101.4 % before and −2.6 % after sfd-correction) and the 173 m distance (∆σcov=87.7 %
be-25
BGD
11, 11943–11983, 2014
Uncertainty analysis of eddy covariance
CO2 flux
measurements
H. Post et al.
Title Page
Abstract Introduction
Conclusions References
Tables Figures
◭ ◮
◭ ◮
Back Close
Full Screen / Esc
Printer-friendly Version
Interactive Discussion
Discussion
P
a
per
|
Discus
sion
P
a
per
|
Discussion
P
a
per
|
Discussion
P
a
per
|
the weather filter applied. The effect of the weather-filter on the uncertainty estimates of the shorter EC tower distances was very minor (Table 2). As shown in Table 2 the uncertainty estimatesσ(δ)corr, f determined with the extended two-tower approach are nearly identical to the independent reference values σcov for the EC tower distances 95 m and 173 m suggesting that those distances were most suitable for the application
5
of the extended two-tower approach. The NEE uncertaintyσ(δ)corr, f estimated for the grassland site Rollesbroich agree well with the NEE uncertainty values for grassland sites by Richardson et al. (2006), ranging between ∼0.2 µmol CO2m−
2
s−1 in winter months and∼1 µmol CO2m−
2
s−1in summer months.
4.3 Discussion
10
The results show that the two-tower based uncertainty estimates (both classical and extended two-tower approach) were smallest for the 8 m distance. This can be ex-plained with the results of the footprint analysis: while the percentage footprint over-lap is 20.4 % for the 95 m EC tower distance and only 0.9 % for the 173 m EC tower distance, it is 61.2 % for the 8 m EC tower distance. The more frequent overlapping
15
of the 8 m distance footprint areas is associated with a more frequent sampling of the same eddies. As a consequence part of the random error was not captured with the two-tower approach. If EC towers are located very close to each other (<10 m) and the footprint overlap approaches 100 %, only instrumental errors and stochastic-ity related sampling of small eddies will be captured with the two-tower based
un-20
certainty estimate. Because the EC measurements are statistically not independent if the footprints are overlapping, the classical EC tower method is not expected to give reliable uncertainty estimates for very short EC tower distances (Hollinger and Richardson, 2005; Hollinger et al., 2004). However, without applying the sfd-correction, the mean uncertainty estimate σ(δ) was still higher than the raw-data based
refer-25
ence value which includes both the instrumental noiseσcovnoise and the stochastic error
σcovstoch. The raw-data based instrumental noiseσ noise
cov itself was only 0.04 µmol m− 2
BGD
11, 11943–11983, 2014
Uncertainty analysis of eddy covariance
CO2 flux
measurements
H. Post et al.
Title Page
Abstract Introduction
Conclusions References
Tables Figures
◭ ◮
◭ ◮
Back Close
Full Screen / Esc
Printer-friendly Version
Interactive Discussion
Discussion
P
a
per
|
Discus
sion
P
a
per
|
Discussion
P
a
per
|
Discussion
P
a
per
|
of 0.69 µmol m−2s−1 (σcovnoise+σ stoch
cov ) for the dataset of the 8 m EC tower distance. The mean uncertainty value derived with the classical two-tower approach for the same dataset was 0.76 µmol m−2s−1and thus higher thanσcovnoisesuggesting that even at 8 m EC tower distance instrumentation errors were only a minor part of the two-tower based uncertainty estimate. This is in correspondence with the result that the sfd-corrected
5
uncertainty estimate was lower than the reference for the 8 m distance (Table 2). For the larger separation distances 95 m or 173 m, footprints were notably less over-lapping and turbulence sampling errors are almost fully accounted for by a two-tower approach. (It should be noted that forest stations, with a typically larger aerodynamic measurement height and footprint size, will require larger separation distances.)
How-10
ever, different land surface properties and management are more likely for the larger separation distances and can cause systematic flux differences that should not be at-tributed to the random error estimate. The effect of within site heterogeneity of land surface properties on the spatial and temporal variability in measured NEE and how it contributes to the uncertainty in annual NEE measurements is e.g. shown in Oren
15
et al. (2006). Different information and data were available showing that land surface properties are spatially heterogeneous distributed at the Rollesbroich site: (1) single fields at the Rollesbroich site including the two target areas (Sect. 3.6) are managed by different farmers. Information the land owners provided, as well as periodic camera shots and grass height measurements around the EC towers indicated that the timing
20
of fertilization and grass cutting as well as the amount of manure applied varied be-tween the single fields (and the two target areas of the footprint analysis) during the measurement period, (2) soil type distribution as displayed in the German soil map shows heterogeneity (Arbeitsgruppe BK50, 2001), (3) soil carbon and nitrogen pools [g kg−1] as well as bulk density [g cm−3] and skeleton fraction [%] measured from April–
25
BGD
11, 11943–11983, 2014
Uncertainty analysis of eddy covariance
CO2 flux
measurements
H. Post et al.
Title Page
Abstract Introduction
Conclusions References
Tables Figures
◭ ◮
◭ ◮
Back Close
Full Screen / Esc
Printer-friendly Version
Interactive Discussion
Discussion
P
a
per
|
Discus
sion
P
a
per
|
Discussion
P
a
per
|
Discussion
P
a
per
|
sensor network (“SoilNet”; Bogena et al., 2009), calibrated for the Rollesbroich site by Qu et al. (2013). This data shows that both soil moisture and soil temperature are heterogeneous within the site (Qu et al., 2014). The effect of soil moisture, soil temper-ature and soil properties on CO2 fluxes (respiration mainly) is well known (e.g. Herbst et al., 2009; Flanagan and Johnson, 2005; Xu et al., 2004; Lloyd and Taylor, 1994;
5
Orchard and Cook, 1983) as well as the role of grassland management (e.g. Allard et al., 2007). It is expected that systematic differences in measured NEE caused by those spatial variable land surface properties are stronger during night than during day since they affect respiration more directly than photosynthesis which also agrees with the findings in Oren et al. (2006). However, since our focus was on estimating
10
the total uncertainty of measured NEE and since it is expected that the sfd-correction also captures systematic differences in weather conditions (e.g. temperature, solar ra-diation) that strongly determine the magnitude of carbon uptake during day, we did not distinguish between the uncertainty of daytime and nighttime data. At very large EC tower distances (20.5 km, 34 km) footprints were not overlapping and the
envi-15
ronmental conditions were considerably different; in particular for the EC tower setup Rollesbroich/Merzenhausen with different land use (grassland/crop) and climate condi-tions (Sect. 2). For those distances, the relative difference∆σcovbetween the reference valueσcov and σ(δ) (classical two-tower approach) was much larger than for the rela-tive difference∆σcov betweenσcov and σ(δ)corr, f (extended two-tower approach). The
20
uncertainty estimate improved by 80 % for the 20.5 km distance and 82 % for the 34 km if both correction and weather filter were used. However, after applying the sfd-correction and the weather-filtering, the mean uncertainty estimate for the large EC tower distances was still 33.2 % and 49.6 % higher than the raw-data based reference value (Table 2) suggesting that these large EC tower distances were less suitable for
25
estimating the NEE uncertainty on the basis of the extended two-tower approach com-pared to the 95 m and 173 m distance. The absolute corrected and weather-filtered uncertainty value σ(δ)corr, f [µmol m−
2
BGD
11, 11943–11983, 2014
Uncertainty analysis of eddy covariance
CO2 flux
measurements
H. Post et al.
Title Page
Abstract Introduction
Conclusions References
Tables Figures
◭ ◮
◭ ◮
Back Close
Full Screen / Esc
Printer-friendly Version
Interactive Discussion
Discussion
P
a
per
|
Discus
sion
P
a
per
|
Discussion
P
a
per
|
Discussion
P
a
per
|
The raw-data based reference valueσcov [µmol m− 2
s−1] however was also smaller for the 34 km dataset than for the 20.5 km dataset which can be related to the different lengths and timing (i.e., different seasons) of the measurement periods for each of the five EC tower distances: the roving station was moved from one distance to another within the entire measurement period of∼27 months. During this entire time period of
5
data collection, the length and timing of the single measurement periods varied for the five EC tower separation distances (Table 1). This is not optimal because the random error is directly related to the flux magnitude and the flux magnitude itself is directly related to the timing of the measurements. Because in spring and summer flux magni-tudes are higher, the random error is generally higher as well (Richardson et al., 2006).
10
To reduce this effect, we captured spring/summer as well as autumn/winter months in each measurement period (Table 1). However, the timing of the measurements and the amount of data available were not the same for the five EC datasets In particular the permanent EC tower in Merzenhausen (EC3 in 34 km distance to EC1) was mea-suring considerably longer (>2 years) than the roving station did for the other four EC
15
tower distances. Therefore, differences of the mean uncertainty estimates for the five measurement periods were partly independent of the EC tower distance. This effect gets obvious when looking at the mean uncertainties σcov estimated with the refer-ence method, which should be independent of the distance but were also found to be different for each dataset of the five EC tower distances. Against this background,
state-20
ments about how EC tower distances affect the two-tower based uncertainty estimate need to be treated with caution.
Another point that should be emphasized is that there is an uncertainty in mean NEE values of the 12 h moving averaging intervals which were used to calculate the sfd-correction term (Sect. 3.4). As mentioned the moving averaging interval should
25
BGD
11, 11943–11983, 2014
Uncertainty analysis of eddy covariance
CO2 flux
measurements
H. Post et al.
Title Page
Abstract Introduction
Conclusions References
Tables Figures
◭ ◮
◭ ◮
Back Close
Full Screen / Esc
Printer-friendly Version
Interactive Discussion
Discussion
P
a
per
|
Discus
sion
P
a
per
|
Discussion
P
a
per
|
Discussion
P
a
per
|
they still contain the random error part that cannot be corrected or filtered out. There-fore, completely correcting the difference in mean NEE slightly overcorrects systematic differences in NEE.
In general, the weather-filter did not improve the uncertainty estimates as much as the sfd-correction. However, this does not imply that differences in weather conditions
5
are negligible when applying the extended two-tower approach for larger EC tower dis-tances In fact the systematic part of measured EC flux differences between both towers caused by (steady, systematic) among-site differences in weather conditions were al-ready partly captured with the sfd-correction. In contrast such systematic differences were difficult to capture with the weather-filter because it was not possible to define
10
weather-filter criteria that allow the assumption of data similarity without reducing the dataset too much for further meaningful analysis.
5 Conclusions
When estimating the uncertainty of eddy covariance net CO2flux (NEE) measurements with a two-tower based approach it is important to consider that the basic assumptions
15
of identical environmental conditions (including weather conditions and land surface properties) on the one hand and non-overlapping footprints on the other hand are con-tradicting and impossible to fulfill. If the two EC towers are located in a distance large enough to ensure non overlapping footprints, different environmental conditions at both EC towers can cause systematic differences of the simultaneously measured fluxes
20
that should not be included in the uncertainty estimate. This study for the grassland site Rollesbroich in Germany showed that the extended two-tower approach which includes a correction for systematic flux differences (sfd-correction) can be used to derive more reliable (less overestimated) uncertainty estimates compared to the classical two-tower approach. An advantage of this extended two-tower approach is its simplicity and the
25
BGD
11, 11943–11983, 2014
Uncertainty analysis of eddy covariance
CO2 flux
measurements
H. Post et al.
Title Page
Abstract Introduction
Conclusions References
Tables Figures
◭ ◮
◭ ◮
Back Close
Full Screen / Esc
Printer-friendly Version
Interactive Discussion
Discussion
P
a
per
|
Discus
sion
P
a
per
|
Discussion
P
a
per
|
Discussion
P
a
per
|
five different EC tower distances showed that the mean uncertainty estimated with our extended two-tower approach for the 95 m and 173 m distances were nearly identical to the random error estimated with the raw-data based reference method. This sug-gests that these distances were most appropriate for the application of the extended two-tower approach in this study. Also for the largest EC tower distances (20.5 km,
5
34 km) the sfd-correction significantly improved the correlations of the flux magnitude and the random error and significantly reduced the difference to the independent, raw data based reference value. We therefore conclude that if no second EC tower is avail-able at a closer distance (but availavail-able further away), a rough, typically overestimated NEE uncertainty estimate can be acquired with the extended two-tower approach even
10
although environmental conditions at the two sites are not identical.
A statement about the transferability of our experiment to other sites and EC tower distances requires further experiments. However, we assume transferability is given if both EC towers are located at sites of the same vegetation type (e.g. C3-grasses, C4-crops, deciduous forest, coniferous forest, etc.). Flux differences caused by a different
15
phenology can be very hard to separate from the random error estimate, even though they are expected to be mainly systematic and could therefore be partly captured with the sfd-correction. Moreover, the EC raw data should be processed in the same way (as done here) and the measurement devices should be identical and installed at about the same measurement height. Important is also that the instruments are calibrated
thor-20
oughly and consistently Because this was true for the three EC towers included in this study (Table 1, Sect. 2), we conclude that systematic flux differences that are corrected for with the sfd-correction arise mainly from different environmental conditions whereas calibration errors are assumed to have a very minor effect. If those prerequisites are not given, it is very difficult to distinguish and quantify sources of measured flux
dif-25
![Table 2. Mean NEE uncertainty [µmol m −2 s −1 ] for five EC tower distances estimated with the classical two-tower approach, with and without including a weather-filter (σ(δ), σ(δ) f )](https://thumb-eu.123doks.com/thumbv2/123dok_br/17210204.243331/34.918.54.657.307.437/uncertainty-distances-estimated-classical-approach-including-weather-filter.webp)