PRECISION VITICULTURE FROM MULTITEMPORAL, MULTISPECTRAL VERY
HIGH RESOLUTION SATELLITE DATA
Z. Kandylakis and K. Karantzalos
Remote Sensing Laboratory, National Technical University of Athens Heroon Polytechniou 9, Zographos, 15780, Greece [email protected] [email protected]
Commission VIII, WG VIII/8
KEY WORDS: Vineyards, Crop Management, Selective Harvesting, Oenological potential, Phenolic composition
ABSTRACT:
In order to exploit efficiently very high resolution satellite multispectral data for precision agriculture applications, validated methodologies should be established which link the observed reflectance spectra with certain crop/plant/fruit biophysical and biochemical quality parameters. To this end, based on concurrent satellite and field campaigns during the veraison period, satellite and in-situ data were collected, along with several grape samples, at specific locations during the harvesting period. These data were collected for a period of three years in two viticultural areas in Northern Greece. After the required data pre-processing, canopy reflectance observations, through the combination of several vegetation indices were correlated with the quantitative results from the grape/must analysis of grape sampling. Results appear quite promising, indicating that certain key quality parameters (like brix levels, total phenolic content, brix to total acidity, anthocyanin levels) which describe the oenological potential, phenolic composition and chromatic characteristics can be efficiently estimated from the satellite data.
1. INTRODUCTION
Multispectral sensors on-board satellite, aerial and UAV platforms are nowadays the main source of information for precision agriculture and environmental monitoring applications. Due to certain key factors like aerial flight regulations and cost, satellite remote sensing is, still, providing cost-effective, geospatial vegetation maps with up to thirty centimetres spatial resolution. At the same time, open data policies both in US and EU and commercial earth observation satellite missions are delivering an unprecedented volume of data with increasing level of detail and accuracy.
In order to operationally exploit these earth observation data for precision agriculture applications, validated processing pipelines should be established in order to interpret the observed reflectance spectra into quantitative information regarding several biophysical and biochemical parameters of crops, varieties and fruits
Crop-based and variety-based data analysis can create valuable validated agricultural maps and products for the implementation of effective management decisions [Urretavizcaya et al., 2014]. In particular, for precision viticulture applications, along with the in-field analysis, the different mapping products (like canopy, vigor, maturity, etc.) must take into account and be optimized according to the variety [Pérez-Lamela et al., 2007, Clavijo et al., 2010, Santesteban et al., 2013, Song et al., 2014].
In this paper, we evaluated multitemporal high spatial and spectral resolution satellite data for selective harvesting in vineyards. From concurrent satellite and field campaigns multi-modal data were acquired during the veraison period of 2013, 2014 and 2015. In particular, i) ground radiance data using a field spectrometer (GER 1500, Spectra Vista Corporation,
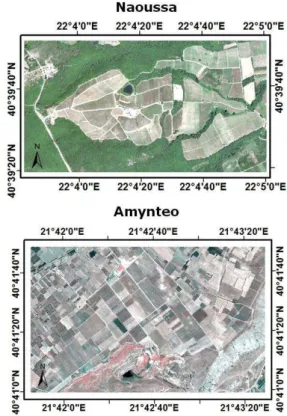
350-1050nm, 512 spectral bands) and ii) WorldView-2 and Pleiades satellite data were acquired along with fruit/grape sampling from different vine varieties in the study areas of Naoussa and Amynteo in Northern Greece. The satellite imagery had a spatial resolution of about 0.5m in the panchromatic band, and about 2m in the 8 multispectral bands which covered the range between 400nm to 1040nm.
Data pre-processing included radiometric correction, atmospheric data correction and image fusion/pan-sharpening. In addition to that, ground reflectance data was calculated from the atmospherically corrected ground radiance. Also, simulated ground radiance and reflectance data, corresponding to the eight WV-2 bands, was computed and employed during the evaluation. Thus, it was made possible to evaluate the relationship between ground data and satellite data, through correlation and linear regression models. Using linear regression models, the spectral signatures computed from satellite data were correlated with the ones computed from the simulated ground data (GER1500).
Furthermore, several (around twenty) vegetation indices were computed, using the atmospherically corrected satellite data. The calculated indices were in general classified into the following five categories: Vegetation (NDVI, MCARI2, MTVI2, etc.), Chlorophyll (Gitelson Chl1-2, etc. ), Carotenoids (Blackburn Car1-2, Gitelson Car1-2), Carotenoid to Chlorophyll Ratio (NPCI, SIPI, etc.), Anthocyanin (Gamon Anth, etc.). Additionally, the green LAI (Leaf Area Index) was computed through a linear relation with the NDVI. Based on the results obtained from the analysis of grape sampling, qualitative biophysical and biochemical parameters (like pH, Brix, total acidity, anthocyanin, etc.) were estimated in certain locations and relationships were established between the remote sensing data. Based on the produced geospatial maps associated The International Archives of the Photogrammetry, Remote Sensing and Spatial Information Sciences, Volume XLI-B8, 2016
with specific biophysical variables, the estimated spatial variability indicated several zones for selective harvesting. In particular, the performed zoning was finally associated with other vine characteristics (like vine variety, etc) and grape quality parameters (like must quality, maturity, etc), towards optimal selective harvesting and viticultural management. The experimental results have been evaluated both quantitatively and qualitatively and appear promising.
2. MATERIALS AND METHODS 2.1 Description of Datasets
The datasets used for this study were multispectral satellite images (Worldview-2, Pleiades) and radiance data acquired with a portable spectroradiometer (GER 1500).
Study area A is located in Western Macedonia, inside the PGI zone Naoussa and more specifically near the Giannakochori village. The altitude of the region is about 200m above sea level. Study area B is located in Western Macedonia, inside the PGI zone Florina near the Amynteo village, at an altitude of about 600 m above sea level.
In particular, the new collections of high resolution satellite data that were employed included:
One WorldView-2 satellite image acquired in 2013 for study area A
One Pleiades satellite image acquired in 2014 for study area B
One WorldView-2 satellite image acquired in 2015 for study area B
Figure 1. The two study areas in Northern Greece, natural color RGB, obtained from the WorldView-2 data used
All of the above images were acquired during the veraison period which was approximately during late July at study area A and during early August at study area B. Concurrently with the satellite image acquisitions, field campaigns were executed in order to collect ground truth spectral radiance data with a spectroradiometer (GER 1500). For each target (canopy of several wine varieties, other crops, soil, etc.), several observations were collected with nadir view in the principal plane.
During the harvesting period the winemakers in both study areas collected grape samples from specific plants or groups of plants. After the laboratory analysis on both grapes and must, several qualitative parameters were calculated including BRIX, Potential Alcohol, pH, Total Acidity, Color Index, Total Phenolic Content, Anthocyanin concentrations and Absorbed Nitrogen.
2.2 Data Pre-processing
Radiometric and atmospheric corrections were performed on the satellite imagery towards the elimination of solar illumination, atmospheric and terrain effects. Digital numbers of relative radiance were converted to absolute radiance using the absolute radiometric calibration factors and effective bandwidths for each band.
2.2.1 Atmospheric Corrections / Reflectance: Atmospheric correction was conducted through ENVI’s (ed. 5.0) Fast Line -of-sight Atmospheric Analysis of Hypercubes (FLAASH). In addition, absolute bi-directional reflectance was obtained using the spectral readings from the portable spectroradiometer, by normalizing the readings with the reference panel. More precisely, bi-directional reflectance was calculated by:
RT= LT/LR∗k (1)
where, RT is the absolute spectral reflectance of the target, LT the radiance of the target, LR the relative irradiance value of the reference panel and k the panel’s reflectance spectrum, as a calibrating factor, measured in the laboratory. The reflectance values for each variety’s canopy were depicted through reflectance charts, within the range of 0 to 1, forming the corresponding spectral signatures.
To validate the relationship between the satellite and in-situ observations, linear regression models were employed, comparing atmospherically corrected satellite data to reflectance ground truth data. The results showed correlation levels of over 90%.
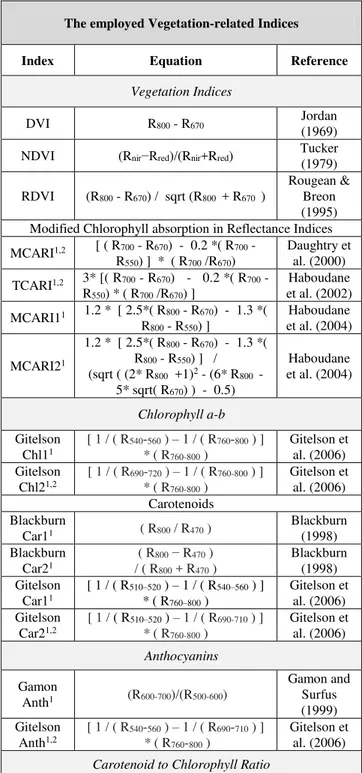
2.2.2 Establishing Correlations between Grape/Must Quality Parameters and Satellite Observations: For the purposes of this study, more than twenty vegetation and pigment indices were computed from the atmospherically corrected satellite data [Johnson et al., 2003, Zarco-Tejada et al., 2005, Meggio et al., 2010]. In Table 2, several of them are presented. However, many of them had been originally proposed and associated with narrow spectral bands and hyperspectral data. Therefore, in such cases the closest multispectral broadband channels were employed. In addition, indices involving wavelengths at the Red-Edge and Coastal areas were not computed for the 2014 dataset (Pleiades), due to unavailability of such multispectral bands
The employed Vegetation-related Indices
Index Equation Reference
Vegetation Indices
DVI R800 - R670 Jordan
(1969)
NDVI (Rnir−Rred)/(Rnir+Rred) Tucker (1979)
RDVI (R800 - R670) / sqrt (R800 + R670 )
Rougean & Breon (1995) Modified Chlorophyll absorption in Reflectance Indices
MCARI1,2 [ ( R700 - R670) - 0.2 *( R700 - R550) ] * ( R700 /R670)
Daughtry et al. (2000)
TCARI1,2 3* [( R700 - R670) - 0.2 *( R700 - R550) * ( R700 /R670) ]
Haboudane et al. (2002)
MCARI11 1.2 * [ 2.5*( R800 - R670) - 1.3 *( R800 - R550) ]
Haboudane et al. (2004)
MCARI21
1.2 * [ 2.5*( R800 - R670) - 1.3 *( R800 - R550) ] / (sqrt ( (2* R800 +1)2 - (6* R800 -
5* sqrt( R670) ) - 0.5)
Haboudane et al. (2004)
Chlorophyll a-b
Gitelson Chl11
[ 1 / ( R540-560 ) – 1 / ( R760-800 ) ]
* ( R760-800 )
Gitelson et al. (2006) Gitelson
Chl21,2
[ 1 / ( R690-720 ) – 1 / ( R760-800 ) ]
* ( R760-800 )
Gitelson et al. (2006) Carotenoids
Blackburn
Car11 ( R800 / R470 )
Blackburn (1998) Blackburn
Car21
( R800 − R470 )
/ ( R800 + R470 )
Blackburn (1998) Gitelson
Car11
[ 1 / ( R510–520 ) – 1 / ( R540–560 ) ] * ( R760–800 )
Gitelson et al. (2006) Gitelson
Car21,2
[ 1 / ( R510–520 ) – 1 / ( R690-710 ) ]
* ( R760-800 )
Gitelson et al. (2006)
Anthocyanins
Gamon
Anth1 (R600-700)/(R500-600)
Gamon and Surfus (1999) Gitelson
Anth1,2
[ 1 / ( R540-560 ) – 1 / ( R690-710 ) ]
* ( R760-800 )
Gitelson et al. (2006)
Carotenoid to Chlorophyll Ratio
CTR11,2 R
695 /R420 Carter
(1996)
NPCI1,2 (R680 - R430 ) / (R680+ R430)
Penuelas et al. (1994)
SRPI1,2 R
430 /R680 Peñuelas et
al. (1995)
SIPI1,2 (R800 - R445 ) / (R800+ R650)
Peñuelas et al. (1995)
1 although this is a narrow band index from the literature, during our
experiments the closest broadband spectral bands from the available satellites were employed for its calculation.
2 not calculated for the 2014 dataset due to unavailability of Coastal and
Red-Edge Bands
Table 1. The spectral indices that were employed during the regression experiments
In order to establish correlations between must quality parameters and multispectral reflectance data, simple linear regression models were employed. Pixel samples were collected at the particular coordinates of the in-situ grape sampling locations.
It should be noted that each variety was studied separately and results mainly for the varieties Syrah and Xinomavro are discussed here.
A set of semi-automatic MATLAB functions was developed, towards the automation of the linear regression procedure among numerous samples, indices, years and must quality parameters.
3. EXPEREMENTAL RESULTS AND VALDIATION In this section, some indicative results are showcased to support the correlation of certain biophysical/biochemical parameters of grape/must/wine with certain indices.
3.1 Estimating Brix levels for Syrah in all study areas In Table 2, r2 results are presented, regarding the comparison between the top two scoring indices and BRIX data for each of the three datasets. Taking into account the band wavelengths used to compute these indices, the following outcomes are highlighted:
1. Highest correlation rates were established in all cases where both Coastal(425 ± 25nm) and Red(R660 ± 30 nm) spectral bands were involved.
2. In the case of the 2014 dataset (Pleiades), where a Coastal band was not available, a combination between NIR(R850 ± 100 nm) and Red(R660 ± 60 nm) bands delivered the highest rates. Indicatively, BRIX-DVI comparison can be observed in Figure 2.
3. NIR1 (R830 ± 60 nm) and Red (R660 ± 30 nm) spectral bands, under several combinations (indices), delivered high correlation rates also in the cases of 2013 and 2015 datasets (WV2). However, indices involving Coastal (425 ± 25nm) provided slightly better results.
Figure 2. BRIX – DVI comparison provided the best correlation results for the 2014 dataset
Multitemporal estimating of Brix levels
2013 2014 2015
Naoussa Amynteo Amynteo
Index r2 Index r2 Index r2
NPCI 60.0% DVI 76.7% CTR1 70.4%
SRPI 58.3% MCARI1 71.3% SIPI 61.9% Table 2. The highest correlation rates regarding the estimation
of Brix level for Syrah vineyards
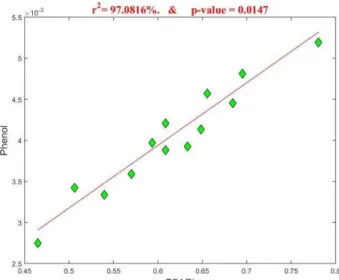
3.2 Estimating Total Phenolic Content for Syrah in 2013 The resulting correlations between certain indices and the Total Phenolic Content reference data for 2013 are presented in Table 3. The top five indices with the higher r2 were the TCARI, Gitelson Chl2, and NDVI/RDVI/DVI. The overall analysis regarding the spectral band wavelengths involved in these indices resulted into the following insights:
1. Highest correlation rates were established when all three of the RedEdge(R725 ± 20 nm)Red (R660 ± 30 nm) and Green
(R545 ± 35 nm) spectral bands were involved.
2. The RedEdge(R725 ± 20 nm) spectral band was included in the two models with the highest r2 scores.
3. Involvement of the NIR1 (R830 ± 60 nm) band appears to hinder the correlations.
Total Phenolic Contentfor Syrah in 2013
Index involved spectral bands r2
TCARI
R725 ± 20 nm
R660 ± 30 nm
R545 ± 35 nm
97.1%
Gitelson Chl2 RR725 ± 20830 ± 60 nm
nm 63.8%
DVI R660 ± 30 nmR830 ± 60 nm 56.5%
RDVI R830 ± 60 nm
R660 ± 30 nm 56.4%
NDVI R660 ± 30 nmR830 ± 60 nm 55.2%
Table 3. The highest correlation rates regarding the estimation of Total Phenolic Content for Syrah vineyards in 2013
3.3 Estimating Brix to Total Acidity ratio levels for Syrah in 2014
In Table 4, r2 results for the comparison between the top five scoring indices and BRIX to Total Acidity ratio are presented. This ratio is an indicator of maturity employed widely by winemakers. The following remarks can be highlighted after a comparative analysis:
1. Highest correlation rates were established with indices involving NIR(R850 ± 100 nm) and Green(R550 ± 60 nm) spectral bands.
2. NIR(R850 ± 100 nm) was included in all models with the highest r2 scores. Thus, the NIR band seems to be the one strongly correlated with the Brix to Total Acidity ratio, and the other ones contribute by adjusting any canopy, soil properties.
Figure 3. The highest correlation rate for 2013 was established with the TCARI for estimation of the Total Phenolic Content
3. Along with the NIR1 (R850 ± 100 nm), Red and Blue spectral bands also delivered high correlation rates
4. Vegetation indices DVI/RDVI and MCARI1 also delivered high correlation values between 74% and 78%
5. DVI performs marginally better (~2%) than in the corresponding for 2014 BRIX estimation (Table 2). This is expected as BRIX and Total Acidity are usually inversely correlated. However, a further analysis indicated that inclusion of the Green band and exclusion of the Red band can optimize Total Acidity comparisons. Regression results between Total Acidity and indices involving the Green but not the Red bands scored higher. In Figure 5, the corresponding regression regarding the highest score of these experiments (Gitelson Chl1) is presented.
BRIX / (Total Acidity) levels for Syrah in 2014
Index involved spectral bands r2
Gitelson Chl1 R850 ± 100 nm
R550 ± 60 nm 81.2%
Blackburn Car1 R850 ± 100 nm
R490 ± 60 nm 78.3%
DVI R850 ± 100 nm
R660 ± 60 nm 78.3%
Blackburn Car2 R850 ± 100 nm
R490 ± 60 nm 76.3%
RDVI R850 ± 100 nm
R660 ± 60 nm 76.2%
MCARI1
R850 ± 100 nm
R660 ± 60 nm R550 ± 60 nm
74.3%
Table 4. The highest correlation rates regarding the estimation of Brix-to-TA levels for Syrah in 2014
Figure 4. The highest correlation rate for the estimation of Brix-to-TA levels for the 2014 dataset was established with the
Gitelson_Chl1 index
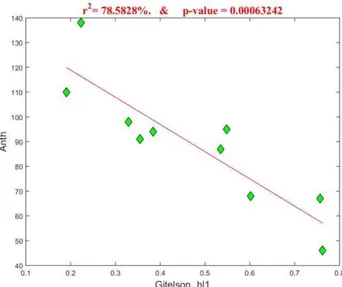
3.4 Estimating Anthocyanin levels for Syrah in 2015 The regression results between indices and Anthocyanin levels for 2015 are presented in Table 3. The top scoring band combinations were pigment indices e.g., Gitelson Chl1/Chl2, Blackburn Car1/Car2 and Gitelson Anth, proposed by Gitelson et al. (2006) specifically for the estimation of Anthocyanin levels. Also MCARI2, involving the same spectral bands as Gitelson Anth, provided high results.
1. Highest correlation rates were established with indices involving the NIR1 (R830 ± 60 nm) spectral band in combination with the RedEdge (R725 ± 20 nm) or Green
(R550 ± 60 nm) bands (Gitelson Chl2, Gitelson Chl1).
2. The top four indices were computed using two or three of the spectral bands mentioned above.
3. The NIR1(R830 ± 60 nm) spectral band appears in all of the top six scoring indices.
4. Use of the Blue (R480 ± 30 nm) spectral band provides acceptable, though slightly worse, results. Thus, NIR1(R830 ± 60 nm) seems to be very strongly correlated with Anthocyanin levels.
Anthocyanin levels for Syrah in 2015
Index involved spectral bands r2
Gitelson Chl2 RR725 ± 20830 ± 60 nm
nm 78.6%
Gitelson Chl1 R830 ± 60 nm
R545 ± 35 nm 78.6%
Gitelson Anth
R830 ± 60 nm
R725 ± 20 nm
R545 ± 35 nm
78.1%
MCARI2
R830 ± 60 nm
R725 ± 20 nm
R545 ± 35 nm
76.7%
Blackburn Car1 Blackburn Car2
R830 ± 60 nm
R480 ± 30 nm 75.3%
Table 5. The highest correlation rates regarding the estimation of Anthocyanin levels for Syrah in 2015
Figure 5. The highest correlation rate for the estimation of Total Acidity levels for the 2014 dataset was established with the
Gitelson_Chl1 index
Figure 6. The highest correlation rate for the estimation of Anthocyanin levels for the 2015 dataset in Amynteo was established with the Gitelson_Chl2 and Gitelson_Chl1 indices.
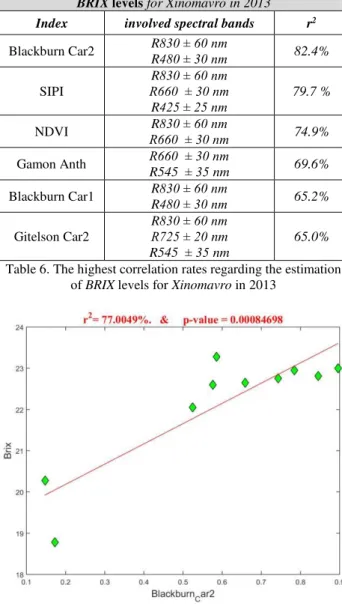
3.5 Estimating BRIX levels for Xinomavro in 2013
In Table 6, the calculated r2 are presented for the correlation between certain band combinations and the reference BRIX data for the Greek red variety Xinomavro (with a WorldView 2 image acquired in 2013 at the Naoussa study area). Taking into account the sensitivity of the dominant spectral bands the following points can be underlined:
1. The highest correlation rates were established with an index involving the Blue (425 ± 25nm) and NIR1 (R830 ± 60 nm) spectral bands.
2. In a similar way as for the Syrah variety and results, the SIPI index involving the NIR1 (R830 ± 60 nm), Coastal (425 ± 25nm) and Red(R660 ± 30 nm) spectral bands also provides very high r2 scores.
3. Compared to the analysis of BRIX results (subsection 3.1), it is observed that, in the case of Syrah the correlation between BRIX and NIR1 (R830 ± 60 nm) is negative but in the case of Xinomavro it is positive.
4. The Normalized Difference between Blue(425 ± 25nm) and NIR1 (R830 ± 60 nm) (Blackburn Car2), results in a much better score than the simple ratio of those bands (Blackburn Car1).
5. Involvement of the Green (R550 ± 60 nm) spectral band, seems to provide worse correlations.
BRIX levels for Xinomavro in 2013
Index involved spectral bands r2
Blackburn Car2 R830 ± 60 nm
R480 ± 30 nm 82.4%
SIPI
R830 ± 60 nm
R660 ± 30 nm
R425 ± 25 nm
79.7 %
NDVI R660 ± 30 nmR830 ± 60 nm 74.9%
Gamon Anth R660 ± 30 nm
R545 ± 35 nm 69.6%
Blackburn Car1 R830 ± 60 nm
R480 ± 30 nm 65.2%
Gitelson Car2
R830 ± 60 nm
R725 ± 20 nm
R545 ± 35 nm
65.0%
Table 6. The highest correlation rates regarding the estimation of BRIX levels for Xinomavro in 2013
Figure 7. The highest correlation rate for the estimation of BRIX levels for the 2013 dataset in Naoussa was established with the
Blackburn Car2 index.
4. DISCUSSION
Estimation of BRIX, can be achieved with standard multispectral bands (Red, Blue, and NIR). However, the involvement of Coastal wavelengths can further improve results. Wavelengths in the Green area of the spectrum, had a minor yet significant impact on the results.
WorldView-2 satellite imagery can provide high spatial resolution data and six spectral bands that are quite useful for vineyard management, (Bands: 1-3, 5-7). The RedEdge and Coastal wavelengths, in particular, provide additional observations for the efficient estimation of grape/must/wine biophysical and biochemical properties. On the contrary, the Yellow and NIR2 spectral bands, did not significantly contribute to the results, but may be useful to study different periods of the growing season (e.g. pre-pruning).
The quantitative results regarding the correlations are promising and if one considers the already validated results regarding the correlation with canopy greenness maps (e.g., Leaf Area Index) [Johnson et al., 2003, Kalisperakis et al., 2015, Karantzalos et al., 2015] then multitemporal (dense during the season) monitoring can deliver further insights regarding the relationships between reflectance spectra at particular spatial resolution and spectral sensitivity. This can be achieved by consistent image acquisitions of several areas over a larger timeframe and increased grape/must analysis sampling over that period.
ACKNOWLEDGEMENTS
We would like to thank the wineries Alpha-Estate and Kir-Yianni for their significant cooperation as well as George Makris for his support, George Kotseridis and Evangelia Amanatidi for their contribution on the oenological part of the study. Totalview, European Space Imaging, Terra Spatium and Airbus Defence and Space for providing the satellite data.
REFERENCES
Carter, G. A. (1994). Ratios of leaf reflectances in narrow wavebands as indicators of plant stress. International Journal of Remote Sensing, 15, 697−704.
Clavijo, A., Calderón, I.L. & Paneque, P. (2010). Diversity of Saccharomyces and non-Saccharomyces yeasts in three red grape varieties cultured in the Serranía de Ronda (Spain) vine -growing region. International Journal of Food Microbiology, 143(3), 241-245.
Daughtry, C. S. T., Walthall, C. L., Kim, M. S., Brown de Colstoun, E., & McMurtrey III, J. E. (2000). Estimating corn leaf chlorophyll concentration from leaf and canopy reflectance. Remote Sens. Environ., 74, 229– 239.
Gamon, J. A., & Surfus, J. S. (1999). Assessing leaf pigment content and activity with a reflectometer. New Phytologist, 143, 105−117.
Gitelson, A. A., Keydan, G. P., & Merzlyak, M. N. (2006). Three-band model for noninvasive estimation of chlorophyll, carotenoids, and anthocyanin content in higher plant leaves. Geophysical Research Letters, 33, L11402, doi: 10.1029/2006 GL026457.
Haboudane, D., Miller, J. R., Tremblay, N., Zarco-Tejada, P. J., & Dextraze, L. (2002). Integration of hyperspectral vegetation indices for prediction of crop chlorophyll content for application to precision agriculture. Remote Sensing of Environment, 81(2– 3), 416–426.
Haboudane, D., Miller, J.R., Pattey, E., Zarco-Tejada, P.J., Strachan, I.B. 2004. Hyperspectral Vegetation indices and novel The International Archives of the Photogrammetry, Remote Sensing and Spatial Information Sciences, Volume XLI-B8, 2016
algorithms for predicting green LAI of crop canopies: Modeling and validation in the context of precision agriculture. Remote Sensing of Environment 90 337-352.
Johnson, L.F., Roczen, D.E., Youkhana, S.K., Nemani, R.R. , Bosch, D.F. 2003. Mapping vineyard leaf area with multispectral satellite imagery. Computers and Electronics in Agriculture 38 33/44.
Jordan, C. F. (1969). Derivation of leaf area index from quality of light on the forest floor. Ecology, 50, 663–666.
Kalisperakis I., Ch. Stentoumis, L. Grammatikopoulos, and K. Karantzalos, 2015. Leaf area index estimation in vineyards from UAV hyperspectral data, 2D image mosaics and 3D canopy surface models, ISPRS International Conference on Unmanned Aerial Vehicles in Geomatics, ISPRS UAV-g2015 (Volume XL-1/W4), pp.299-303.
Karantzalos K., Karmas A., Tzotsos, A., 2015, RemoteAgri: Processing Online Big Earth Observation Data for Precision Agriculture, 10th European Conference on Precision Agriculture, pp.421-428, doi: http://dx.doi.org/10.3920/978-90-8686-814-8_52.
Meggio, F., Zarco-Tejada, P.J., Nunez, L.C., Sepulcre-Canto, G., Gonzalez, M.R., Martin, P. 2010. Grape quality assessment in vineyards affected by iron deficiency chlorosis using narrow-band physiological remote sensing indices. Remote Sensing of Environment 114 1968-1986.
Peñuelas, J., Baret, F., & Filella, I. (1995). Semi-empirical indices to assess carotenoids/chlorophyll a ratio from leaf spectral reflectance. Photosynthetica, 31, 221−230.
Pérez-Lamela C., García-Falcón, M.S., Simal-Gándara, J. & Orriols-Fernández, I. (2007). Influence of grape variety, vine system and enological treatments on the colour stability of young red wines. Food Chemistry, 101( 2),601-606.
Rougean, J. -L., & Breon, F. M. (1995). Estimating PAR absorbed by vegetation from bidirectional reflectance measurements. Remote Sensing of Environment, 51, 375–384.
Santesteban, L.G., Guillaume, S., Royo, J.B. & Tisseyre, B. (2013). Are precision agriculture tools and methods relevant at the whole-vineyard scale?. Precision Agriculture,14(1), 2-17.
Song, J., Smart, R.E., Dambergs, R.G., Sparrow, A.M., Wells R.B., et al. (2014). Pinot Noir wine composition from different vine vigour zones classified by remote imaging technology. Food Chemistry, 153, 52-59.
Urretavizcaya, I., Santesteban, L.G., Tisseyre, B., Guillaume, S., Miranda, C. & Royo, J.B. (2014). Oenological significance of vineyard management zones delineated using early grape sampling. Precision Agriculture, 15(1), 111-129.
Zarco-Tejada, P.J., Berjon, A., Lopez-Lozano, R., Miller, J.R.,
Martin, P., Cachorro, V., Gonzalez, M.R., de Frutos, A. 2005. Assessing vineyard condition with hyperspectral indices:
Leaf and canopy reflectance simulation in a row-structured discontinuous canopy. Remote Sensing of
Environment 99 271-287.