Annales
Geophysicae
Electromagnetic waves and bursty electron acceleration:
implications from Freja
L. Andersson1,4, J.-E. Wahlund2, J. Clemmons3, B. Gustavsson1, and L. Eliasson1
1Swedish Institute of Space Physics, Kiruna, Sweden 2Swedish Institute of Space Physics, Uppsala, Sweden 3NASA Goddard Space Flight Center, Greenbelt, USA
4Now at Laboratory of Atmospheric and Space Physics, University of Colorado, USA
Received: 16 November 2000 – Revised: 2 July 2001 – Accepted: 9 July 2001
Abstract. Dispersive Alfv´en wave activity is identified in four dayside auroral oval events measured by the Freja satel-lite. The events are characterized by ion injection, bursty electron precipitation below about 1 keV, transverse ion heat-ing and broadband extremely low frequency (ELF) emissions below the lower hybrid cutoff frequency (a few kHz). Large-scale density depletions/cavities, as determined by the Lang-muir probe measurements, and strong electrostatic emissions are often observed simultaneously. A correlation study has been carried out between the E and B field fluctuations below 64 Hz and 10 Hz, respectively, (the DC instruments upper threshold) and the characteristics of the precipitating electrons. This study revealed that the energisation of elec-trons is indeed related to the broadband ELF emissions and that the electrostatic component plays a predominant role during very active magnetospheric conditions. Furthermore, the effect of the ELF electromagnetic emissions on the larger scale field-aligned current systems has been investigated, and it is found that such an effect cannot be detected. Instead, the Alfv´enic activity creates a local region of field-aligned cur-rents. It is suggested that dispersive Alfv´en waves set up these local field-aligned current regions and, in turn, trig-ger more electrostatic emissions during certain conditions. In these regions, ions are transversely heated, and large-scale density depletions/cavities may be created during especially active periods.
Key words. Ionosphere (particle acceleraton; wave-particle interactions) Magnetospheric physics (auroral phenomena)
1 Introduction
An Alfv´en wave propagating from the magnetosphere to-wards the ionosphere will encounter a denser plasma and as a result, may change its characteristics. For instance, the Alfv´en wave may be reflected (e.g. Haerendel, 1983;
Knud-Correspondence to:L. Andersson ([email protected])
sen et al., 1990, 1992), dissipated (e.g. Clark and Seyler, 1999; Goertz, 1984), or broken down into other wave modes (e.g. Seyler et al., 1998). A dispersive Alfv´en wave (DAW) (e.g. Lysak and Lotko, 1996; Stasiewicz et al., 2000, and ref-erences therein) may, therefore, enhance both its inertial and kinetic characteristics, and develop a field-aligned electric field in the wave front when it propagates at a small angle to the Earth’s magnetic field. These Alfv´en waves are, there-fore, often suggested as candidates for auroral zone field-aligned electron acceleration processes.
The low frequency part of the broadband extremely low frequency (ELF) emissions observed by spacecraft in the au-roral zone is often considered to be Alfv´enic in nature, with perpendicular wavelengths of the order of the electron in-ertial length (λe) (e.g. Chmyrev et al., 1989; Louarn et al., 1994; Wahlund et al., 1994; Seyler et al., 1995), and to be associated with field-aligned electron bursts at suprather-mal energies (Boehm et al., 1990; Knudsen and Wahlund, 1998; Wahlund et al., 1998; Chaston et al., 1999; Lynch et al., 1999; Ivchenko et al., 1999). This wave activity is also connected with transverse heating of ions (Knudsen and Wahlund, 1998; Knudsen et al., 1998) and might cause large-scale density depletions.
The field-aligned currents moving into and out from the ionosphere are often described as being closed within the ionosphere. The conductivity in the ionosphere is in this sce-nario connected to the strength of the field-aligned current and, hence, the particle acceleration. When a widespread region of DAW activity exists, this scenario will change to a local region of very strongly fluctuating field-aligned cur-rents of several 100µA/m2with a rather weak contribution to the overall large-scale current systems.
as those associated with field-aligned electron bursts, trans-verse ion heating, field-aligned current systems and the ap-pearance of large-scale plasma density depletions/cavities, are discussed in terms of a DAW model. In Sects. 1 and 2 the characteristics of four Freja passages through the dayside auroral region are presented and discussed. In Sect. 3, a de-tailed study of the ELF emissions below 64 Hz is presented and discussed in terms of a DAW model. In Sect. 4, the ex-pected field-aligned electric fields and propagation angles are derived from the electric and magnetic field measurements under the assumption that they are produced by dispersive Alfv´en waves. In addition, the DAW associated field-aligned currents are investigated with regard to the effect on field-aligned current systems. A correlation study between the electric and magnetic ELF fields and field-aligned electron burst characteristics is described. The correlation with the DC electric field and DC magnetic field is made to 64 and 10 Hz, respectively, due to the instruments thresholds. Fi-nally, we make some concluding remarks regarding the over-all interpretation of the observed processes in terms of wave-particle interactions caused by dispersive Alfv´en waves.
2 The Freja instrumentation and orbit characteristics
The Swedish/German satellite Freja passes the northern au-roral region at an altitude of about 1700 km and at an inclina-tion of 63◦. It is a sun-pointing spacecraft with a spin period of 6 s. Detailed information about the Freja experiments can be found in a special Freja issue ofSpace Science Reviews
(see Boehm et al., 1994; Eliasson et al., 1994; Holback at al., 1994; Marklund et al., 1994). Relevant experimental infor-mation for this study is discussed where necessary.
3 General characteristics of the four Freja auroral oval crossings
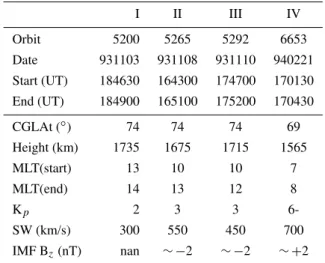
Data are presented from four Freja satellite passages through the dayside auroral region during ion injection events in Table 1. For convenience, these orbits are referred to as
I, I I, I I I, and I V, respectively, corresponding to actual orbits 5200 (3 November 1993), 5265 (8 November 1993), 5292 (10 November 1993), and 6653 (21 February 1994). A short description of the general observational characteristics is given here, and more detailed information regarding these particular data can be found in Andersson et al. (2001).
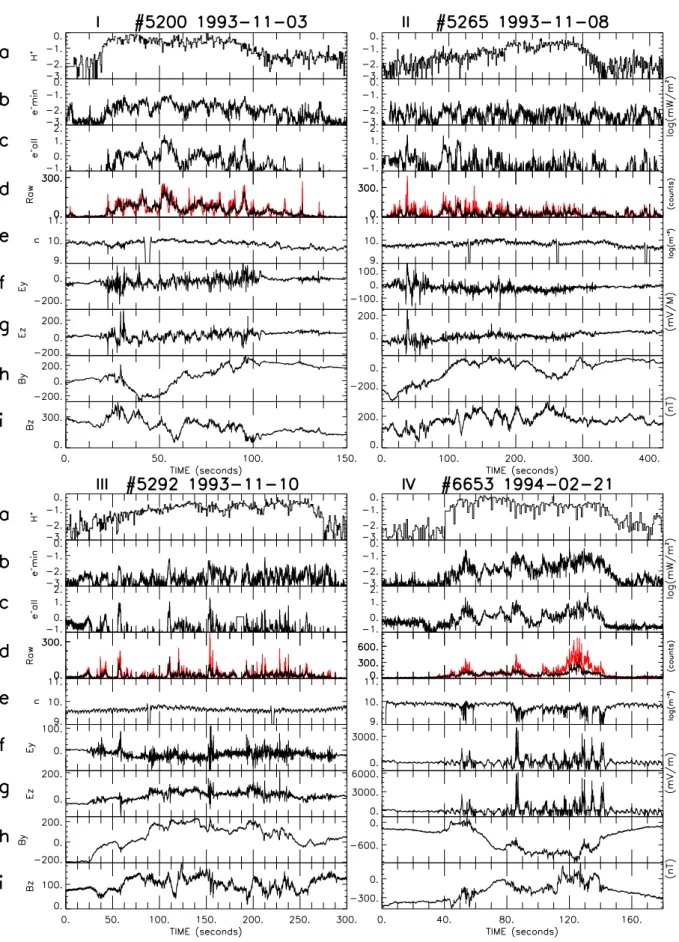
Figure 1 displays the overview of particle and wave data from all four orbits, and Fig. 2 shows the corresponding en-ergy densities, as well as the DC electric and magnetic field waveforms.
3.1 Ion injection and heating
All four orbits are characterized by clear ion injections with energies from 500 eV up to the TICS instrument threshold of 4.3 keV (Fig. 1, panel b). The downward proton energy flux
Table 1.Time, location and solar wind
I II III IV Orbit 5200 5265 5292 6653 Date 931103 931108 931110 940221 Start (UT) 184630 164300 174700 170130 End (UT) 184900 165100 175200 170430 CGLAt (◦) 74 74 74 69 Height (km) 1735 1675 1715 1565 MLT(start) 13 10 10 7 MLT(end) 14 13 12 8
Kp 2 3 3
6-SW (km/s) 300 550 450 700 IMF Bz(nT) nan ∼ −2 ∼ −2 ∼ +2
The values in the table are given for the middle point of the ion injection (if not else stated). For all orbits the satellite moved from dawn to dusk.
(Fig. 2, panel a) is calculated by integrating over all TICS en-ergies from 50 eV to 4.3 keV and over pitch-angles between 0◦ and 90◦. The time resolution of this calculated ion en-ergy flux is 400 ms. Occasionally, these fluxes are somewhat spin modulated due to limitations in pitch-angle coverage. Downward ion energy fluxes of 0.01–1 mW/m2exist during
the observed ion injections. The ion injections are accompa-nied by bursty electron precipitation, transverse ion heating as well as broadband ELF emissions up to the lower hybrid cutoff frequency (Fig. 1). Large-scale density depletions, as measured by the Langmuir probe, are only detected during the most active orbit, I V (Fig. 2, panel e). Intense trans-verse ion heating (primarily O+) is only encountered in orbit
I V, for which it reaches energies of up to∼400 eV, while the ion heating during the other three orbits reaches at most ∼50 eV. The spin modulated signature at low energies, pri-marily in the oxygen channel, is the RAM flux, as seen in Fig. 1, panel (a). On top of the RAM, the ion heating can be seen.
3.2 Electron precipitation characteristics
The electron bursts have downward energy fluxes (calculated from pitch-angles 0◦–90◦) of the order of 0.01–10 mW/m2
(Fig. 2, panels b and c), with the most intense events en-countered in orbitI V. Panel (b) contains TESP data in the lower energy range of, 12–50 eV, which represents electrons moving with velocities below the local Alfv´en velocity (vA). Panel (c) includes almost the full energy range of the TESP instrument (36 eV–25 keV). The time resolution of the elec-tron measurements is 62.5 ms.
FREJA #5292 1993-11-10 1000 [eV] 100 10 1000 100 10 [eV] [eV] 10000 1000 100 10 10 10 10 10 10 10 10 10 9 8 6 7 11 9 10
(eV/cm s eV str)
2 [Hz] 1000 100 10 [eV] 1000 100 10 [eV] 10000 1000 100 [eV] [Hz] 6 7 8 9 10 10 11 10 10 10 10 10 10 10
(eV/cm s eV str)
2
FREJA #5265 1993-11-08
80-90
FREJA #5200 1993-11-03
0 50 100 150
10000 1000 10 5 6 10 [Hz] 10000 1000 50 0 -50 [nT] Oxygen Proton Electron E-field B-field E-field B-field 6 8 10 10 10
(eV/cm s eV str)
2
10
[(mV/m) /Hz]
[(nT) /Hz]
2
2
[(mV/m) /Hz]
2 0 -2 -4 -6 0 -2 -4 -6 -3 -5 -7 50 0 -50
0 100 200 300 400
FREJA #6653 1994-02-21
50 100 150 200
0 250 300
Oxygen Proton Electron [Hz] [Hz] 10000 1000 10 5 6 10 [Hz] 10000 1000 50 0 -50 [nT] E-field B-field E-field B-field 6 8 10 10 10
(eV/cm s eV str)
2
10
[(mV/m) /Hz]
[(nT) /Hz]
2
2
[(mV/m) /Hz]
2 0 -2 -4 -6 0 -2 -4 -6 -3 -5 -7
0 40 80 120 160
100 0 -100 I II III IV Time (seconds)
a
b
c
d
e
f
g
a
b
c
d
e
f
g
0-90 0-90 0-10 0-90 0-90 0-10 0-90 0-90 0-10 0-90 0-90 0-10 [PSD(log)] [PSD(log)]the bursts of electrons, the 0◦ pitch-angle fluxes are much higher. In orbitIone sector which measures the field-aligned electron flux has a lower sensitivity; this leads to a spin mod-ulated signal and the field-align burst is not clearly shown. In orbitsI I andI I I, bursts appear more sporadically, while in orbitI V, the electron bursts occur more frequently in time. 3.3 Cold plasma characteristics
A set of spherical Langmuir probes continuously samples the current from the plasma at a fixed positive bias voltage. This current is proportional tone∗√Te, whereneandTe are the electron density and temperature. Usually the variation in the electron temperature is small and slow, and the Lang-muir probe current variation is assumed to be solely due to plasma density variations. When possible, we have used the narrow band HF Langmuir emissions near the plasma fre-quency,ωpe, as well as the intermittent Langmuir probe bias voltage sweeps to confirm that the sampled probe current is primarily due to the variations inne, even though a variation inTemay account for a current decrease by up to a factor of 2 during active periods.
The regularly measured probe sweeps are seen as drop-outs in Fig. 2 (panel e). In Table 2, measurements from the analyzed probe sweeps, such as the plasma temperatures (Ti,
Te) and the temperature ratios (Ti/Te), are presented together
with some useful calculated plasma characteristics. As men-tioned above, the ion heating is weak during orbitsI I and
I I I, somewhat stronger in orbitI and intense in orbitI V. It should be noted that it is the whole bulk ion population that is heated, not just the energetic tail of the ion distribution.
During orbitI V, several density drops (Fig. 2, panel e) are observed simultaneously with ion injection (panel a) and high electron count rates in the field-aligned direction, as compared to count rates at other pitch-angles (panel d). The four largest density drops (hereafter referred to as cavities) are centered around +53, +88,+130 and+141 s into the plot. The highest electron count rates (120–130 s) have their main contribution from the lowest energies below 50 eV. 3.4 Electromagnetic fields and wave characteristics It is clearly seen from Fig. 1 (AC-measurements, panels e and f) that the broadband ELF emissions can reach frequen-cies above 1 kHz and in some cases up to 6 kHz, which is close to the lower hybrid cutoff. It can also be seen that the emissions become increasingly electrostatic towards higher frequencies, while the magnetic component becomes dom-inant at the lowest frequencies (see panels f and g, for AC magnetic field measurements). See Wahlund et al. (1998) for further details regarding the broadband ELF emissions. This study concentrates more on the lower frequency, and the more electromagnetic part of the ELF spectrum and its rela-tionship to electron bursts, dayside ion injections and density depletions.
The DC electric and magnetic field instruments were op-erated somewhat differently during the four selected
or-bits. The DC electric field measurements normally make use of two orthogonally positioned spherical probe pairs on 10.5 m long wire booms in the spin plane (i.e. 21 m between spheres). However, during orbitI V, one of the probe pairs was operated in a current collection mode allowing forδn/n
interferometry measurements, and as a consequence, only one probe pair measures the DC electric field on this orbit. This explains why the electric field on orbitI V (Fig. 2, DC-measurements, panels f and g) is spin modulated. The sam-pling rates for orbits I,I I andI I I are 768 samples/s for the DC electric field, and 128 samples/s for the DC magnetic field. On orbitI V, the DC electric field was sampled at 1536 samples/s and the DC magnetic field at 256 samples/s.
The DC electric and magnetic field measurements have been de-spun and are presented in a coordinate system for which thex-axis is along a model magnetic field line, posi-tivey points towards east, and positivezpoints towards the equator. The Freja satellite measures the electric field in the spin plane of the spacecraft and, therefore, only gives a 2-dimensional estimate of the total electric field. Therefore, we assume that the magnetic field-aligned component (Ex) is zero. The assumption should be good since the field-aligned electric field component of a dispersive Alfv´en wave is the-oretically much smaller than the perpendicular electric field component.
The electric field fluctuations (Fig. 2, panels f to g) are of extremely large amplitude during orbitI V. When the down-ward ion energy flux is close to 1 mW/m2the magnetic field
data show a large gradient, and the electron distribution is isotropic with a loss cone. There is no density gradient, and the DC electric field shows just a spin modulation of about zero. On orbitI I I, downward bursts of electrons are corre-lated with sharp changes in the magnetic field.
4 Detailed study of the ELF emissions below 64 Hz
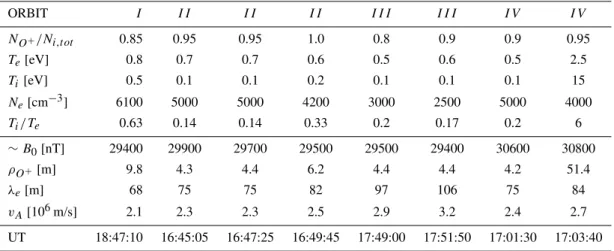
The time series of the DC electric and magnetic field mea-surements were analyzed by an overlapping sliding window Fast Fourier Transform (FFT) analysis (Fig. 3, panels a to e). In order to cover all frequencies below 64 Hz, four different time windows were selected (15, 6, 1, and 0.3 s correspond-ing to the lowest non-DC frequencies of 0.133, 0.333, 2 and 7.1 Hz, respectively). Each time window was weighted with a Hamming filter. The longer time windows are then used at the lower frequencies, while the shorter time windows are used at the higher frequencies in Fig. 3 (panels a to e). The wave spectrograms presented in Fig. 3 have the same ap-parent time resolution as the electron data (TESP, 62.5 ms). This analysis corresponds very much to a wavelet analysis, although it is FFT-based.
4.1 Poynting flux
The wave energy per unit of time and area is represented by the spectral Poynting flux (S(f ) = 1/µ0E(f )×B(f )) in
Table 2.Values from the probe sweeps. Data in the top five rows originate from the evaluation of the probe sweeps. The values in the middle four rows are calculated using the assumption of a 100% oxygen plasma. The last row shows the time of the probe sweeps.
ORBIT I I I I I I I I I I I I I I V I V
NO+/Ni,t ot 0.85 0.95 0.95 1.0 0.8 0.9 0.9 0.95
Te[eV] 0.8 0.7 0.7 0.6 0.5 0.6 0.5 2.5
Ti[eV] 0.5 0.1 0.1 0.2 0.1 0.1 0.1 15
Ne[cm−3] 6100 5000 5000 4200 3000 2500 5000 4000
Ti/Te 0.63 0.14 0.14 0.33 0.2 0.17 0.2 6
∼B0[nT] 29400 29900 29700 29500 29500 29400 30600 30800
ρO+[m] 9.8 4.3 4.4 6.2 4.4 4.4 4.2 51.4
λe[m] 68 75 75 82 97 106 75 84
vA[106m/s] 2.1 2.3 2.3 2.5 2.9 3.2 2.4 2.7
UT 18:47:10 16:45:05 16:47:25 16:49:45 17:49:00 17:51:50 17:01:30 17:03:40
field is calculated from the wave data represented in panels (a) through (e) by
Sx=RE "
1
µ0
(Ey·Bz−Ez·By) #
(1)
for each frequency component. It should be noted that the direction and magnitude of the total Poynting flux when inte-grated over frequency will depend on the frequency window used and their significance is unclear when treating broad-band plasma wave emissions with several possible nonlinear wave modes involved. We do not present the direction of the spectral Poynting flux, only the magnitude| Sx |, since it shows very complex, small-scale variations, more suitable for detailed event studies on the time scale of seconds and is, therefore, left for a future paper. Here, we just note that the spectral Poynting flux is highest at the lowest frequencies, and correlates well with the downward electron energy flux (Fig. 2, panels b to d).
4.2 The Alfv´en velocity and theδE⊥/δB⊥-ratio
Panels (g) and (h) in Fig. 3 display as functions of time the ratio between the electric and magnetic field fluctuations (δE⊥/δB⊥) and the local Alfv´en velocity (vA). The local Alfv´en velocity (vA = B0/√µ0mini) is calculated for four different ion compositions (using a H+and O+mixture with 100%, 88%, 47%, 0% H+composition) and is based on the plasma density estimated from the Langmuir probe measure-ments.
At the lowest displayed frequencies, the ratioδE⊥/δB⊥
is lower thanvA during the three first moderately active or-bits (I,I I andI I I). This suggests that DC-like field-aligned current systems dominate the magnetic field fluctuations be-low about 0.5 Hz. Between 0.5–7 Hz, theδE⊥/δB⊥-ratio in-creases to a more stable plateau value somewhat above the local Alfv´en velocity for a pure oxygen plasma. The drop at
the highest displayed frequencies is probably an instrumen-tal artifact; it might be that the magnetic emissions reach the noise level of the fluxgate magnetometer.
During orbitI V, the whole displayed frequency interval attainsδE⊥/δB⊥-ratios in excess of the local Alfv´en velocity for all possible H+–O+ compositions. The ELF emissions are, therefore, more electrostatic than expected for a classical Alfv´en wave, and inertial and/or kinetic effects are probably important. The large values at the lowest frequencies below 0.5 Hz may just be an effect of the fact that only one probe pair was used for electric field measurements.
4.3 Dispersive Alfv´en Waves (DAW)
The term DAW is a general description covering inertial Alfv´en waves (IAW, Goertz and Boswell, 1979) applica-ble in a plasma with vt h,e = √kBTe/me < vA and
β = 2µ0nekBTe/B02 < me/mi, and kinetic Alfv´en waves (KAW, Stefant, 1970; Hasegawa, 1976), applicable in a plasma withvt h,e > vAandβ > me/mi. The concept orig-inates from a development by Lysak and Lotko (1996), and is described in more detail in a review article by Stasiewicz et al. (2000). The dispersive properties of DAWs become important when the perpendicular wavelength becomes com-parable to the ion gyroradius (ρi) or the electron skin depth
(λe), i.e. when the quantitiesk⊥ρiand/ork⊥λebecome
com-parable to or larger than 1. When this happens parallel elec-tric fields develop which, in turn, can accelerate the electrons. The dispersion relation for a low frequency DAW (ω < ωci) propagating in a cold electron (vt h,e < vA) lowβ plasma can be described as
ω2=kk2v2A 1+k
2
⊥ρi2
1+k2⊥λ2
e
(2)
and the group velocity becomes
∂ω ∂k = ˆx
vA
1+k⊥2λ2
e
1/2 − ˆyωλe
k⊥λe
1+k⊥2λ2
e
TIME
0 150 0 420 0 300 0 180
(seconds) y x z ∆ B y ∆ E z 64 0.1 [Hz] 64 0.1 [Hz] 64 0.1 [Hz] 64 0.1 [Hz] 64 0.1 [Hz] [log(PSD)] -1 0 1 2
[mV/m/(Hz) ]
2
[nT/(Hz) ]
2
λe
k
O 100%
O 0%
E / B
δ δ v A 64 0.1 [Hz] 64 0.1 [Hz] 64 0.1 [Hz] 64 0.1 [Hz] Protons Oxygen [log(m/s)] 8 7 6 5
[log(W/m )]
2 0 2 0 2 -5 -7 64 0.1 [Hz] 64 0.1 [Hz] 64 0.1 [Hz] k -3 -1 [log(m/s)] 6 8 -6 -4 0.0 0.5 1.0 1 3 2 4 [log(rad/m)] [log(m/s)] vg vg /v A [ || || [ [ [ S
Orbit I
Orbit II
Orbit III
Orbit IV
∆ B ∆ B ∆ E
a
b
c
d
e
f
g
h
i
j
k
l
m
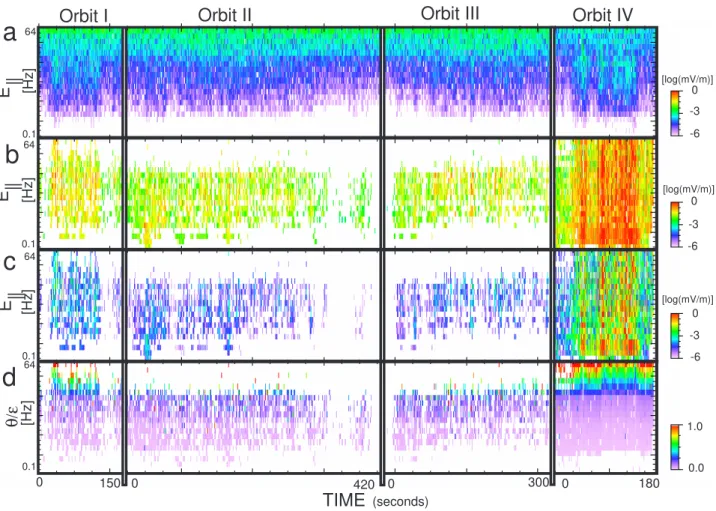
Fig. 3. More detailed ELF wave characteristics for the four orbits presented in Fig. 1. Panels from the top are, respectively; (a) to (e) the power spectral densities (PSDs) for the three magnetic field components and the two perpendicular electric field components; (f) the magnitude of the Poynting flux (S); (g)δE⊥/δB⊥; (h) the Alfv´en speed (vA) for four different plasma compositions; (i) to (j) the value of λek⊥for a pure oxygen and a pure hydrogen plasma respectively; (k) the parallel wave vector (kk); (l) the parallel group velocity of inertial
Alfv´en waves as a fraction of the local Alfv´en speed; (m) the perpendicular group velocity of inertial Alfv´en waves. See the text for more details.
Solving the dispersion relation in this cold electron limit gives a ratio of
| EB⊥ ⊥ |=
vA q
1+k2⊥λ2
e
1+k2⊥ρi2
(4)
and the relationship between the field-aligned and the per-pendicular electric field becomes
Ek E⊥ =
kkk⊥λ2e
1+k⊥2λ2
e
. (5)
These relationships do not take into account several possible nonlinear effects that can, for example, steepen the wavefront of a DAW, break the wave into higher frequency components, and enhance the parallel electric field further (e.g. Seyler et al., 1995; Seyler and Wahlund, 1996).
4.4 Inertial term andk⊥
The perpendicular wave vector (k⊥) can be estimated from the Alfv´en speed (vA) and the ratioδE⊥/δB⊥(Eq. 4). From Table 2,ρ2i ≪ λ2e, which is a good approximation except possibly during the active periods on orbitI V. The value of
k⊥λeis presented in Fig. 3 (panels i and j) for pure hydrogen and oxygen plasmas, respectively. It should be noted that only points which satisfyδE⊥/δB⊥> vAfor a pure oxygen plasma are kept in panels (i) through (m), and values below
vAare white in those graphs (Eq. 4).
The maximum possible Doppler shift (broadening) of the perpendicular wave vector (wave fields) due to the motion of the satellite is estimated to bek⊥vsc ∼10–20 Hz for or-bitsI,I I andI I I and 100–200 Hz for orbitI V. Thus, the enhanced ELF wave emissions which occur during orbitI V
may be heavily Doppler broadened (shifted) depending on the exactk-vector distribution.
4.5 Group velocity andkk
From the knowledge ofk⊥, several other characteristics can be estimated: among them, the perpendicular and the paral-lel group velocities (panels l and m), as well as the paralparal-lel wave vector (panel k). These parameters are estimated as-suming a pure oxygen plasma and by usingk⊥ calculated from panel (j). Whilek⊥is independent of frequency, except for frequencies above about 40 Hz during active parts of or-bitI V,kkwill depend on the frequency throughout the DAW dispersion relation. The parallel wavelengths estimated in this way are in the range of 100–1000 km.
The parallel group velocity is close to the Alfv´en speed during orbitsI,I I andI I I, while during orbitI V, the par-allel group velocity becomes a fraction of the Alfv´en speed, which is simply a consequence of the dispersion relation and the larger inertial terms. The perpendicular group velocity remains most of the time below 1 km/s, at least at the lower frequencies.
5 Parallel electric fields
The parallel electric field associated with a DAW can be cal-culated in various ways. We shall adopt three methods and compare the results; one method makes use of the magnetic field measurements, and the other two are calculated based on the perpendicular electric field and the above estimated wave vectors.
The first method (Fig. 4, panel a) is based on the estimated field-aligned current from the magnetic field measurements (δB⊥) along the satellite path (δx =vscδt) through the ap-proximate relationship
δjk= δB⊥ µ0λ⊥ ≈
δB⊥
µ0δx
. (6)
The total field-aligned current fluctuations for orbitI V are displayed in Fig. 5 (panel c). However, for the calculation at hand,δjkwill be treated as frequency dependent through the magnetic field fluctuations. Subsequently, the parallel elec-tric field is calculated from the polarization relation for iner-tial Alfv´en waves (DAW with cold electrons) as
|δEk(f )|=µ02πf λ2e|δjk(f )|. (7) The second method (Fig. 4, panel b) is calculated from the estimated perpendicular electric field (δE⊥) and the propa-gation angle of the DAW through
|δEk(f )|=θ ǫ|δE⊥(f )| (8)
(Seyler et al., 1995). The propagation angle of the DAW can be found from tanθ = kk/ k⊥, and is usually very small (θ < ǫ = √me/mi). When a DAW propagates at larger angles,θ > ǫ, it is known as a slow ion-acoustic (SIA) wave (Seyler and Wahlund, 1996; Seyler et al., 1998; Wahlund et al., 1998; Stasiewicz et al., 2000). The angle of propagation (Fig. 4, panel d) is small for low frequencies. Above the local gyrofrequency for O+(near 30 Hz on orbitI V), the propaga-tion angle reachesǫ, consistent with the proposition that SIA emissions start to dominate the ELF emission characteristics (Wahlund et al., 1998). TheδE⊥/δB⊥ratio for a SIA wave should approach 108−109m/s, which is also consistent with the observed values presented here (Fig. 3, panel g).
The third method (Fig. 4, panel c) of estimatingδEk is based on Eq. (5) above. Parallel electric field strengths of up to 0.1–1 mV/m are inferred from methods 2 and 3 (pan-els b and c) during active times, while significantly lower val-ues are obtained from method 1. The increase at the upper frequencies in panel (a) is the result of the fact that the flux-gate magnetometer reaches the noise level. The orbit IV, els (b) and (c), has the largest parallel electric field. The pan-els (b) and (c) are calculated using the electric and magnetic field measurements while the panel (a) is calculated from the magnetic field measurements.
5.1 Effect on DAW induced field-aligned current systems The total field-aligned current variation is calculated from the fluxgate magnetometer data according to Eq. (6) and dis-played for orbit I V in Fig. 5 (panel c). Values reach up to 400µA/m2. The instrument resolution gives an error of ∼40µA/m2. The largest current fluctuations, which are pri-marily due to the ELF electromagnetic emissions, are de-tected when the Langmuir probe (panel a) detects plasma density depletions/cavities together with enhanced Poynting fluxes (Fig. 3, panel f).
The net integrated current along the satellite path (Jk) is displayed in panel (b). This current gives information on where the large-scale current systems are situated. The net integrated current over a cavity is small, as can be most clearly seen near+53 s,+88 s,+130 s, and+141 s, i.e. the effect of DAW activity is small on the overall field-aligned current system. Instead, the Alfv´enic activity creates a local region of field-aligned currents through the acceleration of the low energy plasma. Field-aligned electrons move down-wards by the parallel electric field and transverse ion heating occurs possibly through intermediate, more electrostatic ELF waves. As a result, the plasma density drops, which causes the increased perpendicular wave vectors and the inertial and kinetic dissipative effects enhancements. A small net field-aligned current will remain due to the accelerated plasma.
A larger integrated current can be found in the time inter-val of 62–82 s (17:02:20 UT–17:02:50 UT), for which only low levels of DAW activity are found; the downward pro-ton energy flux rises to 1 W/m2 (Fig. 1, panel b; Fig. 2,
TIME
0 150 0 420 0 300 0 180
(seconds)
64
0.1
[Hz]
0.1
[Hz]
θ/ε
0.0 1.0 -3
0
[log(mV/m)]
Orbit I
Orbit II
Orbit III
Orbit IV
64 64
0.1 64
0.1
[Hz]
[Hz]
E
||
-6
[log(mV/m)] [log(mV/m)]
-6
-6 -3
-3 0 0
a
b
c
d
E
||
E
||
Fig. 4. The field-aligned electric field as calculated by three different methods are presented in the three top panels (see text for further details), together with the estimated propagation angle of a dispersive Alfv´en wave (last panel). Parallel electric fields of the order of 0.1–1 mV/m are inferred, which can readily accelerate thermal electrons to energies of several 100 eV within fractions of a second. Note the magnetometer noise level above 10 Hz.
with Fig. 1, panel c, and Fig. 2, panel d). Two DAW ac-tive regions are situated at the edges of this region where the precipitating electrons probably give rise to the large inte-grated current by the constant flux of isotropic-with-a-loss-cone electrons. Since the associated field-aligned electric fields in this middle region are probably very small according to commonly used current-voltage relationships (e.g, Knight, 1973), this current, compared to that during strong Alfv´en activity, is not easily cancelled out by the cold dense back-ground plasma.
During periods when the ELF wave activity is enhanced without Langmuir probe detection of plasma density cavities, e.g. during the proton injections on orbitsI,I I, andI I I(not shown) and during the time period of 100–120 s into orbit
I V, there is also almost no net integrated current. This can be interpreted as follows. The Alfv´en waves accelerate particles due to the large inertial and kinetic components and by so doing they try to create a small current. However, since this occurs in a dense background plasma, the current carried by the energetic electrons will quickly be cancelled out.
6 Correlation study
The electromagnetic ELF wave characteristics (wave ampli-tudes andδE⊥/δB⊥) have been correlated with various elec-tron characteristics (energy, spectral shape, downward en-ergy flux), as well as the plasma density for four selected spectral wave emission frequencies between 1–46 Hz. Due to the DC-magnetometer roll off, only frequencies below 10 Hz can be used for the magnetic correlation. The correlations are based on 16 600 points, i.e. the data presented in Fig. 3. 6.1 Particle spectral fits
The electron spectral shape is approximated by an exponen-tial fit to the TESP data and characterized by the two param-etersγ andβaccording to
f0(E, φ)=γ (E)·eβ(E)α, (9) where αrepresents the pitch-angle andf0 is the measured
Fig. 5.The plasma density estimated from the Langmuir probe mea-surements (panel a) together with the estimated field-aligned current density assuming the Freja spacecraft encounters spatial structures (panel c), and the corresponding integrated net current (panel b). Alfv´en wave activity results in localized regions with rather small net integrated currents on top of larger scale current systems. The thick horizontal lines in panels (b) and (c) represent where signifi-cant density drops can be found, panel (a) (note a probe sweep at+0 and+132 seconds). The thin horizontal lines, panel (b), represent where DAW is seen.
the degree to which the electron population was isotropic,
β ∼ 0, or field-aligned, β ≪ 0 (i.e. spectral shape), and parameterγ is the magnitude of the flux in the field-aligned direction. It is not possible to perform a lag correlation (shift in time) between the field fluctuations and various character-istics of the detected particles due to the fact that low fre-quencies correspond to large times, while the bursts occur during much shorter times.
6.2 Column 1: field-aligned count dependence
The results of the parameter fits for an electron energy of 55 eV are compared with the electric field strength (Fig. 6, column 1). Contour lines of the constant density of the points are drawn in the figure in order to better resolve the statistical shape of the correlation. The comparison with the magnetic field strength andδE⊥/δB⊥ have also been made, but not shown.
Both the electric and magnetic field amplitudes, and con-sequently theδE⊥/δB⊥-ratio, correlate positively with the electron flux counts (parameterγ), except for the higher fre-quency channels of the magnetic field fluctuations.
Fig. 6.Correlations between the electrons field fluctuations at 4 se-lected frequencies (1, 5, 14, and 46 Hz) with particle measurements. Four types of correlations are presented; column 1 and 2, the field-aligned electron count rate at 55 eV and the electron spectral shape; column 3 correlates the total downward electron energy flux below 50 eV; column 4 correlates the plasma density with the field fluctu-ations.
6.3 Column 2: electron spectral shape dependence
Electron spectral shape values (|β|) of less than 0.6 should be regarded as representing isotropic electron spectra, while |β|>0.6 indicate more field-aligned populations. The more negative the value; the more field-aligned the spectral shape, Fig. 6, column 2. The more field-aligned electron popula-tions appear when the electric field amplitudes increase. The result is valid for all displayed frequencies.
The electron spectra at the low energy of 55 eV show a better correlation with the amplitude of the waves compared to a higher electron energy (not shown). This is not so sur-prising since the low energy field-aligned electrons are sug-gested to be accelerated more easily by the Alfv´en waves than higher energy electrons (Andersson et al., 2001). In ad-dition, the high energy electrons, which are observed with a broad pitch-angle distribution (low value ofβ), are suggested to arrive before the Alfv´en waves themselves.
6.4 Column 3: Electron energy flux dependence
6.5 Column 4: Plasma density dependence
The correlations of the plasma density with the field ampli-tudes show that high plasma densities (i.e. outside cavities) are not well correlated or show a weak positive dependence with the electromagnetic wave fields. Within plasma cavities, on the other hand, the electric field amplitudes become large and a strong negative dependence can be found for electric field amplitudes above a threshold value. The magnetic field strength hardly correlates with the plasma density at all (not shown), indicating that the magnetic fluctuations are not im-portant for the formation of plasma cavities and that it is the more electrostatic component of the ELF wave activity that is related to the cavity formation. The result here should be treated carefully since the density differences are less than an order of magnitude.
There are two expalnations for the correlation between the large electric field amplitude and the density cavities: the electric field empties the region of particles, thereby creating lower densities or the density cavity trapps the wave which can lead to electric field growth. In Fig. 6, column 4, the strong negative dependence might indicate that the first pro-cess is the most likely one. The good correlation between wave activity and low energy field-aligned electron precip-itation, and the anti-correlation between wave activity and plasma density, has previously been reported by Chaston et al. (1999).
7 Summary and conclusions
In the four analyzed events, wave-particle interactions oc-curred together with intense downward proton injections. The correlation with dayside downward proton injection and wave-particle interactions is frequently seen in both Freja and FAST (Chaston et al., 1999) data. The ion injection can be assumed to be produced by a common process which also creates the Alfv´en wave activity which, in turn, interacts with electrons through its dispersive induced field-aligned elec-tric field in its wave front. Alternatively, an ion injection gives rise to the Alfv´en wave activity which can accelerate the electrons. A scenario can be visualized in which the ratio
Ti/Teplays an important role by becoming large enough so that the Alfv´en wave approaches the electrostatic limit and begins to accelerate more and more electrons and at the same time, transversely heats the bulk ion population and raises theTi/Teratio further (Clark and Seyler, 1999). This posi-tive feedback process then increases the effect of the inertial and kinetic terms further, and more energy dissipation can occur and so on.
The Freja mission was in operation during declining solar activity condition. The presence of Alfv´en waves is identified when theδE⊥/δB⊥ ratio becomes equal to or exceeds the local Alfv´en velocity. The variations in the plasma density, the Earth’s magnetic field strength and the ion composition with geocentric distance cause the Alfv´en speed to have a maximum below 2RE geocentric distance.
During orbit I V (6653), which is an extreme dayside event recorded by the Freja satellite, the largest plasma tem-peratures were encountered and density depletions/cavities were found. In addition, during this orbit, theδE⊥/δB⊥ -ratio became significantly larger than the local Alfv´en speed
(vA) at frequencies above the local oxygen gyro frequency
(about 30 Hz). Furthermore, the largest perpendicular wave vector was found at these larger frequencies, and the wave characteristics became more electrostatic with increasing fre-quency. The data were, therefore, consistent with an interpre-tation in terms of dispersive Alfv´en waves (Lysak and Lotko, 1996), which attain slow ion acoustic characteristics at larger frequencies (e.g. Seyler et al., 1995; Wahlund et al., 1998).
The data presented in this paper support an earlier analy-sis (Chaston et al., 1999) that strong ELF wave activity, es-pecially in the electrostatic limit, is associated with larger scale plasma density depletions/cavities and at the same time, enhances the low-energy electron fluxes along the geomag-netic field lines. The correlation study presented also gives a good correlation between electromagnetic field fluctuations and the presence of accelerated electrons with energies cor-responding to values below the local Alfv´en velocity. Intense electrostatic ELF emissions were found to correlate well with the occurrence of density cavities.
During periods of large plasma densities, broadband ELF wave activity and bursty electrons, the integrated field-aligned net currents were zero or very small. When larger scale density depletions/cavities were detected from the Langmuir probe measurements, the integrated field-aligned net currents became more significant, although they re-mained rather small. The fluctuating field-aligned current densities, however, are large, reaching several 100µA/m2. The largest integrated field-aligned net currents were de-tected in association with periods of low or zero ELF wave activity. These regions have, on both sides, strong disper-sive Alfv´en wave activity. At those times, the fluctuations in the field-aligned current densities were, on the contrary, very low. A possible explanation is that the more isotropic electron energy distribution carries current and does not re-ally affect the local plasma, whereas the large parallel electric fields associated with dispersive Alfv´en wave activity inter-act heavily with the local plasma, and the local plasma, in turn, try to cancel out the fluctuating field-aligned currents created by the impulsive Alfv´en waves. An impulsive Alfv´en wave will effect the local plasma, causing acceleration and heating, but the total net current will be small. The flux tube associated with a large net current might be closed in the ionosphere, while the dispersive Alfv´en induced currents may have a more complex fate.
Acknowledgement. The author would like to thank N. Ivchenko for his help with Freja electric and magnetic field data and the dis-cussions. The Freja project was supported by the Swedish Na-tional Space Board (SNSB) and by the Deutsche Agentur f¨ur Raum-fahrtangelegenheiten (DARA). The NSSDC OMNIWeb database was used to get information about the solar wind.
References
Andersson, L., Ivchenko, N., Clemmons, J., Namgaladez, A., Gus-tavsson, B., Wahlund, J.-E., and Eliasson, L.: Electron signatures in Alfv´en waves, accepted in J. Geophys. Res., 2001.
Boehm, M. H., Carlson, C. W., McFadden, J. P., Clemmons, J. H., Mozer, F. S.: High-resolution sounding rocket observations of large-amplitude Alfv´en waves, J. Geophys. Res., 95, 12 157– 12 171, 1990.
Boehm, M., Paschmann, G., Clemmons, J., H¨ofner, H., Frenzel, R., Ertl, M., Haerendel, G., Hill, P., Lauche, H., Eliasson, L., and Lundin, R.: The TESP electron spectrometer and correlator on Freja, Space Sci. Rev., 70, 3/4, 509–540, 1994.
Chaston, C. C., Carlson, C. W., Peria, W. J., Ergun, R. E., and Mc-Fadden, J. P.: FAST observations of inertial Alfv´en waves in the day side aurora, Geophys. Res. Lett., 26, 647–650, 1999. Chmyrev, V. M., Berthelier, A., Jorjio, N. V., Berthelier, J. J.,
Bosqued, J. M., Galperin, Yu. I., Kovrazhkin, R. A., Beghin, C., Mogilevsky, M. M., Bilichenko, S. V., and Molchanov, O.A.: Non-linear Alfv´en wave generator of auroral particles and ELF/VLF waves, Planet. Space. Sci., 37, 749–759, 1989. Clark, A. E. and Seyler, C. E.: Electron beam formation by
small-scale oblique inertial Alfv´en waves, J. Geophys. Res., 104, 17 233–17 249, 1999.
Eliasson, L., Norberg, O., Lundin, R., Lundin, K., Olsen, S., Borg, H., Andr´e, M., Koskinen, H., Riihel¨a, P., Boehm, M., and Whalen, B.: The Freja hot plasma experiment – instrument and first results, Space Sci. Rev., 70, 3/4, 563–576, 1994.
Goertz, C. K. and Boswell, R. W.: Magnetosphere-ionosphere cou-pling, J. Geophys. Res., 84, 7239–7246, 1979.
Goertz, C. K.: Kinetic Alfv´en waves on auroral field lines, Planet. Space Sci., 32, 1387, 1984.
Haerendel, G.: An Alfv´en wave model of auroral arcs, in: “High-Latitude Space Plasma Physics”, (Eds) Hultqvist, B. and Hag-fors, T., Plenum New York, USA, 515, 1983.
Hasegawa, A.: Particle acceleration by MHD surface wave and for-mation of aurora, J. Geophys. Res., 81, 5083, 1976.
Holback, B., Jansson, S.-E., ˚Ahl´en, L., Lundgren, G., Lyngdal, L., Powell, S., and Meyer, A.: The Freja wave and plasma density experiment, Space Sci. Rev., 70, 3/4, 577–592, 1994.
Ivchenko, N., Marklund, G., Lynch, K. A., Pietrowski, D., Torbert, R. B., Primdahl, F., and Ranta, A.: Quasiperiodic oscillations observed at the edge of an auroral arc by Auroral Turbulence 2, Geophys. Res. Let., 26, 3365–3368, 1999.
Knight, S.: Parallel electric fields, Plant. Space Sci., 21, 281–289, 1973.
Knudsen, D. J., Kelly, M. C., Earle, G. D., Vickrey, J. F., and Boehm, M.: Distinguishing Alfv´en waves from quasistatic field structures associated with the discrete aurora: Sounding rocket and HILAT satellite measurements, Geophys. Res. Let., 921, 17, 1990.
Knudsen, D. J., Kelley, M. C., and Vockery, J. F.: Alfv´en waves and the auroral ionosphere: A numerical model compared with measurements, J. Geophys. Res., 97, 77, 1992.
Knudsen, D. J. and Wahlund, J.-E.: Core ion flux bursts within soli-tary kinetic Alfv´en waves, J. Geophys. Res., 103, 4157, 1998. Knudsen, D. J., Clemmons, J. H., Wahlund, J.-E.: Correlation
be-tween core ion energization, suprathermal electron bursts, and broadband ELF plasma waves, J. Geophys. Res., 103, 4171– 4186, 1998.
Louarn, P., Wahlund, J.-E., Chust, T., de Feraudy, H., Roux, A., Holback, B., Dovner, P. O., Eriksson, A. I., and Holmgren, G.: Observations of kinetic Alfv´en waves by FREJA spacecraft, Geo-phys. Res. Lett., 21, 1847, 1994.
Lynch, K. A., Pietrowski, D., Torbert, R. B., Ivchenko, N., Mark-lund, G., Primdahl, F.: Multiple-point electron measurements in a nightside auroral arc: Auroral Turbulence II particle observa-tions, Geophys. Res. Let., 26, 3361–3364, 1999.
Lysak, R. L. and Lotko, W.: On the kinetic dispersion relation for shear Alfv´en waves, J. Geophys. Res., 101, 5085–5094, 1996. Marklund, G. T., Blomberg, L. G., Lindqvist, P.-A., F¨althammar,
C.-G., Haerendel, G., Mozer, F., Pedersen, A., and Tanskanen, P.: The double probe electric field experiment on Freja: Expriment description and first results, Space Sci. Rev., 70, 3/4, 483–508, 1994.
Seyler, C. E., Wahlund, J.-E.: Theory of nearly perpendicular elec-trostatic plasma waves and comparison to Freja satellite observa-tions, J. Geophys. Res., 101, 21 795–21 813, 1996.
Seyler, C. E., Wahlund, J.-E., and Holback, B.: Theory and simu-lation of low-frequency plasma waves and comparison to Freja satellite observations, J. Geophys. Res., 100, 21 453–21 472, 1995.
Seyler, C. E., Clark, A. E., Bonnell, J., and Wahlund, J.-E.: Electro-static broadband ELF wave emission by Alfv´en wave breaking, J. Geophys. Res., 103, 7027–7041, 1998.
Stasiewicz, K., Bellan, P., Chaston, C., Kletzing, C., Lysak, R., Maggs, J., Pokhotelov, O., Seyler, C. E., Shukla, P., Stenflo, L., Stretsov, A., and Wahlund, J.-E.: Small scale Alfv´enic structure in the aurora, Space Sci. Rev., 92, 423–533, 2000.
Stefant, R. J.: Alfv´en wave damping from finite gyroradius coupling to the ion acoustic mode, Phys. Fluids., 13, 440, 1970.
Wahlund, J.-E., Louarn, P., Chust, T., de Feraudy, H., Roux, A., Holback, B., Cabrit, B., Eriksson, A. I., Kintner, P. M., Kelley, M. C., Bonnell, J., and Chesney, S.: Observation of ion acoustic fluctuations in the auroral topside ionosphere by the FREJA s/c, Geophys. Res. Let., 21, 1835–1838, 1994.