SRef-ID: 1432-0576/ag/2004-22-2577 © European Geosciences Union 2004
Annales
Geophysicae
Density structures inside the plasmasphere: Cluster observations
F. Darrouzet1, P. M. E. D´ecr´eau2, J. De Keyser1, A. Masson3, D. L. Gallagher4, O. Santolik5,*, B. R. Sandel6, J. G. Trotignon2, J. L. Rauch2, E. Le Guirriec2, P. Canu7, F. Sedgemore8, M. Andr´e9, and J. F. Lemaire1
1Belgian Institute for Space Aeronomy (IASB-BIRA), 1180 Brussels, Belgium
2Laboratoire de Physique et Chimie de l’Environnement (LPCE/CNRS), Universit´e d’Orl´eans, 45071 Orl´eans, France 3Research and Scientific Support Department (RSSD), ESTEC-ESA, 2201-AG Noordwijk, The Netherlands
4Marshall Space Flight Center (MSFC), NASA, Huntsville, AL 35805, USA
5Faculty of Mathematics and Physics (MFF), Charles University, 121 16 Prague, Czech Republic 6Lunar and Planetary Laboratory (LPL), University of Arizona, Tucson, AZ 85721, USA
7Centre d’´etude des Environnements Terrestre et Plan´etaires (CETP/CNRS), Universit´e de Versailles Saint-Quentin-en-Yvelines, 78140 V´elizy, France
8Formerly at Danish Space Research Institute (DSRI), 2100 Copenhagen, Denmark 9Swedish Institute of Space Physics (IRFU), Uppsala division, 751 21 Uppsala, Sweden *also at Institute of Atmospheric Physics (IAP/CAS), 141 31 Prague, Czech Republic
Received: 1 October 2003 – Revised: 11 May 2004 – Accepted: 18 May 2004 – Published: 14 July 2004 Part of Special Issue “Spatio-temporal analysis and multipoint measurements in space”
Abstract. The electron density profiles derived from the EFW and WHISPER instruments on board the four Cluster spacecraft reveal density structures inside the plasmasphere and at its outer boundary, the plasmapause. We have con-ducted a statistical study to characterize these density struc-tures. We focus on the plasmasphere crossing on 11April 2002, during which Cluster observed several density irregu-larities inside the plasmasphere, as well as a plasmaspheric plume. We derive the density gradient vectors from simulta-neous density measurements by the four spacecraft. We also determine the normal velocity of the boundaries of the plume and of the irregularities from the time delays between those boundaries in the four individual density profiles, assuming they are planar. These new observations yield novel insights about the occurrence of density irregularities, their geometry and their dynamics. These in-situ measurements are com-pared with global images of the plasmasphere from the EUV imager on board the IMAGE satellite.
Key words. Magnetospheric physics (plasmasphere) – Space plasma physics (general or miscellaneous)
1 Introduction
The plasmasphere is a toroidal region in the inner mag-netosphere populated by cold (a few eV or less), dense (10–104particles/cm3)ion and electron populations of iono-spheric origin. It has been investigated by satellites and ground-based instruments (Lemaire and Gringauz, 1998, and references therein). The outer boundary of the
plasmas-Correspondence to:F. Darrouzet ([email protected])
phere, the plasmapause, has been discovered independently from ground-based whistler wave observations (Carpenter, 1963) and from in situ satellite measurements (Gringauz, 1963). It is often characterized by a sharp decrease in the plasma density, from 100–1000 particles/cm3down to a few particles/cm3. This knee is formed at an equatorial distance ranging from 2 to 8 Earth radii, depending on the level of the geomagnetic activity.
The Cluster mission is the first multi-spacecraft mission that surveys the plasmasphere. This paper focuses on Cluster observations of density structures. Before the Cluster mis-sion, large fluctuations in the electron number density had been observed by OGO 5 (Chappell et al., 1970a), by CR-RES near the plasmapause (LeDocq et al., 1994), by magne-tospheric plasma analyzers on board geosynchronous satel-lites (Moldwin et al., 1995), and by various other ground-based and spacecraft instruments (see review by Carpenter and Lemaire, 1997). Density structures had also been in-ferred from high-resolution magnetometer data obtained dur-ing the Earth swdur-ing-by of Cassini (Southwood et al., 2001) by interpreting the magnetic field strength variations as sig-natures of diamagnetic plasma elements produced by the in-terchange instability (Lemaire, 1975). More recently, small-scale plasmaspheric density structures have been reported by the Radio Plasma Imager (RPI) on board IMAGE (Carpenter et al., 2002), and in the dusk sector by WHISPER on board Cluster (D´ecr´eau et al., submitted, 20041). Large-scale den-sity structures have also been observed in the past and called 1D´ecr´eau, P. M. E., Le Guirriec, E., Rauch, J. L., Trotignon, J.
Fig. 1. Cluster electron density profiles derived from WHISPER and EFW as a function of time for the plasmasphere crossing on 11 April 2002, around 21:30 MLT and withKp=3. AI N and AOU T are the plasmaspheric plume crossings in the inbound and outbound passes, respectively, studied in Sect. 4.2, Z is the density irregularity discussed in Sect. 4.3, and PPI Nand PPOU T are the plasmapause positions in the inbound and outbound crossings.
“detached plasma elements” or “plasmaspheric tails” (Chap-pell et al., 1970b; Horwitz et al., 1990). Recently, such struc-tures, now called “plasmaspheric plumes”, have been rou-tinely observed by the global plasmaspheric imaging made by the Extreme Ultraviolet (EUV) imager on board IMAGE (Sandel et al., 2001; Goldstein et al., 2004). The formation of these plumes has been predicted by different theoretical models, based on a time dependent convection electric field (Grebowsky, 1970; Chen and Grebowsky, 1974), or based on the interchange instability mechanism (Lemaire, 2000; Pier-rard and Lemaire, 2004).
The purpose of this paper is to report density structure ob-servations by Cluster in the plasmasphere. After presenting the electron density data sets in Sect. 2, a statistical study of the occurrence of density irregularities as a function of magnetic local time (MLT) and geomagnetic activity will be discussed in Sect. 3. Section 4 focuses on the plasmasphere crossing on 11 April 2002, using WHISPER observations as well as other instruments on board Cluster. Coordinated ob-servations from EUV complement the Cluster data for this event. Section 5 presents a summary and conclusions.
2 Electron density data set
The four Cluster spacecraft cross the plasmasphere near perigee (around 4RE)every 57 h (Escoubet et al., 1997). These crossings go from the Southern to the Northern Hemi-sphere and uniformly cover all MLT sectors due to the yearly precession of Cluster. The electron density is obtained by combining data from two experiments: the Waves of HIgh frequency and Sounder for Probing Electron density by Re-laxation, WHISPER (D´ecr´eau et al., 1997, 2001) and the Electric Field and Wave experiment, EFW (Gustafsson et al., 1997).
nonlinear and depends mainly on the electron plasma state (Pedersen, 1995; Laakso and Pedersen, 1998).
On a given Cluster perigee pass, the EFW measurements can be calibrated using the WHISPER observations, so as to infer 0.2 s electron density data (Pedersen et al., 2001). This calibration works well in the plasmasphere, but it is, how-ever, only possible in regions where the frequency is below 80 kHz, i.e. the upper frequency limit of WHISPER. Above this instrumental threshold, Ne has been inferred from Vsc only, using a method presented by Moullard et al. (2002). Figure 1 depicts Ne as a function of time for the 11 April 2002 plasmasphere crossing; this particular event will be dis-cussed in detail in Sect. 4.
In order to facilitate an intercomparison of the four Clus-ter density profiles, a combination of the inClus-ternal magnetic field model IGRF95 and the external magnetic field model Tsyganenko-96 (Tsyganenko and Stern, 1996) is used to trace the magnetic field line from the spacecraft position to the geomagnetic equator. The IGRF95 and Tsyganenko-96 models are computed with the Unilib library (Library of routines for magnetospheric applications: http://www.oma. be/NEEDLE/unilib.php/20x/index.html). The geomagnetic equator is identified as the location where the magnetic field strength reaches a minimum. The geocentric distance of this equatorial point is called Requat and is expressed in units of Earth radii. We prefer to use Requat instead of the McIlwain L parameter (McIlwain, 1961), since it is easier to interpret: L varies along a magnetic field line, except for a pure dipole, whereas Requatis by definition constant along a field line.
3 Occurrence of density irregularities
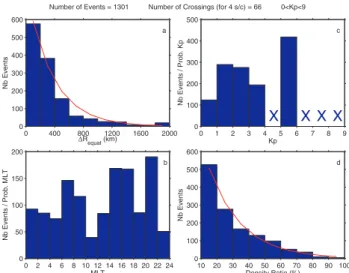
Fig. 2.Statistical results on the density irregularities observed dur-ing all 264 plasmasphere crossdur-ings:(a)the number of events as a function of the transverse equatorial size1Requat (in km),(b)the MLT distribution divided by the probability to have a MLT in each range,(c)theKpdistribution divided by the probability to have a Kpin each range (a cross means no data), and(d)the density ratio. The red curves are exponential least-squares fitting curves.
09:00 MLT, the maximum value in the previous 12 h between 09:00 and 15:00 MLT, and the maximum value in the previ-ous 18 h between 15:00 and 21:00 MLT. In the remainder of the paper,Kpwill denote this time delayed value.
Our sample contains only a few plasmasphere crossings for Kp≥4, in part because of the rather low probability for such a high level of activity. The fact that the Cluster spacecraft do not cross the plasmasphere forKp≥6 confirms that in case of high geomagnetic activity, the plasmapause forms closer to the Earth, below the Cluster perigee, which is around 4RE. In any case, the spacecraft remain in the outer plasmasphere.
Density irregularities have been defined by a density de-pletion ratio of at least 10%. Panel (a) of Fig. 2 gives the occurrence of these irregularities as a function of their trans-verse equatorial size1Requat (in km). Panels (b) and (c) show, respectively, the MLT andKpdistribution of the irreg-ularities weighted by the MLT andKp occurrence probabil-ity. Panel (d) gives the density ratio.
This survey suggests that there are more density irregu-larities in the dawn, afternoon and post-dusk sectors. It is interesting to note that two of these sectors correspond to the sectors where the plasmapause tends to be thicker. Irreg-ularities rarely occur in the pre-noon and midnight sectors. Their transverse equatorial size and density depletion ratio distributions are exponential (following the red least-squares fitting curves on Fig. 2) with a characteristic size of 365 km and a characteristic density ratio of 20%. The larger ones (in size) are observed whenKpis small (Kp<2). This is in part due to the fact that large ones cannot exist for highKp since the plasmasphere then is small. ForKpbelow 2 (figure
Fig. 3.Orbit of Cluster 3 in the XY and XZ GSE planes indicated by a solid black line, with tick marks every 4 h. The dashed blue line in-dicates the position of the magnetopause and the bow shock is indi-cated by the dot-dashed blue line. When inside the magnetosphere, a magnetic field line has been traced from each tick mark location to the surface of the Earth or the magnetopause. Tracings parallel to the field (south-north) are shown in green and tracings anti-parallel (north-south) in red. (Courtesy of Cluster ground-based working group.)
not shown here), more density structures are observed in the dawn sector, while most of them are found in the dusk sector when Kp is above 2. As expected, there are more density irregularities during and after periods of high geomagnetic activity, suggesting that they are generated near dusk by vari-ations in the magnetospheric convection electric field. But as mentioned before, our sample has few cases with high Kp and is therefore biased in this respect.
Irregular density profiles are predicted by plasmaspheric models that simulate the convection and refilling processes, like the CDPDM model (Galperin et al., 1997) and the self-consistent RICE model (Spiro et al., 1981). Plasmaspheric refilling can produce density irregularities in the equato-rial region (Singh, 1988; Singh and Horwitz, 1992). Turn-ings of the interplanetary magnetic field (IMF) influence the convection and might be responsible for the formation of density structures (Goldstein et al., 2002; Spasojevi´c et al., 2003); IMF orientation might therefore be a useful alterna-tive parameter to analyse the density irregularities distribu-tion. Plasma interchange motion can also create density ir-regularities (Lemaire, 2001).
4 Case study (11 April 2002)
We have studied in more detail the plasmasphere crossing on 11 April 2002, between 21:40 and 21:10 MLT and with
V = 0.57 km/sn
AIN
V = 0.77 km/sn
PPIN
Fig. 4.Electron density profiles as a function of Requat for the plasmasphere crossing on 11 April 2002. The lower four curves correspond to the inbound pass and the upper four curves (shifted by a factor 10) to the outbound pass. The normal boundary velocities Vnof the plume crossings AI Nand AOU T are indicated on the figure.
Figure 4 plots the electron density profiles of Fig. 1 but as a function of Requat as defined in Sect. 2. The density profiles for the inbound pass are shown by the lower set of four curves and those for the outbound pass by the upper set of four curves (shifted by a factor 10). A plasmaspheric plume is seen in the inbound (AI N)and outbound (AOU T) passes. In the outbound pass the plume is narrower in Requat scale and is observed at higher Requat. A lot of irregulari-ties are visible in the plasmasphere. There are more density irregularities during the outbound pass (16) than during the inbound one (10). It is difficult to say if the four spacecraft cross the same density structures in both hemispheres during both passes, because we do not clearly recognize the same patterns on both sides of the equator, except for the plumes. There may be differences in the plasma density structures over small distances (hundreds of kilometres) and/or these structures may have changed over the time interval (tens of minutes) between both crossings.
4.1 Analysis techniques
To study plasmaspheric plumes and density irregularities with the Cluster constellation, we rely on two different four-point techniques described in Sects. 4.1.1 and 4.1.2. These are applied to the plasmaspheric plume traversals AI N and AOU T in Sect. 4.2 and to the density irregularities inside the plasmasphere in Sect. 4.3. In addition, we present in Sect. 4.1.3 how the EUV experiment on board the IMAGE spacecraft has been used to compare global images of the plasmasphere with in-situ Cluster results.
4.1.1 Density gradient
We compute the density gradient along the trajectory of the centre of mass of the Cluster tetrahedron. The method
de-scribed by Harvey (1998) and Darrouzet et al. (2002) is used. The density gradient is determined from simultaneous mea-surements of the density, postulating that the four points of measurement are close enough to each other, so that all spacecraft are embedded in the same structure at the same time. The gradient can then be taken constant over the tetra-hedron. The similarity of the four density profiles in Fig. 1 indicates that this assumption is approximately valid during this crossing: The density differences between the spacecraft come from small-scale irregularities, not large-scale.
The computation of a gradient is inherently a difficult op-eration: It involves differencing quantities of similar magni-tude and thus results in large relative errors. To reduce such errors, we filter away, prior to computing the gradient, any variations at a time scale shorter than what we are interested in, by smoothing the density profiles with a time resolution of 20 s (100 km spatial resolution), which is the average time delay between the spacecraft. Furthermore, when the den-sity is close to an extremum, the denden-sity gradient should be interpreted with caution.
4.1.2 Velocities
We distinguish in the following sections three different ve-locities: normal boundary velocity, azimuthal plasma veloc-ity and radial boundary velocveloc-ity.
We derive the velocity of a density structure boundary in the normal direction of the interface, Vn, with a time delay method. Assuming a boundary to be a planar surface trav-elling at a constant velocity along its normal, we determine this velocity from individual spacecraft times and positions of the boundary crossings.
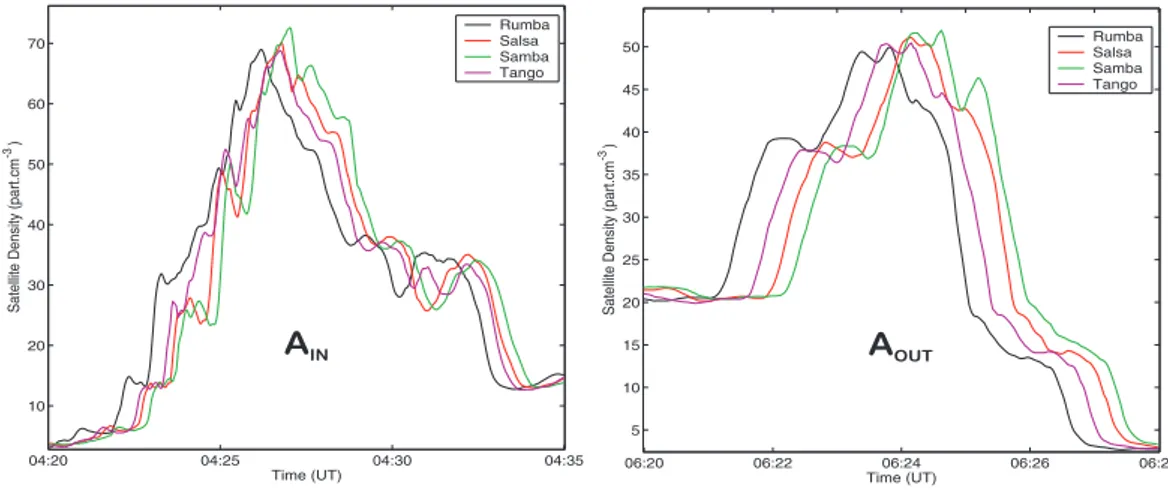
AIN AOUT
Fig. 5.Electron density profiles as a function of time of the two plume crossings AI Nand AOU T observed on the inbound and outbound legs of the plasmasphere crossing on 11 April 2002.
projection of the azimuthal plasma velocity, Vp, on the nor-mal boundary direction: Vn=Vpsinθ, with θ the angle be-tween the normal and the outward radial direction.
The radial boundary velocity, Vr, which can be computed from the displacement of the boundary of a structure in the radial direction (at fixed MLT), is also related to the normal boundary velocity by: Vn=Vrcosθ.
4.1.3 EUV images
The Extreme Ultraviolet (EUV) imager on board the IMAGE spacecraft (Burch, 2000) provides global images of the plas-masphere with a spatial resolution of 0.1RE every 10 min. The EUV instrument works by detecting 30.4 nm sunlight resonantly scattered by singly ionized helium (Sandel et al., 2000). Because of IMAGE high apogee (∼7RE) and the EUV imager’s wide field of view, images acquired at apogee show the structure of the entire plasmasphere. Sequences of such 2-D images show the shape of the plasmasphere, its evolution over time, and the motion of plasma irregularities at the plasmapause as well as inside the plasmasphere, illus-trating the convection pattern.
The EUV images have been reprocessed to filter away the noise (apparent as high frequency spatial variations in the im-age) based on the fact that the larger scale density distribution in the plasmasphere (and a fortiori the emission intensities in the EUV images, which are line-of-sight integrations) is rather smooth. Histogram equalization and an appropriate color scale were used to improve the contrast in the images. 4.2 Plasmaspheric plume
The calculated normal boundary velocities Vn of the plas-maspheric plume crossings AI Nand AOU T shown in Fig. 4 range between 0.14 to 0.77 km/s. The velocity of the space-craft, 4.6 km/s, is significantly larger. The velocities along the inbound pass are larger at the inner edge of the struc-ture than at the outer edge, and also larger than those
mea-sured along the outbound pass. This is consistent with the assumption of an azimuthal motion of the plume, and with the topology of a plume getting thinner and extending farther out at earlier MLT (see Fig. 12 in Spasojevi´c et al., 2003). Indeed the plume is crossed almost 2 h later in the outbound pass, and then it is observed to be thinner and at larger equa-torial distance. The angleθbetween the normal and the ra-dial direction is between 20 and 70◦. This implies an azi-muthal plasma velocity Vpof the structures between 0.3 and 1 km/s. This is less than 30% of the co-rotation speed, which is 3.2 km/s at the spacecraft radial distance. This indicates that these structures are not fully co-rotating, which is in agreement with results from the EDI instrument (Paschmann et al., 1997) on board Cluster in the same region (Matsui et al., 2003).
Since the Cluster orbit remains roughly at the same MLT during the whole crossing, we can estimate the radial bound-ary velocity Vr from the displacement between the inbound and outbound passes. The inner edge of this plume shifts 5100 km in 110 min, which corresponds to Vr=0.77 km/s. θ is 40◦for this interface, which implies Vn=0.60 km/s. This speed is comparable to the 0.77 km/s determined from the timing analysis in the inbound pass. For the outer edge, Vr is 0.42 km/s,θis 50◦, then Vnis 0.27 km/s, which has to be compared with 0.57 km/s.
06
12
18
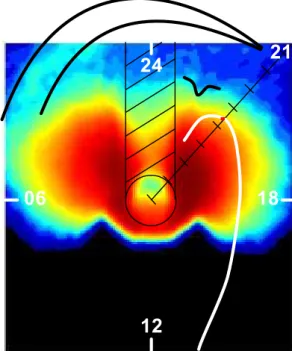
Fig. 6.EUV image at 04:32 UT on 11 April 2002. The image has been smoothed by a spatial low frequency filter. Contrast has been enhanced by means of a nonlinear color scaling based on histogram equalization. The black circle corresponds to the approximate size and position of the Earth, with its shadow extending towards the op-posite direction to the Sun. The plume is delimited by the black line and one density irregularity is indicated by the small black indenta-tion. The white curve is the trajectory of the four Cluster satellites between 3 h before and 3 h after the time of this EUV image, and the red dot corresponds to the position of the Cluster spacecraft at 04:32 UT.
the spacecraft, the density profiles as a function of Requat in Fig. 4 are much more similar, showing the usefulness of the spatial equatorial view, which removes the time lag between the four spacecraft, and also the differences in latitude. The density gradient can be reliably calculated in the region be-tween each plume crossing and the very perturbed plasma-sphere proper. The values are very small, showing that the medium is very uniform there.
Figure 6 shows an EUV image of the plasmasphere at 04:32 UT on 11 April 2002 (around the timing of the inbound crossing of the plume by the Cluster satellites). IMAGE was then located high above the northern pole. The Sun is to-wards the bottom of this picture and the size and location of the Earth are indicated by the black circle, prolonged by the Earth’s shadow extending through the plasmasphere in the opposite direction of the Sun. The plume is delimited by the wide black line. The black area in this image corresponds to a data gap. The white curve is the trajectory of the four Cluster satellites projected along a field line onto the equa-torial plane. The red dot corresponds to the location of the Cluster spacecraft at 04:32 UT. It should be pointed out that image intensities scale with line-of-sight densities that are not necessarily projected onto the equatorial plane, but as the satellite is located at high altitude above the pole, the plane of
06
12
18
Fig. 7. EUV image at 06:04 UT on 11 April 2002 (same type as Fig. 6).
view of the EUV instrument is close to the equatorial plane. Therefore, the distances expressed in Requatare only approx-imate.
The shape of the plume in the EUV images is consis-tent with the topology of the plume deduced from Cluster measurements in terms of position, size and intensity. It is surprising to observe such a long and long-lived structure in this low to moderate geomagnetic situation. Cluster and IMAGE provide complementary views of the plasmasphere, each with its own point of view and different time and space resolution.
4.3 Density irregularities inside the plasmasphere
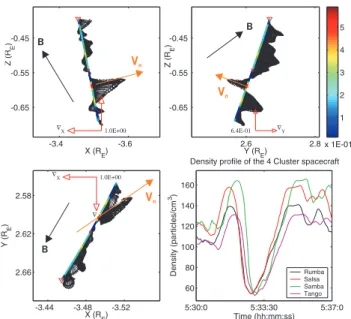
As an example of density irregularities inside the plas-masphere, we focus on a small structure observed around 05:30 UT (indicated on Figs. 1 and 4 by the letter Z). Being close to the equator at that time, the trajectories of the four spacecraft are almost parallel to the magnetic field. The den-sity gradient is parallel to the XY plane (Fig. 8) and nearly perpendicular to the magnetic field (its projections onto the plane of reference are shown by black arrows in this figure). This density gradient lies in the equatorial plane, as expected for a density structure close to the equator.
The normal boundary velocity of the inner interface of this plasma element, as determined from the time delay method, is Vn=1.90 km/s. Its projections onto the GSE planes (orange arrows on Fig. 8) show a large component in the X-direction. This density irregularity being observed well inside the plas-masphere, at 4.5RE, the assumption of azimuthal motion is justified. The angleθ between the direction of the density gradient, which is the normal direction, and the radial direc-tion, is 55◦. The measured Vn then implies an azimuthal plasma velocity Vp=2.3 km/s, which is essentially the co-rotation speed at this equatorial distance (2.1 km/s). The same result is obtained for the outer part of this density irreg-ularity (2.2 km/s). That confirms that this density element is indeed fully co-rotating. This is consistent with the EDI drift velocity statistical analysis (Matsui et al., 2003). These re-sults are also in agreement with velocity measurements from the CIS experiment (R`eme et al., 2001), in the RPA mode (ion energies from about 0 to 25 eV) that show a motion of the density irregularities inside the plasmasphere in the co-rotation direction (Dandouras, 2003, personal communica-tion).
The order of crossing by the four spacecraft is the same in the inbound and in the outbound crossing, which means that the structure is simply rotating with the plasma around the Earth. Repeating the same analysis for several other den-sity irregularities, we conclude that most of them move with an azimuthal velocity between 1.5 and 2 km/s in a direction that has a small Z-component, which coincides more or less with the co-rotation velocity. It is interesting to note that the STAFF experiments on board Cluster (Cornilleau-Wehrlin et al., 2003) observe a good correlation of whistler-mode emis-sions with these density irregularities.
The density irregularities observed with WHISPER inside the plasmasphere are not clearly seen at the same time in the EUV image (on Figs. 6 and 7) because of the spatial resolu-tion of the EUV instrument, which cannot resolve structures
B B
B
Vn
Vn
Vn
Fig. 8. Density gradient vector projections onto the XY, YZ, and XZ GSE planes for the density irregularity Z observed in the plas-masphere on 11 April 2002. B is the magnetic field and Vnis the normal boundary velocity of the inner edge of Z. The density of the four spacecraft is plotted as a function of time in the lower right panel.
with a size smaller than 0.1RE, and because of the line-of-sight integration. The EUV images clearly show co-rotating plasmapause indentations (as indicated on Figs. 6 and 7), but it is difficult to ascertain the correspondence with structures observed by Cluster.
5 Summary and conclusion
Over 260 Cluster plasmasphere crossings have been exam-ined in this first analysis. Density irregularities are often, though not always, seen in the plasmasphere and at the plasmapause. Their existence makes the identification of the actual plasmapause knee more difficult. The density irregu-larities have a transverse equatorial size that is exponentially distributed, with a characteristic value of 365 km going up to 5000 km. They have a characteristic density ratio of 20%. There are more density irregularities when the level of geo-magnetic activity is higher. There seems to be an MLT asym-metry in their distribution. All these results show that the plasmasphere is a much more complex and dynamic region than considered so far from earlier experimental observations as well as from some early theoretical models and MHD simulations.
gion, showing that these irregularities are field aligned. We observe small-scale variability in the density profiles from Cluster, both spatially and temporally.
As expected, there are more density irregularities during and after periods of high geomagnetic activity, likely related to the mechanism of their formation. Once created, these structures are partially or fully co-rotating around the Earth. For the event studied, the IMF Bz turned southward and northward several times in the hours and day preceding the crossing. This could have been a trigger to form the density structures reported here.
A more complete statistical analysis is needed to confirm these preliminary conclusions. Indeed, a larger sample of plasmapause crossings is needed for this purpose. This ana-lysis will be performed in the mid-term future over the full Cluster database.
Acknowledgements. F. Darrouzet, J. De Keyser, and J. F. Lemaire acknowledge the support by the Belgian Federal Science Pol-icy Office through the CLUSTER/PRODEX-7 project (contract n◦13127/98/NL/VJ (IC)).
Topical Editor T. Pulkkinen thanks Y. Ebihara and another re-feree for their help in evaluating this paper.
References
Burch, J. L.: IMAGE mission overview, Space Sci. Rev., 91, 1–14, 2000.
Carpenter, D. L.: Whistler evidence of a “knee” in the magneto-spheric ionization density profile, J. Geophys. Res., 68, 1675– 1682, 1963.
Carpenter, D. L. and Lemaire, J.: Erosion and recovery of the plas-masphere in the plasmapause region, Space Sci. Rev., 80, 153– 179, 1997.
Carpenter, D. L., Spasojevi´c, M. A., Bell, T. F., Inan, U. S., Reinisch, B. W., Galkin, I. A., Benson, R. F., Green, J. L., Fung, S. F., and Boardsen, S. A.: Small-scale field-aligned plasmaspheric density structures inferred from the Radio Plasma Imager on IMAGE, J. Geophys. Res., 107, 1258, doi:10.1029/2001JA009199, 2002.
Chappell, C. R., Harris, K. K., and Sharp, G. W.: A study of the influence of magnetic activity on the location of the plasmapause as measured by OGO 5, J. Geophys. Res., 75, 50–56, 1970a. Chappell, C. R., Harris, K. K., and Sharp, G. W.: The morphology
of the bulge region of the plasmasphere, J. Geophys. Res., 75, 3848–3861, 1970b.
Chen, A. J. and Grebowsky, J. M.: Plasma tail interpretations of pronounced detached plasma regions measured by Ogo 5, J. Geo-phys. Res., 79, 3851–3855, 1974.
Martin, Ph., Randriamboarison, O., Sen´e, F. X., Trotignon, J. G., Canu, P., M¨ogensen, P. B., and Whisper investigators: Whisper, a resonance sounder and wave analyser: performances and per-spectives for the Cluster mission, Space Sci. Rev., 79, 157–193, 1997.
D´ecr´eau, P. M. E., Fergeau, P., Krasnoselskikh, V., Le Guirriec, E., L´evˆeque, M., Martin, Ph., Randriamboarison, O., Rauch, J. L., Sen´e, F. X., S´eran, H. C., Trotignon, J. G., Canu, P., Cornil-leau, N., de F´eraudy, H., Alleyne, H., Yearby, K., M¨ogensen, P. B., Gustafsson, G., Andr´e, M., Gurnett, D. A., Darrouzet, F., Lemaire, J., Harvey, C. C., Travnicek, P., and Whisper experi-menters: Early results from the Whisper instrument on CLUS-TER: an overview, Ann. Geophys., 19, 1241–1258, 2001. Escoubet, C. P., Russell, C. T., and Schmidt, R.: The Cluster and
Phoenix Missions, Kluwer Academic Publishers, 1997. Galperin, Y. I., Soloviev, V. S., Torkar, K., Foster, J. C., and Veselov,
M. V.: Predicting plasmaspheric radial density profiles, J. Geo-phys. Res., 102, 2079–2091, 1997.
Goldstein, J., Spiro, R. W., Reiff, P. H., Wolf, R. A., Sandel, B. R., Freeman, J. W., and Lambour, R. L.: IMF-driven over-shielding electric field and the origin of the plasmaspheric shoulder of May 24, 2000, Geophys. Res. Lett., 29, (16), doi:10.1029/2001GL014534, 2002.
Goldstein, J., Spasojevi´c, M., Reiff, P. H., Sandel, B. R., For-rester, W. T., Gallagher, D. L., and Reinisch, B. W.: Identify-ing the plasmapause in IMAGE EUV data usIdentify-ing IMAGE RPI in situ steep density gradients, J. Geophys. Res., 108, 1147, doi:10.1029/2002JA009475, 2003.
Goldstein, J., Sandel, B. R., Thomsen, M. F., Spasojevi´c, M., and Reiff, P. H.: Simultaneous remote sensing and in situ observa-tions of plasmaspheric drainage plumes, J. Geophys. Res., 109, A03202, doi:10.1029/ 2003JA010281, 2004.
Gringauz, K. I.: The structure of the ionized gas envelope of the Earth from direct measurements in the USSR of local charged particle concentrations, Planet. Space Sci., 11, 281–296, 1963. Grebowsky, J. M.: Model study of plasmapause motion, J.
Geo-phys. Res., 75, 4329–4333, 1970.
Gustafsson, G., Bostr¨om, R., Holback, B., Holmgren, G., Lundgren, A., Stasiewicz, K., Ahlen, L., Mozer, F. S., Pankow, D., Harvey, P., Berg, P., Ulrich, R., Pedersen, A., Schmidt, R., Butler, A., Fransen, A. W. C., Klinge, D., Thomsen, M., F¨althammar, C. G., Lindqvist, P.-A., Christenson, S., Holtet, J., Lybekk, B., Sten, T. A., Tanskanen, P., Lappalainen, K., and Wygant, J.: The electric field and wave experiment for the Cluster mission, Space Sci. Rev., 79, 137–156, 1997.
Harvey, C. C.: Spatial gradient and the volumetric tensor, in: Ana-lysis methods for Multi-Spacecraft data, edited by Paschmann, G. and Daly, P. W., ISSI Scientific Report SR-001, 307–322, 1998.
locations, J. Geophys. Res., 95, 7937–7947, 1990.
Laakso, H. and Pedersen, A.: Ambient electron density de-rived from differential potential measurements, in Measurements Techniques in Space Plasmas, edited by Borovsky, J., Pfaff, P., and Young, D., AGU Monograph 102, AGU Washington D.C., 49–54, 1998.
LeDocq, M. J., Gurnett, D. A., and Anderson, R. R.: Electron num-ber density fluctuations near the plasmapause observed by the CRRES spacecraft, J. Geophys. Res., 99, 23 661–23 671, 1994. Lemaire, J. F.: The mechanisms of formation of the plasmapause,
Ann. Geophys., 31, 175–190, 1975.
Lemaire, J. F. and Gringauz, K. I.: The Earth’s Plasmasphere, with contributions from Carpenter, D. L. and Bassolo, V., Cambridge University Press, 372, 1998.
Lemaire, J. F.: The formation plasmaspheric tails, Phys. Chem. Earth (C), 25, 9–17, 2000.
Lemaire, J. F.: The formation of the light-ion-trough and peeling off the plasmasphere, J. Atmos. Terr. Phys., 63, 1285–1291, 2001. Matsui, H., Quinn, J. M., Torbert, R. B., Jordanova, V. K.,
Baumjo-hann, W., Puhl-Quinn, P. A., and Paschmann, G.: Electric field measurements in the inner magnetosphere by Cluster EDI, J. Geophys. Res., 108, 1352, doi:10.1029/2003JA009913, 2003. McIlwain, C. E.: Coordinates for Mapping the Distribution of
Mag-netically Trapped Particles, J. Geophys. Res., 66, 3681–3691, 1961.
Moldwin, M. B., Thomsen, M. F., Bame, S. J., McComas, D., and Reeves, G. D.: The fine-scale structure of the outer plasmas-phere, J. Geophys. Res., 100, 8021–8030, 1995.
Moullard, O., Masson, A., Laakso, H., Parrot, M., D´ecr´eau, P. M. E., Santolik, O., and Andr´e, M.: Density modulated whistler mode emissions observed near the plasmapause, Geophys. Res. Lett., 29, (20), doi:10.1029/2002GL015101, 2002.
Paschmann, G., Melzner, F., Frenzel, R., Vaith, H., Parigger, P., Pagel, U., Bauer, O. H., Haerendel, G., Baumjohann, W., Sck-opke, N., Torbert, R. B., Briggs, B., Chan, J., Lynch, K., Morey, K., Quinn, J. M., Simpson, D., Young, C., McIlwain, C. E., Fil-lius, W., Kerr, S. S., Maheu, R., and Whipple, E. C.: The Electron Drift Instrument for Cluster, Space Sci. Rev. 79, 233–269, 1997. Pedersen, A.: Solar wind and magnetosphere plasma diagnostics by spacecraft electrostatic potential measurements, Ann. Geophys., 13, 118–129, 1995.
Pedersen, A., D´ecr´eau, P., Escoubet, C. P., Gustafsson, G., Laakso, H., Lindqvist, P.-A., Lybekk, B., Masson, A., Mozer, F., and Vaivads, A.: Four-point high resolution information on elec-tron densities by the electric field experiments (EFW) on Cluster, Ann. Geophys., 19, 1483–1489, 2001.
Pierrard, V. and Lemaire, J. F.: Development of shoulders and plumes in the frame of the interchange instability mechanism for plasmapause formation, Geophys. Res. Lett., 31, L05809, doi:10.1029/2003GL018919, 2004.
R`eme, H., Aoustin, C., Bosqued, J. M., Dandouras, I., Lavraud, B., Sauvaud, J. A., Barthe, A., Bouyssou, J., Camus, Th., Coeur-Joly, O., Cros, A., Cuvilo, J., Ducay, F., Garbarowitz, Y., Medale, J. L., Penou, E., Perrier, H., Romefort, D., Rouzaud, J., Vallat, C., Alcayd´e, D., Jacquey, C., Mazelle, C., d’Uston, C., M¨obius, E., Kistler, L. M., Crocker, K., Granoff, M., Mouikis, C., Popecki, M., Vosbury, M., Klecker, B., Hovestadt, D.,
Kucharek, H., Kuenneth, E., Paschmann, G., Scholer, M., Sck-opke, N., Seidenschwang, E., Carlson, C. W., Curtis, D. W., In-graham, C., Lin, R. P., McFadden, J. P., Parks, G. K., Phan, T., Formisano, V., Amata, E., Bavassano-Cattaneo, M. B., Baldetti, P., Bruno, R., Chionchio, G., Di Lellis, A., Marcucci, M. F., Pal-locchia, G., Korth, A., Daly, P. W., Graeve, B., Rosenbauer, H., Vasyliunas, V., McCarthy, M., Wilber, M., Eliasson, L., Lundin, R., Olsen, S., Shelley, E. G., Fuselier, S., Ghielmetti, A. G., Lennartsson, W., Escoubet, C. P., Balsiger, H., Friedel, R., Cao, J.-B., Kovrazhkin, R. A., Papamastorakis, I., Pellat, R., Scudder, J., and Sonnerup, B.: First multi-spacecraft ion measurements in and near the Earth’s magnetosphere with the identical Cluster ion spectrometry (CIS) experiment, Ann. Geophys., 19, 1303–1354, 2001.
Sandel, B. R., Broadfoot, A. L., Curtis, C. C., King, R. A., Stone, T. C., Hill, R. H., Chen, J., Siegmund, O. H. W., Raffanti, R., Allred, D. D., Turley, R. S., and Gallagher, D. L.: The extreme ultraviolet imager investigation for the IMAGE mission, Space Sci. Rev., 91, 197–242, 2000.
Sandel, B. R., King, R. A., Forrester, W. T., Gallagher, D. L., Broad-foot, A. L., and Curtis, C. C.: Initial Results from the IMAGE Extreme Ultraviolet Imager, Geophys. Res. Lett., 28, (8), 1439– 1442, 2001.
Singh, N.: Refilling of a plasmaspheric flux tube: microscopic plasma processes, in Modeling Magnetospheric Plasma, edited by Moore, T. E. and Waite, J. H., AGU Geophysical Monograph 44, 87–99, Washington D.C., 1988.
Singh, N. and Horwitz, J. L.: Plasmaspheric refilling: recent obser-vations and modelling, J. Geophys. Res., 97, 1049–1079, 1992. Southwood, D. J., Dougherty, M. K., Balogh, A., Cowley, S. W.
H., Smith, E. J., Tsurutani, B. T., Russell, C. T., Siscoe, G. L., Erode, G., Glassmeier, K.-H., Gleim, F., and Neubauer, F. M.: Magnetometer measurements from the Cassini Earth swing-by, J. Geophys. Res., 106, 30 109–30 128, 2001.
Spasojevi´c, M., Goldstein, J., Carpenter, D. L., Inan, U. S., Sandel, B. R., Moldwin, M. B., and Reinisch, B. W.: Global response of the plasmasphere to a geomagnetic disturbance, J. Geophys. Res., 108, 1340, doi:10.1029/2003JA009987, 2003.
Spiro, R. W., Harel, M., Wolf, R. A., and Reiff, P. H.: Quantitative simulation of a magnetospheric substorm, 3. Plasmaspheric elec-tric fields and evolution of the plasmapause, J. Geophys. Res., 86, 2261–2272, 1981.
Trotignon, J. G., D´ecr´eau, P. M. E., Rauch, J. L., Randriamboarison, O., Krasnoselskikh, V., Canu, P., Alleyne, H., Yearby, K., Le Guirriec, E., S´eran, H. C., Sen´e, F. X., Martin, Ph., L´evˆeque, M., and Fergeau, P.: How to determine the thermal electron density and the magnetic field strength from the CLUSTER/WHISPER observations around the Earth, Ann. Geophys., 19, 1711–1720, 2001.
Trotignon, J. G., D´ecr´eau, P. M. E., Rauch, J. L., Le Guirriec, E., Canu, P., and Darrouzet, F.: The Whisper Relaxation Sounder Onboard Cluster: A Powerful Tool for Space Plasma Diagnosis around the Earth, Cosmic Research, 41, (4), 369–372, 2003. Tsyganenko, N. A. and Stern, D. P.: Modeling the global magnetic