IJER@2014
Page 344
Optimization of EDM Process Parameters on Titanium Super Alloys Based
on the Grey Relational Analysis
J. Laxman, Dr. K. Guru Raj
Department of Mechanical Engineering. Kakatiya Institute of Technology & Science ,
Yerragattu Hillock, Hasanparthy, Warangal, India
[email protected]
, [email protected]
Abstract - Electrical discharge machining (EDM) is a unconventional machining process for the machining of complex shapes and hard materials that are difficult of machining by conventional machining process. In this paper deals with the optimization of EDM process parameters using the grey relational analysis (GRA) based on an orthogonal array for the multi response process. The experiments are conducted on Titanium super alloys with copper electrode based on the Taguchi design of experiments L27 orthogonal array by choosing various parameters such as peak current, pulse on time, pulse off time and tool lift time for EDM process to obtain multiple process responses namely Metal removal rate (MRR) and Tool Wear Rate (TWR). The combination of Taguchi method with GRA enables to determine the optimal parameters for multiple response process. Gray relational analysis is used to obtain a performance index called gray relational grade to optimize the EDM process with higher MRR and lower TWR and it is clearly found that the performance of the EDM has greatly increased by optimizing the responses the influence of individual machining parameters also investigated by using analysis of variance for the grey relational grade.
Keywords
:-- Titanium super alloys, material removal rate tool wear rate, copper electrode, design of experiments and grey relational analysis.1. Introduction
Electrical discharge machining (EDM) is one of the most extensively used non-conventional machining process. It uses thermal energy to machine electrically conductive parts regardless of hardness of the material the distinctive advantage of EDM is in the manufacture of mould, die, automotive, aerospace and surgical components. EDM does not make direct contact between the electrode and the workpiece eliminating mechanical stresses, chatter and vibration during machining. The traditional machining techniques are often incapable to machine the titanium super alloys due to its high hardness and these can be machined economically by EDM. Gopala kannan et.al reported the application of combined Taguchi method and grey relational analysis to improve the multiple performance characteristics of Metal removal rate, electrode wear rate and surface roughness in EDM of Aluminum hybrid metal matrix composites1. S. Singh et.al investigated optional process parameters using the GRA approach, based on the orthogonal experimental design which minimizes the multiple performance characteristics for APM – EDM of Aluminium hybrid Metal Matrix composite Lin C.L. et. al presented the grey relational analysis based on orthogonal array and fuzzy based Taguchi method for the optimization of the EDM process with multiple process responses and investigated both approaches can improve process responses such as Electrode wear ratio, metal removal rate and surface roughness3. Singhs presented the application of the design of experiments and grey relational analysis (GRA) approach to optimize parameters for Electrical
Discharge Machining process of 6061 Al/Al2O3P/Zop
Aluminum metal matrix composites the experiments were planned based on an L18 orthogoanl array to determine the optimal setting. The metal removal rate, tool wear rate and surface roughness were selected as the evaluation criteria in the study. The optional combination of process parameters were determined by the gray relational grade obtained through GRA for multiple performance characteristics.
Pradhan et. al studied influence of the various machining process parameter such as peak current, pulse-on-time, dielectric flushing pressure and the duty ratio on the performance criteria like MRR, TWR, overcut and taper while machining Titanium super alloy (Ti – 6A1-4V) on the EDM and found the optimized parameter for MRR with condition larger the better, TWR, OC and taper with condition lower the better by using Taguchi technique which is used for single objective optimization8 Further more taguchi method with combination ANOVA has been adopted for the optimization of ultrasonic assisted micro – EDM process parameters for each single objective optimization8. Taguchi method capable of dealing with single objective optimization3. It is difficult to find a single optional combination of EDM process parameters for the performance characteristics as the process parameters influence them differently. Hence the optimization of multiple performance characteristic of EDM process can be efficiently resolved by the GRA technique which is totally different from the traditional statistical analysis. GRA provides an efficient solution to the uncertain, multi input and discrete data problems7. G. Kibria and B.R Saker studied the effect of different dielectrics such as Kerosene, deionized water, boron carbide (B4C) powder suspended Kerosene and deionized
water on the performance measures such as MRR, TWR, overcut and diameter variance and surface integrity during machining of Titamium ally (Ti-6A1-4V) and concluded that MRR is high with deionized water dialectric compoared to pure kerosene. TWR is also more when B4C – mixed.
Deionized water is used compared to pure kerosene. In the present paper the investigation is done on the Electrical discharge machining of Titanium super alloy with copper tool electrode , also found the optimized input parameters of Peak current, pulse on time ,pulse off time and tool lift time using Grey relational analysis.
2. Experimental Details
IJER@2014
Page 345
process parameters has been studied, those are the PulseCurrent(Ip), Pulse ON time(Ton), Pulse OFF time(Toff) and Tool
LIFT time(Tlift).Machining is carried out for 10 minutes for
every experiments and MRR and TWR are calculated for one minute for each experiment. The MRR and TWR are calculated by measuring the weight difference of work piece and electrode before and after machining using a digital weighing balance of type AY220 with precision 0.001gm, is shown in figure 3. The MRR and TWR are calculated as following.
T
wp
wp
MRR
(
1
2)
mg/minuteWhere
wp
1 andwp
2are the weights of the workpiece beforeand after machining, T is the machining time.
T wt wt
TWR( 1 2) mg/minute
Where
wt
1 andwt
2 are the weights of the workpiece before and after machining, T is the machining time.The process parameters are selected based on the preliminary experiments and machine operating conditions. Taguchi method is one of the most efficient tools for the analysis of manufacturing design. The design of experiments is based on Taguchi L27(34) orthogonal array shown in table 3 is taken for conducting the experiments. The levels and notations of the process parameters are given in table 2. and the experimental results of MRR and TWR tabulated in table 4.
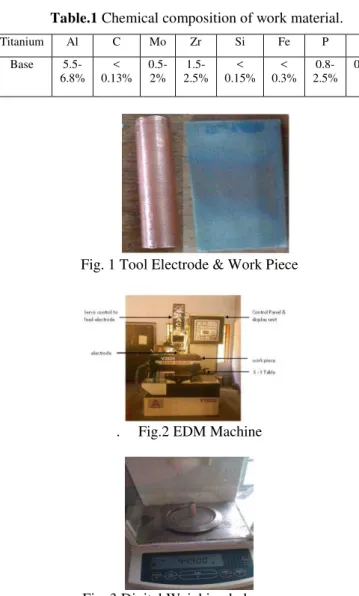
Table.1 Chemical composition of work material.
Titanium Al C Mo Zr Si Fe P V Base
5.5-6.8% < 0.13%
0.5-2%
1.5-2.5%
< 0.15%
< 0.3%
0.8-2.5%
0.3%
Fig. 1 Tool Electrode & Work Piece
. Fig.2 EDM Machine
Fig. 3 Digital Weighing balance
Table 2: Selected process parameters in EDM process Factor
notation Factor
Symbol & units
Level 1
Level 2
Level 3
A Peak Current I, Amp. 9 12 15
B Pulse On
time
TON, µs 10 20 50
C Pulse Off
time
TOFF, µs 50 50 100
D Tool LIFT time
TOFF, µs 5 10 20
Table 3 : L27 Orthogonal array
Sl. No.
Peak Current
Pulse ON time
Pulse
OFF Time Tool Lift Time
1 1 1 1 1
2 1 1 2 2
3 1 1 3 3
4 1 2 1 2
5 1 2 2 3
6 1 2 3 1
7 1 3 1 3
8 1 3 2 1
9 1 3 3 2
10 2 1 1 2
11 2 1 2 3
12 2 1 3 1
13 2 2 1 3
14 2 2 2 1
15 2 2 3 2
16 2 3 1 1
17 2 3 2 2
18 2 3 3 3
19 3 1 1 3
20 3 1 2 1
21 3 1 3 2
22 3 2 1 1
23 3 2 2 2
24 3 2 3 3
25 3 3 1 2
26 3 3 2 3
27 3 3 3 1
3.
Results and Analysis
3.1. Grey relational AnalysisIJER@2014
Page 346
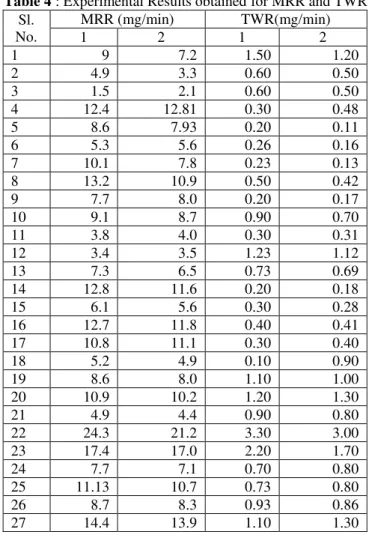
Table 4 : Experimental Results obtained for MRR and TWR Sl.
No.
MRR (mg/min) TWR(mg/min)
1 2 1 2
1 9 7.2 1.50 1.20
2 4.9 3.3 0.60 0.50
3 1.5 2.1 0.60 0.50
4 12.4 12.81 0.30 0.48
5 8.6 7.93 0.20 0.11
6 5.3 5.6 0.26 0.16
7 10.1 7.8 0.23 0.13
8 13.2 10.9 0.50 0.42
9 7.7 8.0 0.20 0.17
10 9.1 8.7 0.90 0.70
11 3.8 4.0 0.30 0.31
12 3.4 3.5 1.23 1.12
13 7.3 6.5 0.73 0.69
14 12.8 11.6 0.20 0.18
15 6.1 5.6 0.30 0.28
16 12.7 11.8 0.40 0.41
17 10.8 11.1 0.30 0.40
18 5.2 4.9 0.10 0.90
19 8.6 8.0 1.10 1.00
20 10.9 10.2 1.20 1.30
21 4.9 4.4 0.90 0.80
22 24.3 21.2 3.30 3.00
23 17.4 17.0 2.20 1.70
24 7.7 7.1 0.70 0.80
25 11.13 10.7 0.73 0.80
26 8.7 8.3 0.93 0.86
27 14.4 13.9 1.10 1.30
In the GRA to get the normalized values of “larger the better” type performance characteristics such as MRR with ith
experimental run jth response for each replication k is expressed as follows
ijk ijk
ijk ijk
ijk
Min Max
x
min
For “lower the better” type performance variable such as tool wear rate i.e. tool wear rate. The normalized value is expressed as
ijk ijk
ijk Ijk Ijk
Min Max
Max x
For i = 1, 2, ……… 27, j = 1, 2 and k =1,2.
Where xijk is normalized value after grey rational generation,
ijk
is experimental value of ith experiment in jth response forkth replication, Min
ijk is the smallest value of
ijk, Max
ijk is the largest value of
ijkNormalization involves, the transferring the original sequence to the comparable sequence. The normalized data for each of the response of the process output i.e., MRR & TWR are furnished in Table 5.
3.2. Grey relational co-efficient
After normalization the reference sequence is identified from jth reponse in kth replication is called the ideal normalized result for the each response characteristics [7]. Normalization creates a new matrix. From this matrix the reference sequence is identified which is maximum of the
normalized values then GRC is calculated between the desired and actual experimental data.
The Grey relational co-efficient of ith experiment for jth
response in the kth replication is expressed as
ij.m ax m ax m in
ijk ijk
Where
jk is absolute value of the difference between Ideal sequences xojk and xijk ,
is the distinguishing coefficient in the range of 0 to 1. GRC is calculated by selecting proper distinguishing coefficient generally
= 0.5 is accepted [10]. In the present study same was considered. The Grey relational coefficients for MRR and TWR and Grey relational grade (GRG) are shown in table 6.Table 5: Normalization of Experimental results (Grey Relational Generation)
Sl. No.
MRR Normalized TWR Normalized
1 2 1 2
1 0.3289 0.2670 0.5625 0.6185
2 0.1491 0.0628 0.8437 0.8591
3 0.00 0 0.8437 0.8591
4 0.4780 0.5607 0.9375 0.8659
5 0.3114 0.3052 0.9687 0.9931
6 0.1666 0.1832 0.9500 0.9759
7 0.3771 0.2984 0.9593 0.9862
8 0.5131 0.4607 0.8750 0.8866
9 0.2719 0.3089 0.96875 0.9725
10 0.3333 0.3455 0.7500 0.7903
11 0.1008 0.0994 0.9375 0.9244
12 0.0833 0.0733 0.6468 0.6460
13 0.2543 0.2303 0.8031 0.7938
14 0.4956 0.4974 0.9687 0.9690
15 0.2017 0.1832 0.9375 0.9347
16 0.4912 0.5078 0.9063 0.8900
17 0.4078 0.472 0.9375 0.8934
18 0.1622 0.1466 1 1
19 0.3114 0.3089 0.6875 0.6873
20 0.4122 0.4240 0.6563 0.5842
21 0.1491 0.1204 0.7500 007560
22 1.00 1 0 0
23 0.6973 0.7801 0.3437 0.4467
24 0.2719 0.2617 0.8125 0.7560
25 0.4224 0.4502 0.8031 0.7560
26 0.3157 0.3246 0.7406 0.7353
27 0.5657 0.6178 0.6875 0.5842
The overall multiple performance characteristics is based on the Grey relational grade, which is obtained by integrating the Grey relational coefficients corresponding to each experiment. All grey relational grades are calculated as.
m
i ijk i
m 1
1
Where m is the no of process responses,
i
is the grey rational grade for the ith experiment.IJER@2014
Page 347
optimization of the complicated multiple process responses canbe converted into optimization of single grey relational grade. Since the experiments are carried out on the basis of orthogonal experimental design which was designed by Tagachi. The effect of each level of the process parameters on the GRG can be independent. Table 8 shows the mean of the GRG for each level of the EDM process parameters1 and the average of the grey relational grade.
Table 6: Grey relational Coefficients, Grey grade Sl.
No.
GRC
GRG
MRR1 MRR2 TWR1 TWR2
1 0.4269 0.4055 0.5333 0.5672 0.4832 2 0.3701 0.3478 0.7618 0.7802 0.5649 3 0.3333 0.3333 0.7618 0.7801 0.9092 4 0.4892 0.5323 0.888 0.7885 0.6747 5 0.4206 0.4185 0.9411 0.9863 0.6916 6 0.3749 0.3797 0.909 0.9541 0.6544 7 0.4452 0.4161 0.924 0.9731 0.6897
8 0.5066 0.4811 0.8 0.8151 0.6507
9 0.4071 0.4197 0.9411 0.9478 0.6789 10 0.4285 0.4312 0.6667 0.7045 0.5577 11 0.3573 0.3569 0.8888 0.8686 0.6179 12 0.3529 0.3504 0.586 0.5855 0.4687 13 0.4014 0.3938 0.7175 0.708 0.5552 14 0.4978 0.4987 0.9411 0.941 0.7198 15 0.3851 0.3797 0.8888 0.8845 0.6345 16 0.4956 0.5039 0.8422 0.8196 0.6653 17 0.4578 0.4863 0.8888 0.8242 0.6643
18 0.3737 0.3694 1 1 0.6857
19 0.4206 0.4197 0.6154 0.6152 0.5177 20 0.4596 0.4647 0.5926 0.5459 0.5157 21 0.3701 0.3624 0.666 0.672 0.5177
22 1 1 0.3333 0.3333 0.6666
23 0.6228 0.6257 0.4324 0.4746 0.5388 24 0.4071 0.4037 0.7272 0.672 0.5525 25 0.4639 0.4763 0.7175 0.672 0.5824 26 0.4222 0.4253 0.6584 0.6538 0.5399 27 0.4691 0.5667 0.6154 0.5459 0.5492
3.3.
Analysis of VarianceAnalysis of variance(ANOVA) is used to find out which process parameters significantly affect the process response. The results of the ANOVA are shown in table 7. The F-test is used to determine which process parameters have a significant effect on the process response, when the F-value is large the change of process parameters has a significant effect on the process response. The results of the ANOVA shows that the peak current is the significant process parameter and pulse on time, pulse off time, tool lift time are the insignificant process parameters effecting the multiple process response. Fig 4 shows the grey relational graph to the mean response for overall grey relational grade, larger the grey relational grade, the better is the multiple process response. Hence the optimal machining parameters are pulse current at level 1, pulse on time at level 3, pulse off time at level 3 and tool lift time at level 3. i.e., A1B3C3D3.
3.4. Confirmation test
Once the optimal levels of EDM process parameters obtained, these parameters are used to predict the grey relation grade that represent the quality of the EDM process. Predicted grey relational grade is calculated as.
n
i
m m
predicted
1
0 )
(
Where
predicted is grey relational grade to validate the EDM process,
0 is the average grey relational grade of optimallevel of the factors.
m is the average grey relational grade and n is the number of factors. Finally the confirmation tests are conducted using the optimal EDM process parameters combination i.e., A1B3C3D3 for two trial. The average responses of MRR & TWR obtained from the confirmation experiments are 7.7 mg/min and 0.2 mg/min respectively.Table 7: Analysis of Variance Results at 95% confidence level
Source of Variation
Sum of Square
D OF
Mean sum of square
F –Ratio calculated
F – Ratio Table
Remarks
A 0.5795 2 0.028975 3.82558 3.55 Significant B 0.02201 2 0.011005 1.45299 3.55 Inignificant C 0.00376 2 0.00188 0.24822 3.55 Insignificant D 0.01 2 0.005 0.66015 3.55 Insignificant Error 0.136334 18 0.007575
Total 0.230054 26
Table 8: The Mean response table for the overall grey relational grade
Level I TON TOF T LIFT
1 0.66636 0.5725 0.5991 0.5971
2 0.6187 0.632 0.6115 0.6015
3 0.5533 0.634 0.6278 0.6399
Average of the Grey Relational Grade = 0.6179
Main Effects Plot for Grey Relational Grade
0.4 0.612
A1 A2 A3 B1 B2 B3 C1 C2 C3 D1 D2 D3
Machining Parameters
G
re
y
R
e
la
ti
on
a
l
G
ra
de
Fig. 4 Grey Relational Graph
Table 9: Results of performance measures for initial and optimal process parameters
Initial Machining Parameters
Optimal Machining Parameters Predicted Experimental
Combination level
A2B1C2D3 A1B3C3D3 A1B3C3D3
MRR mg/min 3.9 12.0 7.7
TWR mg/min 0.3 0.71 0.25
IJER@2014
Page 348
metal removal rate increased from 3.9 mg/min to 7.7 mg/minand TWR decreased from 0.3 mg/min to 0.2mg/min It is clearly
shows that the MRR and TWR are improved greatly.
4. Conclusion
In this paper presented the application of Grey relational analysis coupled with Taguchi design of experiments After applying the Grey relational method based on L27 orthogonal array, it is observed that the MRR increased and TWR decreased which are positive indicators of machining efficiency in the machining process, hence it can be concluded that this method is most suitable for the parametric optimization of EDM process and also the results of ANOVA shows that the pulse current is the most influencing factor for machining of Titanium super alloys.
References
i. Gopalakannan S, Senthi leval T and Ranganathan, Statistical optimization of EDM parameters on machining of Alluminium Hybrid metal Matrix composite by applying Tagnetic based grey analysis, Journal of Scientific and Industrial research, Vol. 72, June 2013, pp 358-365.
ii. S. Singh and M.F. Yeh, optimization of Abrasive powder mixed EDM of Aluminium matrix composites with multiple responses using grey relational analysis, Joural materials Engineering and performance Asian International 19th, April, 2011
iii. C.L. Lin, J.L. Lin and T.C. Ko, optimization of the EDM process based on the orthogonal array with fuzzy logic and grey relational analysis method, Int. Journal Advanced Manufacturing Technology (2002) 19 : 271-277 2002 Spinger – Verlag London limited.
iv. K .H. Ho and S.T. Newman, State of the art electrical discharge machining (EDM), International Journal of Machine tools & Manufacture 43 (20031287-1300.
v. Kibria, G. and Shaker B.R, B.B. Pradhan and B. Bhattacharya, comparative study of different dielectrics for micro EDM performance during micro hole machining of Ti-Al-4V alloy. International Journal of Advanced manufacturing technology (2010), 99. 557-570.
vi. El-Taweel, Multi-response optimization of EDM with Al-Cu-Si-Tic p/m composite electrode, Int. J. Adv. Manufacturing Technology (2009) pp :44 : 113.
vii. S. Singh, Optimization of machining characteristics in electric discharge machining of 6061 A1/Al2O3P/ZoP composites by
grey relational analysis, International Journal of advanced Technology 8, 6th February 2012 springer -0 verlag London limited. 2012.
viii. B.B. Pradhan, M. Masanta, B.R. Sarkar and B. Bhattacharyya, Investigation of electro – discharge micro – machining of Titanium super alloy, Int. J. Adv. Manuf. Technol (2009) 41 : 1094-1106.
ix. Murali M. Sundaram, Ganesh B. Pavalarajan and Kamalakar P. Rajurkar, A study on process parameters of Ultrasonic Assisted Micro EDM based on Taguchi method, Journal of materials Engineering and performance (2008) 17 : 210-215 ASM International.
x. Panneer Selvam. R (2012), Design andanalysis of experiments, PHI learning private limited, New Delhi.