Investigation on influence of stamp forming parameters on
formability of thermoplastic composite
Sugumar Suresh
1* and Velukkudi Santhanam Senthil Kumar
21
Velammal Engineering College, Mechanical Engineering, Anna University, Chennai, Tamil Nadu, India
2
College of Engineering Guindy, Mechanical Engineering, Anna University, Chennai, Tamil Nadu, India
*[email protected], [email protected]
Abstract
Advanced fabric reinforced polymer composites find extensive applications in aerospace and structural fields due to their high mechanical properties. A novel stamp forming technique finds extensive use in the hemispherical forming of thermoplastic composites. This study investigates the influence of stamp forming parameters on the formability of thermoplastic composite using Taguchi’s robust design and grey relational analysis. Taguchi’s orthogonal array was used for designing the forming experiments. Responses such as forming ratio and logarithmic thickness strain were considered for the assessment of sheet formability through single and multi-response optimization. Analysis of variance was used for the determination of the contribution of each parameter on formability and it was identified that the die temperature acts as a prominent factor, followed by blank holder force and blank temperature. The confirmation test was conducted at optimum parameter levels and the obtained experimental grade was seen within the confidence interval of the predicted value.
Keywords: thermoplastic composite, stamp forming, sheet formability, grey relational analysis, optimization.
1. Introduction
At present, advanced glass fabric reinforced thermoplastic (GFRTP) composites are found as substitutes for metals and thermoset composites due to their better impact, corrosion-resistance and fracture toughness properties[1]. The major driver of growth for the fabric reinforced thermoplastic composite in aerospace, automotive and sporting goods industries is the increasing requirement of recyclable, lightweight, and environment friendly products[2]. The higher durability feature of thermoplastic composites made them better suitable for crash applications than the thermoset composites. For mass production, the final product which yields a potential thermoplastic composite, can possibly be melt-shaped for fast and programmed processing. In thermoplastic composites, the advantages of stiff fibres are combined with those of the ductile thermoplastic matrix[3].
Currently, automotive industries are discovering novel and cost-effective processing technologies particularly in the field of press forming, tape laying and winding processes. The type of matrix and reinforcing materials determines the processing methods to be used. The processing techniques that have surfaced recently have utilized these advanced fabric reinforced composites to form complex-shaped parts for large volume production[4]. Stamp forming is widely seen as a fastest technique involving the deformation of the solid sheet material. Stamp forming is not well suited for thermosetting composites, as the molecular structure of the thermoset does not permit the material flow. This stamp forming approach is very well established as ideal for the forming of woven fabric-reinforced thermoplastic composites. As the temperature approaches the melting point of the
matrix, the thermoplastic composites can be softened with the ability to flow to fit into the die cavity[5]. Instabilities like buckling and wrinkling may occur during the formation of the woven fabric-reinforced composites into dome shaped parts. The processing parameters which mostly control the forming characteristics of stamp formed components, require optimization for the purpose of controlling the occurrence of wrinkling and other defects[6].
Nurul Fazita et al.[7] studied the impact of parameters on the existence of deformations in fabric reinforced poly-lactic-acid polymer composites and identified that the hot tooling conditions would provide better-quality domes. They observed the larger significance of wrinkles in the wrap direction of the composite domes in contrast with the weft direction. The influence of four parameters on the degree of crystallinity, shear strength, and part thickness were evaluated by Lessard et al.[8]. They found a notable contribution on part consolidation made by the stamping pressure and mold temperature. The emphasis of Ma et al.[9] was on the progress of a new stamping method for fiber reinforced polymers and optimized the process parameters using Taguchi’s split-plot designs. The outcomes depicted the correlation between the processing parameters and the shear stress. Zhu et al.[10] noticed the shear distribution during the forming as the outcome of both the sheet orientation and the mold shape. They carried out experiments on the optimization for the holding force, mold shape, forming temperature, sheet orientation and stamping speed.
Kalyanasundaram[11] who identified the preheat temperature
as the most significant factor in controlling the formability of composites, followed by the blank holder force for achieving quality parts. Kalyanasundaram et al.[12] studied the forming behavior of fiber metal laminates using the design of experiments technique, for understanding the effects of process parameters. They have presented the changes in formability of the materials by the recrystallization behavior. Vanclooster et al.[13] evaluated the influence of parameters on the formation of wrinkling and spring back using the fractional factorial design. The conclusion was that a high preheat temperature, a high deep drawing speed, a medium blank holder pressure, a low tool temperature and the expansion of additional polypropylene between the layers prompted a wrinkle free and full-grown composite. Lee et al.[14] did analysis of the impact of blank holding force on the shapes formed on non-crimp fabrics during the stamp forming process. Many researchers have done experimental and numerical formability analyses for woven fabric reinforced polymer composites[15-18].
Extensive knowledge has been developed for short/long fibre reinforced thermoplastic composites on the optimization and processing of product performance[19]. However, the development of continuous and woven fabric reinforced composites is still not up to the mark. In this study, the novel glass fabric reinforced polypropylene based thermoplastic composite is introduced to help analysis of its formability characteristics under double curvature dome forming. The objective is to investigate the influence of stamp forming process parameters on the formability, using single response and multi-response optimization. Taguchi’s L9 orthogonal array (OA) experimental design has been employed in the conduct of forming experimental runs. The significant contribution of each parameter on sheet formability was determined using the analysis of variance. The confirmation test was carried out at optimum parameter levels for the validation of the results of analysis.
2. Experimentation
2.1 Proposed methodology
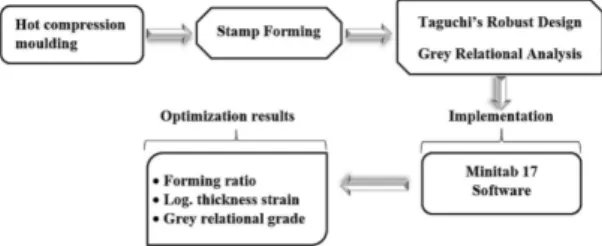
The conventionally available manufacturing process for thermoplastic composites is stamp forming, which has proved to be an optimal method for producing products with higher rates. In this study, the stamp forming experiment was conducted on the basis of Taguchi’s L9 orthogonal array. Taguchi technique uses a minimum number of experimental trials for finding effective solutions to the problems, by analyzing the entire process parameter space. Taguchi’s robust process design was used for solving the single response optimization problems. Grey Relational Analysis (GRA) which is an efficient technique for solving the multi-response problems[20], was implemented. GRA technique uses the grey relational coefficient and grey relational grade for optimizing the multi-response problems. The proposed methodology was analyzed using Minitab-17 software. The analysis identified the proposed multi-response optimization technique offering proof of being an optimal method for providing better formability characteristics during stamp forming of
thermoplastics. Figure 1 is the process flow chart of the proposed methodology.
2.2 Selection of materials
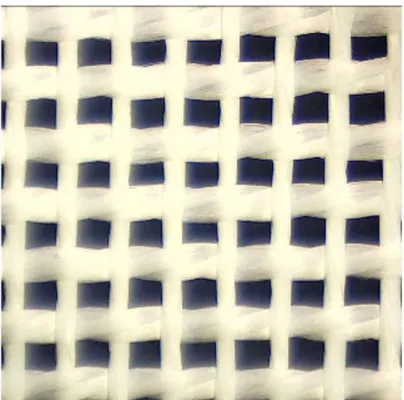
In this experimental work, an isotactic polypropylene (0.5mm film, ρ=0.905 g/cm3) reinforced with novel plain weave
(Figure 2) glass fabric (265 g/m2,ρ=2.54 g/cm3, f
v =19%)
thermoplastic composite fabricated through hot compression molding using film stacking approach was used for the stamp forming process[21]. The (3-aminopropyl) trimethoxy
silane and polypropylene grafted maleic anhydride[22] were used as the silane coupling agent and matrix compatibilizer, respectively for the purpose of improving the adhesion between the matrix and reinforcement.
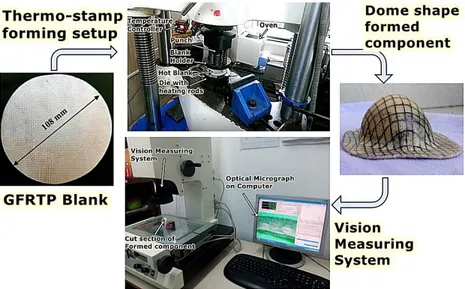
The GFRTP laminate was 300×300×2.2 mm3 in size and the novel glass fabrics were stacked in [0-90]4 sequence in the laminate. Water jet cutting was used for cutting the 108mm diameter circular composite blanks, from the novel plain weave reinforced thermoplastic laminate. This is shown in Figure 3.
2.3 Stamp forming setup
Stamp forming setup consists of a stamping die set, an oven which is used for heating the circular blank, a temperature controller unit used to monitor the heating of the steel die and the computer with data acquisition system[23].
The steel die and punch were attached on the 1000kN Universal Testing Machine (UTM). The punch which had a radius of 27.5 mm and the die of 30 mm radius with heating unit were connected to the upper base and lower base of UTM respectively, as shown in Figure 4. The hemispherical punch was used for the application of a uniform load in all directions of the circular blank.
2.4 Experimental design
Taguchi’s design of experiments approach was implemented for reducing the number of experimental runs and enabling the design of the stamp forming experiments. Three important process parameters such as, Die Temperature (DT), Blank Temperature (BT) and Blank Holder Force (BHF) that could affect the formability behavior of composites, were considered for the investigation[21]. Each stamp forming parameter had three distinct levels. These are illustrated in Figure 5. The process parameters were chosen on the basis of findings seen in literatures[7,8,24,25].
Before taking up the stamp forming process, each circular blank was pre-heated to the definite blank temperature in the oven and then transferred to the steel die. Similarly, before the forming process, the die was heated using four heating rods to the definite temperature. This was monitored using a temperature controller unit. During the stamp forming process, the designed BHF has been acting gradually on the heated blank using four sets of springs. The hemispherical punch moving at the rate of 85mm/min, caused deformation of the heated blank into the double curvature die cavity.
Following stamp forming, the stamp formed GFRTP component was taken from the steel die for formability analysis. The overall view of the works carried out in the present study is shown in Figure 6.
Figure 2. Novel plain weave glass fabric structure.
Figure 3. Circular composite blank.
Figure 4. Stamping die set.
3. Results and Discussions
3.1 Performance characteristics for formability
Deformations like in-plane shear, laminate buckling, transverse squeeze flow and matrix degradation that occurred in the blank required analysis for the enhancement of the composite sheet forming process. In this study, significant responses such as forming ratio and thickness strain were considered for the evaluation of the forming behavior of thermoplastic composites.
3.1.1 Forming Ratio (FR)
In the case of hemispherical forming, the formability could be determined by considering the maximum extent of possible deformation allowed by the blank. The forming ratio has a significant contribution in the composite sheet forming process[7,26].
2 2 min
2 2
o o
dome dome
r r
Area of Blank For g Ratio
Area of formed dome shape r h r h
π
= = =
π (1)
2 2
2 die dome
r h
r
h +
= (2)
Where,r0- Radius of circular blank; rdome- Radius of dome surface; rdie- Radius of die opening; h- Height of dome surface.
The draw depth of GFRTP stamp formed component, as illustrated in Figure 7, was measured using a Coordinate measuring machine and was converted into the forming ratio using Equation 1. The radius of dome surface in Equation 1, has been calculated using Equation 2. The draw depth of stamp formed component was considered as the height of the dome surface for the purpose of calculating the forming ratio.
3.1.2 Logarithmic Thickness Strain (LTS)
The flange thickness of GFRTP stamp formed component was measured using the Vision measuring system as shown
in Figure 6. The logarithmic thickness strain was calculated from the flange thickness for the evaluation of the variations in thickness that occurred in the profile. The calculation was done taking the natural logarithm of the ratio of the flange thickness (t) to the original blank thickness (to) using Equation 3[27].
( )
0
lnt t
Logarithmic thickness strain
t ε =
(3)
The forming experiments were carried out using Taguchi’s L9 Orthogonal array. The calculated values of the responses are given in Table 1.
3.2 Single response optimization
Optimization of the stamp forming parameters with single objective function was carried out using the Taguchi’s robust process design which helps reducing the effects of noise factors by determining the best levels for the control factors. Taguchi has designed three types of signal to noise ratios (S/N ratio), namely, larger-the-better, smaller-the-better and nominal-the-best on the basis of the nature of performance characteristics[28].
In this investigation, a smaller-the-better type S/N ratio has been considered for the minimization of the responses, namely, the forming ratio and log. thickness strain (absolute value). The S/N ratio for smaller-the-better type is given below. Figure 6. Photographic view of works carried out in the present study.
10 2 1
1 1
10 log r
i i
S ratio
N =− r∑= y (4)
Where, r = number of replications and yi = observed response value.
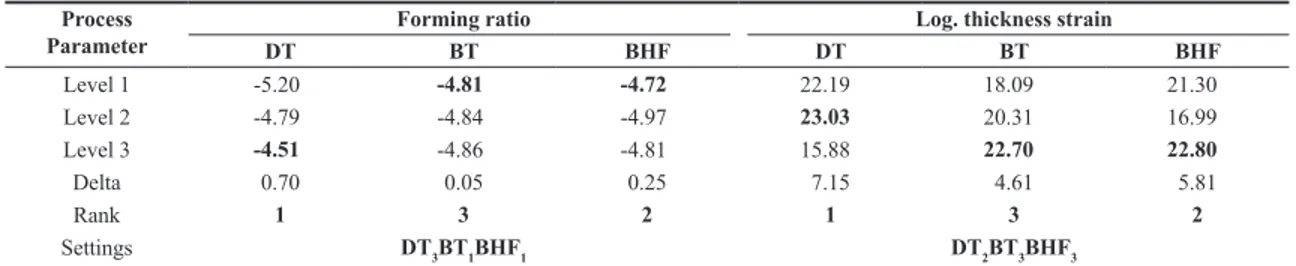
The calculated experimental responses were converted to the S/N ratio using Equation 4. The values are presented in Table 1. Regardless of the objective function, a larger S/N ratio corresponds to better performance characteristics. The average S/N ratio values of the forming ratio and the log. thickness strain for all the levels were calculated and are tabulated in Table 2. Based on the larger S/N ratio values, the optimal level setting was predicted as DT3BT1BHF1 and DT2BT3BHF3 for the forming ratio and log. thickness strain, respectively. The die temperature, blank temperature and the blank holder force were set at 170ºC, 170ºC, and 2kN respectively for the forming ratio; while the forming
parameters were set at 100ºC, 230ºC, and 8kN respectively for the log. thickness strain.
3.2.1 Analysis of variance
The purpose of analysis of variance (ANOVA) is to identify the most significant factor which would affect the performance characteristics. F-test was carried out for understanding the significance of the process parameters. The factor with high F-value is greatly significant in the effect on the response of the process. The effects of forming parameters, namely, die temperature, blank temperature and blank holder force on the responses were analyzed using Minitab-17 software. The ANOVA details of the forming ratio and the log. thickness strain, were calculated and are presented in Table 3. The contribution of each parameter indicates the degree of influence of that parameter on the formability characteristics and is highlighted in Table 3. The analysis shows clearly the die temperature as the most
Table 1. Taguchi’s L9 OA with process parameters, responses and S/N ratio.
Exp. runs
Process parameters Process responses S/N ratio
Die Temp. (°C) Blank Temp. (°C)
Blank Holder Force
(kN)
FR LTS FR LTS
1 30 170 2 1.79 0.079 -5.057 22.087
2 30 200 5 1.85 0.167 -5.343 15.543
3 30 230 8 1.82 0.036 -5.201 28.942
4 100 170 5 1.76 0.108 -4.910 19.361
5 100 200 8 1.73 -0.047 -4.761 26.647
6 100 230 2 1.72 0.070 -4.711 23.073
7 170 170 8 1.67 -0.229 -4.454 12.809
8 170 200 2 1.66 -0.116 -4.402 18.747
9 170 230 5 1.71 -0.157 -4.660 16.072
FR – Forming Ratio, LTS – Logarithmic Thickness Strain.
Table 2. Response table for forming ratio and log. Thickness strain.
Process Parameter
Forming ratio Log. thickness strain
DT BT BHF DT BT BHF
Level 1 -5.20 -4.81 -4.72 22.19 18.09 21.30
Level 2 -4.79 -4.84 -4.97 23.03 20.31 16.99
Level 3 -4.51 -4.86 -4.81 15.88 22.70 22.80
Delta 0.70 0.05 0.25 7.15 4.61 5.81
Rank 1 3 2 1 3 2
Settings DT3BT1BHF1 DT2BT3BHF3
DT – Die Temperature, BT – Blank Temperature, BHF – Blank Holder Force.
Table 3. Analysis of variance for forming ratio and log. Thickness strain.
Factor DoF
Forming ratio Log. thickness strain
SS MSS F
ratio
Contribution
(%) SS MSS
F
ratio
Contribution
(%)
DT 2 0.73189 0.3659 2930 88.01 91.71 45.85 1.93 40.63
BT 2 0.00378 0.0019 15 0.46 31.89 15.94 0.67 14.13
BHF 2 0.09568 0.0478 383 11.51 54.55 27.27 1.15 24.17
Error 2 0.00025 0.0001 0.03 47.58 23.79 21.08
Total 8 0.83161 100 225.73 100
DoF – Degrees of Freedom, SS – Sum of Squares,MSS – Mean Sum of Squares, DT – Die Temperature, BT – Blank Temperature, BHF – Blank
significant factor affecting the performance characteristics of the dome-shape formed components followed by the blank holder force and blank temperature for both the responses. However, considerable variations on the percentage contribution of each parameter were noticed between the responses. This is highlighted in Table 3.
3.3 Multi-response optimization
The multi-response optimization problem could be transformed into a single response optimization problem with the grey relational grade as the objective function[29], using grey relational analysis. The S/N ratio values of the forming ratio and log. thickness strain of the stamp formed components, presented in Table 1, were analyzed for a study of the effects of the stamp forming parameters. Normalization is a transformation done on a single input data for the even distribution of data and scaling it into an acceptable range. The S/N ratio values of the responses require normalization from zero to one for the purpose of optimizing the stamp forming process. The process of normalizing the responses is known as the grey relational generation, wherein both the responses (i.e.) forming ratio and log. thickness strain, should follow the smaller-the-better type problem that could be expressed as in Equation 5.
( )
max( )
( )
( )
( )
max min
i i
i
i i
y k y k
x k
y k y k
− =
− (5)
Where, x ki
( )
is the grey relational generation, max y ki( )
is the highest value of y ki( )
for the kth response and min( )
iy k is the lowest value of y ki
( )
for the kth response. Using Equation 5, the S/N ratio of the responses were normalized. Details are presented in Table 4. Grey relational coefficient (GRC) ξi( )
k was calculated on the basis of the normalized values for showing the relationship between the desired and the actual experimental values, using Equation 6. An ideal sequence for the responses is x0( )
k at(
k=1,2,..)
.min max
( ) max
( )
i
oi K
k ∆ + ς∆
ξ =
∆ + ς∆ (6)
Where, ∆0i( )k = x0( )k −x ki( ) the real value of the difference between x k0( )andx ki( ), ςis distinguishing coefficient (0_1);
min
∆ smallest value of ∆oi; and ∆max largest value of ∆oi. Using Equation 7[30], the weighted grey relational grade ( )g was calculated from the grey relational coefficients of
the selected responses.
1 ( ) ( )
n
i k i i
g =∑ = w k ξ k (7)
Where, n - number of responses, w - weight of the kth response. As stated in the Literatures[30,31], the weights were assigned on the basis of the engineering or decision makers’ judgments. However, in a real case, it is still very difficult to define a particular weight for each of the responses. Hence, the weights are assigned on the basis of the significance of the responses[32]. In this investigation of composite sheet forming, the significance of the forming ratio response was seen as much higher than that of the log. thickness strain response. Henceforth, the weights for the responses were assigned as given in Table 4[28,33]. The grey relational coefficients of forming ratio and log. thickness strain and the weighted grey relational grades for the four cases were calculated and have been tabulated in Table 4.
3.3.1 Optimum level of factors
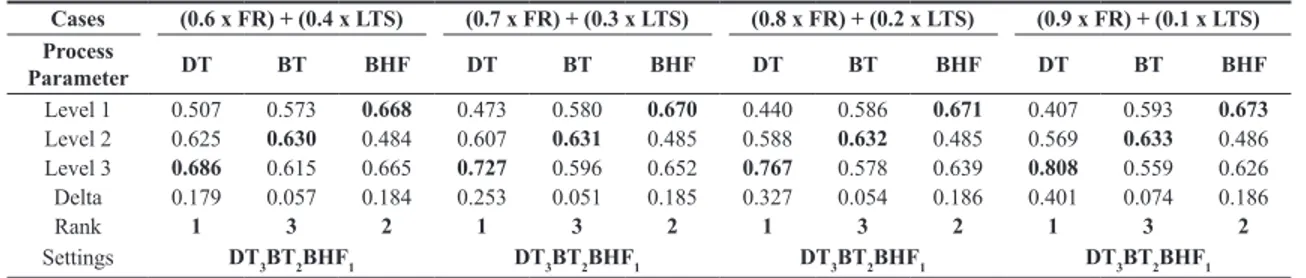
Maximization of weighted grade leads to the better product quality. Hence, the effect of factor was estimated on the basis of the weighted grade. The average grey relational grade was calculated for each level of factors in the four cases. Details are presented in Table 5, along with the optimum level of factors. The optimal forming parameters setting was predicted from the highest grey relational grade of the levels[29,34]. The response table (Table 5) shows the predicted optimal level setting for all four cases as DT3BT2BHF1. The die temperature, blank temperature and the blank holder force were set at 170ºC, 200ºC, and 2kN respectively.
3.3.2 Analysis of variance
The ANOVA details of weighted grey relational grade for the four cases are presented in Tables 6 and 7. The analysis clearly shows the die temperature as the most significant factor[8] followed by the blank holder force and blank temperature for all the four cases, in affecting the performance characteristics of dome-shape formed
Table 4. Normalized values, grey relational coefficients and weighted grades of the responses.
Exp. Runs
Normalized Values Grey Relational Coefficient Weighted Grey Relational Grades
FR LTS FR LTS 0.6 x FR +
0.4 x LTS
0.7 x FR + 0.3 x LTS
0.8 x FR + 0.2 x LTS
0.9 x FR + 0.1 x LTS
1 0.288 0.778 0.413 0.692 0.528 0.500 0.473 0.446
2 0.000 0.320 0.333 0.424 0.369 0.360 0.351 0.342
3 0.095 1.000 0.356 1.000 0.622 0.559 0.496 0.434
4 0.486 0.628 0.493 0.573 0.518 0.509 0.499 0.490
5 0.637 0.944 0.579 0.899 0.700 0.667 0.634 0.601
6 0.688 0.607 0.616 0.560 0.657 0.644 0.631 0.617
7 0.947 0.000 0.904 0.333 0.673 0.730 0.787 0.844
8 1.000 0.587 1.000 0.548 0.819 0.864 0.910 0.955
9 0.739 0.371 0.657 0.443 0.565 0.585 0.605 0.626
components. With increase in the weightage of forming ratio, the contribution of die temperature increased from 37.5% to 77.2%, whereas the contribution of blank holder force and blank temperature decreased from 50% to 17.9% and from 3.9% to 2.2% respectively.
3.4 Predicted optimum condition
The optimum level of factors obtained on the basis of experiments was DT3BT2BHF1 for all the four cases of multi-response optimization. The grey relational grade was predicted for all the cases using Equation 8[34]. The average grey relational grade values of the factors at their optimum levels are taken from Table 5, in order to calculate the predicted grade value. The overall average grey relational grade (T) was calculated by averaging the grey relational grades of all the factors.
( ) 3 2 1 2
Grey Relational Grade predicted =DT +BT +BHF− T (8)
3.4.1 Confirmation run
The confirmation experiment was performed by setting the forming parameters at the optimum levels. The die temperature, the blank temperature and the blank holder force were set at 170ºC, 200ºC and 2kN respectively for all the four cases. The results are presented in the Table 8. The predicted and
confirmation experiment run values of the grey relational grade for the four cases of multi-response optimization problems are listed in Table 8 along with the draw depth and flange thickness of the stamp formed components. As with multi-response optimization, the confirmation experiment was conducted for single response optimization problems and the details are presented in Table 8.
The confidence interval (C.I.) and effective sample size were calculated using Equations 9 and 10[35].
(1, )
. . error df of error
eff
MSS
C I F
n α
= (9)
Where, Fα(1, df of error) is table F-value at given significance
level, MSSERROR is mean sum of squares of error, neff is effective sample size
1.286
(1
)
eff
Total number of experimental runs n
Total DoF associated with items used in estimating the predicted mean grade
= + = (10)
Details of the 90% confidence interval of the predicted grade values are presented in Table 8. The experimental grade values of the multi-response optimization problems were seen lying well within the confidence interval of the corresponding predicted values, showing the good matching of the predicted grey relational grades with the experimental Table 5. Response table for weighted grey relational grades (Cases: 1 to 4).
Cases (0.6 x FR) + (0.4 x LTS) (0.7 x FR) + (0.3 x LTS) (0.8 x FR) + (0.2 x LTS) (0.9 x FR) + (0.1 x LTS) Process
Parameter DT BT BHF DT BT BHF DT BT BHF DT BT BHF
Level 1 0.507 0.573 0.668 0.473 0.580 0.670 0.440 0.586 0.671 0.407 0.593 0.673
Level 2 0.625 0.630 0.484 0.607 0.631 0.485 0.588 0.632 0.485 0.569 0.633 0.486
Level 3 0.686 0.615 0.665 0.727 0.596 0.652 0.767 0.578 0.639 0.808 0.559 0.626
Delta 0.179 0.057 0.184 0.253 0.051 0.185 0.327 0.054 0.186 0.401 0.074 0.186
Rank 1 3 2 1 3 2 1 3 2 1 3 2
Settings DT3BT2BHF1 DT3BT2BHF1 DT3BT2BHF1 DT3BT2BHF1
DT – Die Temperature, BT – Blank Temperature, BHF – Blank Holder Force, FR – Forming Ratio, LTS – Logarithmic Thickness Strain.
Table 6. Analysis of variance for weighted grey relational grades (Cases: 1 and 2).
Cases: 1 and 2 (0.6 x FR) + (0.4 x LTS) (0.7 x FR) + (0.3 x LTS)
Factor DoF SS MSS F-ratio Contribution (%) SS MSS F-ratio Contribution (%)
DT 2 0.04985 0.0249 4.34 37.42 0.09618 0.0481 12.07 56.35
BT 2 0.00516 0.0026 0.45 3.88 0.00404 0.0020 0.51 2.37
BHF 2 0.06673 0.0334 5.81 50.09 0.06251 0.0313 7.85 36.62
Error 2 0.01148 0.0057 8.62 0.00797 0.0040 4.67
Total 8 0.13323 100 0.17069 100
DoF – Degrees of Freedom, SS – Sum of Squares, MSS – Mean Sum of Squares, DT – Die Temperature, BT – Blank Temperature, BHF – Blank Holder Force, FR – Forming Ratio, LTS – Logarithmic Thickness Strain.
Table 7. Analysis of variance for weighted grey relational grades (Cases: 3 and 4).
Cases: 3 and 4 (0.8 x FR) + (0.2 x LTS) (0.9 x FR) + (0.1 x LTS)
Factor DoF SS MSS F-ratio Contribution (%) SS MSS F-ratio Contribution (%)
DT 2 0.16088 0.0804 24.51 69.47 0.24397 0.1220 33.53 77.23
BT 2 0.00504 0.0025 0.77 2.18 0.00816 0.0041 1.12 2.58
BHF 2 0.05910 0.0295 9.00 25.52 0.05650 0.0283 7.77 17.89
Error 2 0.00656 0.0033 2.83 0.00728 0.0036 2.30
Total 8 0.23158 100 0.31590 100
grey relational grades for the optimum process parameter setting. For the forming ratio, the experimental value was not seen lying within the C.I. of predicted values. Similarly, for log. thickness strain, the range of C.I. was very huge due to a high % error in the ANOVA results. Hence, the optimal settings of single response optimization problems did not provide the desired values.
3.4.2 Comparison between single and multi-response optimization In the case of the single response optimization, the optimal forming parameters setting were 170ºC, 170ºC, and 2kN respectively for the forming ratio and 100ºC, 230ºC, and 8kN respectively for the log. thickness strain. In the case of multi-response optimization, the optimal forming parameters setting were 170ºC, 200ºC, and 2kN respectively for all the four cases.
The draw depth (29.25 mm) and flange thickness (1.96 mm) of the stamp formed component obtained at the multi-response optimization problems were found to be better than the corresponding values of the single response optimization problems. The conclusion from the study is that the stamp formed components obtained have better performance characteristics in the multi-response optimization, instead of in a single response optimization.
3.5 Effects of process parameters on forming ratio
The measured draw depth was transformed into meaningful performance characteristic such as the forming ratio for effective assessment of the forming behavior. The typical forming ratio for the maximum draw depth formed component was 1.62. This was obtained by considering the height of dome surface as equal to the radius of the die. Figure 8 is the plotting of the forming ratio of GFRTP components under various experimental runs. It reveals the achievement of the forming ratio closer to that of the typical value of 1.62 for the experimental runs no.7 to no.9. This observation indicates the components formed under high die temperature process conditions as attained the larger draw depth, closely approaching the typical forming ratio. This could be due to the reduced flow resistance for the blank as a result of low temperature difference between the heated blank and hot die.
The blanks formed under low BHF (experimental runs no.1, no.6 and no.8) achieved a reasonably good forming ratio but exhibited wrinkling around the flange and buckling in the dome bend area as shown in Figures 9 and 10[24]. The increase in rate of flow of the blank from the outer region of flange developed a severe strain on the blank elements due to the high circumferential compressive stress, which led to the formation of wrinkling at low BHF. However, the increase Table 8. Grey relational grade values of predicted and experimental runs.
Optimum setting Predicted grade
Experimental grade
Confidence Interval
Draw depth (mm)
Flange thickness (mm)
Case 1 DT3BT2BHF1 0.772 0.819 0.578 to 0.966 29.25 1.96 Case 2 DT3BT2BHF1 0.822 0.864 0.659 to 0.985 29.25 1.96 Case 3 DT3BT2BHF1 0.873 0.910 0.725 to 1.021 29.25 1.96 Case 4 DT3BT2BHF1 0.923 0.955 0.768 to 1.078 29.25 1.96
FR DT3BT1BHF1 -4.40 -4.91 -4.43 to -4.37 28.89 1.98
LTS DT2BT3BHF3 16.76 27.04 4.20 to 29.32 27.50 2.30
FR – Forming Ratio, LTS – Logarithmic Thickness Strain.
Figure 8. Forming ratio of components for the various experimental
runs.
Figure 9. Wrinkles in GFRTP components.
Figure 11. Logarithmic thickness strain for the experimental runs.
Figure 12. Microscopic image of the specimen at the flange. in BHF caused a big reduction in the prevalence of defects, but with a slight reduction in the forming ratio. The increased flow resistance at high BHF simultaneously increased the radial tensile stress on the blank, which in turn regulated the flow of blank by controlling the circumferential stress and also minimized the occurrence of wrinkling.
The increase in blank temperature caused a significant reduction in the resin viscosity with simultaneous enhancement of the fluidity of the resin. However, the further increase in blank temperature led to the sticking of matrix resin on the punch and die surfaces which caused diminution in the surface quality of the components formed. The blanks formed under high blank temperature (experimental runs no.3, no.6 and no.9) were subjected to severe degradation as a result of the oxidation of matrix.
3.6 Effects of process parameters on logarithmic thickness strain
The logarithmic thickness strain was used for the estimation of the amount of thinning and thickening that occurred on the flange portion of the stamp formed components. The logarithmic thickness strain of GFRTP stamp formed components under various experimental runs has been plotted (Figure 11). Compared to the initial blank thickness, the components formed under high die temperature conditions were up to 22% thinner, whereas the low die temperature formed components were up to 16% thicker at the flange portion[8]. The reason is that the high temperature difference between the heated blank and die, made the blank to solidify
at the faster rate and led to the formation of a severe wrinkling on the surface of components, which in turn increased the flange thickness.
Fibre buckling was observed when the blank holder force acting on the blank fell below the circumferential compressive stress as shown in the microscopic image (Figure 12) of the specimen, at the flange portion. This in turn caused an increase in the flange thickness[25]. As elaborately discussed in the previous section, the components formed under low BHF showed a relatively high wrinkling than the high BHF components, as a result of high circumferential stress on the blank elements. The conclusion from the experimental results is that the flange thickness depends on the amount of temperature difference as well as the frictional force between the heated blank and the die.
4. Conclusion
The focus of this experimental investigation was the influence of stamp forming parameters on the formability of thermoplastic composite using Taguchi based grey relational analysis for single and multi-response optimization problems. The following conclusions are drawn:
• The analysis helped the identification of die temperature acting as a prominent factor, followed by the blank holder force and blank temperature in controlling
the performance characteristics of stamp formed
components for both single and multi-response optimization problems;
• Compared to single response optimization, Taguchi based multi-response optimization is found to be a very powerful
tool for predicting the performance characteristics in
the stamp forming of GFRTP composite;
• The conclusion from the grey relational analysis is that the stamp formed components could be obtained with better performance characteristics at the die temperature of 170°C, blank temperature of 200°C and blank holder force of 2kN process condition;
• Stamp forming process produced the hemispherical components with the maximum draw depth of 29.25 mm and flange thickness of 1.96 mm, without much wrinkling and defects;
• Confirmation test results helped the verification of optimum process parameter levels determined and the experimental grade obtained lies well within the confidence interval of the predicted value;
• The increase in die temperature resulted the improvement in the forming ratio by reducing the flow resistance between the heated blank and die, but a decrease in the flange thickness of the components;
• The increase in blank holder force caused a slight reduction in the forming ratio and the flange thickness but improved the quality of the profile obtained; • The change in blank temperature has been identified
5. Acknowledgements
The authors wish to thank Anna University and Velammal Engineering College, Chennai for the help rendered in preparing the laminates and conducting the stamp forming experiments.
6. References
1. Hufenbach, W., Böhm, R., Thieme, M., Winkler, A., Mäder, E., Rausch, J., & Schade, M. (2011). Polypropylene/glass fibre
3D-textile reinforced composites for automotive applications.
Materials & Design, 32(3), 1468-1476. http://dx.doi.org/10.1016/j. matdes.2010.08.049.
2. Spadetti, C., Silva, E. A. D., Fo., Sena, G. L. D., & Melo, C.
V. P. D. (2017). Thermal and mechanical properties of
post-consumer polypropylene composites reinforced with cellulose
fibers. Polímeros: Ciência e Tecnologia, 27(Special), 84-90.
http://dx.doi.org/10.1590/0104-1428.2320.
3. Rietman, B., Niazi, M. S., & Akkerman, R. (2013). FibreChain: characterization and modeling of thermoplastic composites processing. In Proceedings of the Texcomp-11 Conference (p. 1-7). Leuven, Belgie: S. V. Lomov.
4. Yanagimoto, J., & Ikeuchi, K. (2012). Sheet forming process
of carbon fiber reinforced plastics for lightweight parts.CIRP Annals-Manufacturing Technology, 61(1), 247-250. http://
dx.doi.org/10.1016/j.cirp.2012.03.129.
5. Mehat, N. M., Kamaruddin, S., & Othman, A. R. (2014).
Hybrid integration of taguchi parametric design, grey relational analysis, and principal component analysis optimization for plastic gear production.Chinese Journal of Engineering, 351206. http://dx.doi.org/10.1155/ 2014/351206.
6. Davey, S., Cantwell, W., Das, R., & Kalyanasundaram, S. (2012).
Investigation into the formability of carbon fibre/polyether ether ketone composite sheets in stamp forming processes. In
Proceedings of the 15th European Conference on Composite Materials (p. 1-8). Venice, Italy: ECCM. Retrieved in 2017,
November 28, from http://www.escm.eu.org/eccm15/data/
assets/666.pdf
7. Nurul Fazita, M. R., Jayaraman, K., & Bhattacharyya, D. (2016). Formability analysis of bamboo fabric reinforced poly
(Lactic) acid composites.Materials (Basel), 9(7), 539. http://
dx.doi.org/10.3390/ma9070539. PMid:28773662.
8. Lessard, H., Lebrun, G., Benkaddour, A., & Pham, X. T. (2015).
Influence of process parameters on the thermostamping of a
[0/90]12 carbon/polyether ether ketone laminate.Composites.
Part A, Applied Science and Manufacturing, 70, 59-68. http://
dx.doi.org/10.1016/j.compositesa.2014.12.009.
9. Ma, C. M., Yu, C. T., & Cheng, B. W. (2014). Optimization of stamp forming process for thermoplastic composites. Research Journal of Applied Sciences, Engineering and Technology, 7(8), 1568-1572. http://dx.doi.org/10.19026/rjaset.7.433. 10. Zhu, B., Yu, T. X., Zhang, H., & Tao, X. M. (2011).
Experimental investigation of formability of commingled woven
composite preform in stamping operation. Composites. Part B, Engineering, 42(2), 289-295. http://dx.doi.org/10.1016/j. compositesb.2010.05.006.
11. Venkatesan, S., & Kalyanasundaram, S. (2010). Finite element
analysis and optimization of process parameters during stamp
forming of composite materials. IOP Conference Series. Materials Science and Engineering, 10(1), 012138. http://
dx.doi.org/10.1088/1757-899X/10/1/012138.
12. Kalyanasundaram, S., Dharmalingam, S., Venkatesan, S.,
& Sexton, A. (2013). Effect of process parameters during
forming of self reinforced–PP based Fiber Metal Laminate.
Composite Structures, 97, 332-337. http://dx.doi.org/10.1016/j.
compstruct.2012.08.053.
13. Vanclooster, K., Van Goidsenhoven, S., Lomov, S. V., &
Verpoest, I. (2009). Optimizing the deep drawing of
multi-layered woven fabric composites.International Journal of Material Forming, 2(1), 153-156. http://dx.doi.org/10.1007/ s12289-009-0522-9.
14. Lee, J. S., Hong, S. J., Yu, W. R., & Kang, T. J. (2007). The
effect of blank holder force on the stamp forming behavior of non-crimp fabric with a chain stitch.Composites Science and Technology, 67(3), 357-366. http://dx.doi.org/10.1016/j. compscitech.2006.09.009.
15. Yin, H., Peng, X., Du, T., & Chen, J. (2015). Forming of
thermoplastic plain woven carbon composites: An experimental
investigation. Journal of Thermoplastic Composite Materials, 28(5), 730-742. http://dx.doi.org/10.1177/0892705713503668. 16. Trudel-Boucher, D., Fisa, B., Denault, J., & Gagnon, P. (2006).
Experimental investigation of stamp forming of unconsolidated
commingled E-glass/polypropylene fabrics. Composites Science and Technology, 66(3), 555-570. http://dx.doi.org/10.1016/j. compscitech.2005.05.036.
17. Haanappel, S. P., Ten Thije, R. H. W., Sachs, U., Rietman, B.,
& Akkerman, R. (2014). Formability analyses of uni-directional
and textile reinforced thermoplastics.Composites. Part A, Applied Science and Manufacturing, 56, 80-92. http://dx.doi. org/10.1016/j.compositesa.2013.09.009.
18. Shirani, M., Agahi, A., Sadough, S. A., & Biglari, F. R. (2006). Experimental and analytical analysis of thermoplastic reinforced composite sheet deep drawing. In Proceedings of the MATERIAUX (Vol. 1, No. 1). Dijon, France: French Federation
of Materials.
19. Taflick, T., Maich, É. G., Ferreira, L. D., Bica, C. I. D., Rodrigues,
S. R. S., & Nachtigall, S. M. B. (2015). Acacia bark residues as filler in polypropylene composites. Polímeros: Ciência e Tecnologia, 25(3), 289-295. http://dx.doi.org/10.1590/0104-1428.1840.
20. Jayaraman, P., & kumar, L. M. (2014). Multi-response
optimization of machining parameters of turning AA6063 T6 aluminium alloy using grey relational analysis in Taguchi
method. Procedia Engineering, 97, 197-204. http://dx.doi. org/10.1016/j.proeng.2014.12.242.
21. Suresh, S., & Senthil Kumar, V. S. (2016). Influence of
process parameters on the forming behaviour of thermoplastic composite: an experimental approach.International Journal of Printing. Packaging & Allied Sciences, 4(3), 1553-1564. 22. Mohaiyiddin, M. S., Lin, O. H., Akil, H. M., Yee, T. G.,
Adik, N. N. A. N., & Villagracia, A. R. (2016). Effects of
polypropylene methyl polyhedral oligomeric silsesquioxanes and polypropylene-grafted maleic anhydride compatibilizers on the properties of palm kernel shell reinforced polypropylene
biocomposites. Polímeros: Ciência e Tecnologia, 26(3), 228-235. http://dx.doi.org/10.1590/0104-1428.2038.
23. Zhang, Q., Cai, J., & Gao, Q. (2014). Simulation and experimental
study on thermal deep drawing of carbon fiber woven composites.
Journal of Materials Processing Technology, 214(4), 802-810.
http://dx.doi.org/10.1016/j.jmatprotec.2013.11.024. 24. Isogawa, S., Aoki, H., & Tejima, M. (2014). Isothermal
forming of CFRTP sheet by penetration of hemispherical punch.Procedia Engineering, 81, 1620-1626. http://dx.doi. org/10.1016/j.proeng.2014.10.201.
25. Davey, S., Das, R., Cantwell, W. J., & Kalyanasundaram, S. (2013). Forming studies of carbon fibre composite sheets in dome forming processes. Composite Structures, 97, 310-316.
http://dx.doi.org/10.1016/j.compstruct.2012.10.026. 26. Bhattacharyya, D., Bowis, M., & Jayaraman, K. (2003).
Composites Science and Technology, 63(3), 353-365. http://
dx.doi.org/10.1016/S0266-3538(02)00214-2.
27. Sadighi, M., Rabizadeh, E., & Kermansaravi, F. (2008). Effects of
laminate sequencing on thermoforming of thermoplastic matrix
composites. Journal of Materials Processing Technology, 201(1), 725-730. http://dx.doi.org/10.1016/j.jmatprotec.2007.11.239. 28. Vijayan, S., Raju, R., & Rao, S. R. K. (2009). Friction stir
welding of Al–Mg alloy: comparison of process parameter optimization between single and multi response using Taguchi
methodology. International Journal of Applied Engineering Research, 4(5), 709-725. Retrieved in 2017, November 28,
from https://www.ripublication.com/ijaerv4/ijaerv4n5_7.pdf
29. Haq, A. N., Marimuthu, P., & Jeyapaul, R. (2008). Multi
response optimization of machining parameters of drilling Al/SiC metal matrix composite using grey relational analysis in the Taguchi method.International Journal of Advanced Manufacturing Technology, 37(3), 250-255. http://dx.doi. org/10.1007/s00170-007-0981-4.
30. Kuo, Y., Yang, T., & Huang, G. W. (2008). The use of a
grey-based Taguchi method for optimizing multi-response simulation
problems. Engineering Optimization, 40(6), 517-528. http://
dx.doi.org/10.1080/03052150701857645.
31. Tong, L. I., Su, C. T., & Wang, C. H. (1997). The optimization
of multi-response problems in the Taguchi method.International
Journal of Quality & Reliability Management, 14(4), 367-380.
http://dx.doi.org/10.1108/02656719710170639.
32. Yang, T., & Chou, P. (2005). Solving a multiresponse
simulation-optimization problem with discrete variables using a multiple-attribute decision-making method.Mathematics and Computers in Simulation, 68(1), 9-21. http://dx.doi. org/10.1016/j.matcom.2004.09.004.
33. Sathiya, P., Aravindan, S., & Noorul Haq, A. (2006). Optimization
for friction welding parameters with multiple performance
characteristics. International Journal of Mechanics and Materials in Design, 3(4), 309-318. http://dx.doi.org/10.1007/
s10999-007-9037-z.
34. Vijayan, S., Raju, R., & Rao, S. K. (2010). Multiobjective
optimization of friction stir welding process parameters on aluminum alloy AA 5083 using Taguchi-based grey relation
analysis. Materials and Manufacturing Processes, 25(11), 1206-1212. http://dx.doi.org/10.1080/10426910903536782. 35. Panneerselvam, R. (2012). Design and analysis of experiments.
India: PHI Learning (P) Ltd.