International Journal of Advanced Biotechnology and Research (IJBR) ISSN 0976-2612, Online ISSN 2278–599X, Vol-7, Special Issue3-April, 2016, pp560-569 http://www.bipublication.com
Research Article
Morphometric measurement of the faults in Kerman province and its
relation with earthquake magnitude in Richter scale
Mostafa khabazi1*, Mohammad Javad Nazari2
, S.Ali Almodaresi3 and Amir Hosin Abotalb4 1*
Assistant professor, Department of Geography, Faculty of literature, Shahid Bahonar University of Kerman, Kerman, Iran
1
M.A student, Department of Surveying Engineering, Faculty of Engineering, Larestan Branch, Islamic Azad University.
2
Associate Professor, 3GIS&RS Department Yazd Branch, Islamic Azad University.
4
M.A .GIS&RS Department Yazd Branch, Islamic Azad University.
ABSTRACT
Iran is geographically one of the most prone regions to natural disasters especially earthquake in the world such that it is in the seventh place in Asia and the 13th place in the world regarding annual mean of the highest number of population at risk of earthquake. On the other hand, 32% of the area, 70% of the population, and 67% of the gross production of the country are located in regions prone to earthquake. Iran with its several faults is always prone to this terrible natural disaster and it is one of high risk regions regarding the earthquake. There is a mutual relation between fault and earthquake. It means that the number of faults in the region is effective on earthquake occurrence. On the other hand, every earthquake will cause creation of new faults. In present research, the faults in the region will be positioned using satellite images and their dimensions have been measured by GIS advanced techniques. Then, the relationship between fault length and earthquake magnitude will be studied and the amount of human and inhuman losses of earthquake have been estimated. Therefore, the potential and allometric power of a fault such as length, width, and depth of a fault has been estimated in occurrence of earthquake. Then the extension of ruptures resulted from earthquake has been determined in the area of fault and finally the region has been zoned into non-risky, low risk and high risk categories. Results show that there is a direct relationship between fault length and its magnitude in Richter scale. The longer the length of the fault, the earthquake will be more intensive. The highest frequency of earthquake associates to the west and northwest of the region under study meaning where faults are longer and denser.
Keywords: earthquake, allometry, morpho-tectonic, Kerman
INTRODUCTION
Faulting like earthquake has financial and physical risks for human being and if it occurs, it will be a potential risk for vital facilities of human being. For this reason, having information about possible losses of earthquake for being prepared for more suitable crisis management after earthquake occurrence is one of challenges faced by today human beings. One the other hand, geographically Iran is one of the most prone regions to natural disasters (especially earthquake) in the world such that it is in the seventh place in Asia and the 13th place
fault destroyed by earthquake, urban development and construction can be limited in order to minimize the losses after earthquake occurrence. Also, zoning the region into low risk and high risk ones can be effective in direction of preventing urban development in high risk regions.
Research background
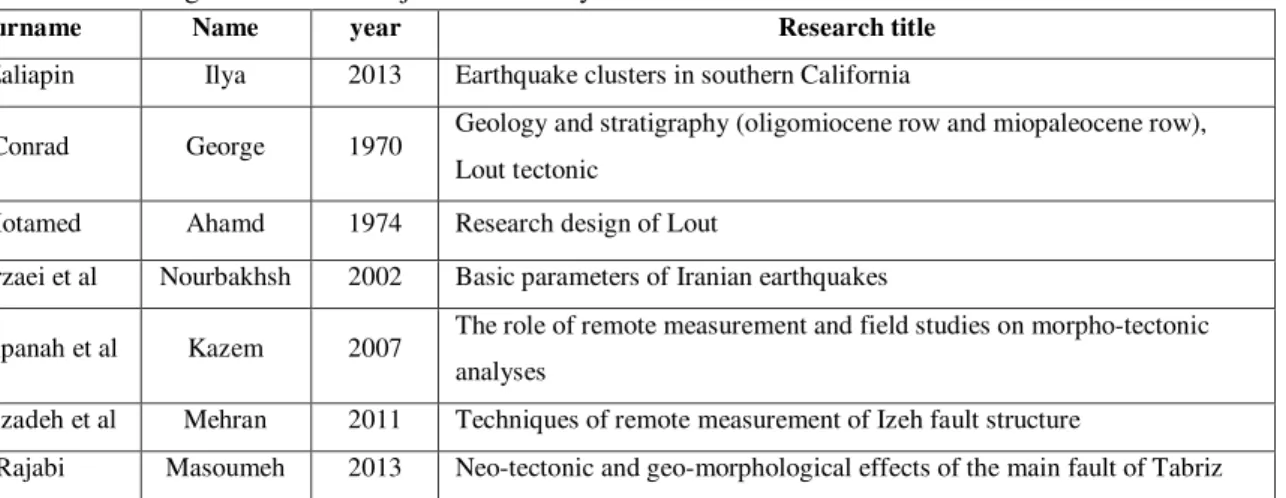
Several researches have been done on earthquake and morphometric effect of fault on earthquake magnitude and some of them have been summarized in table 1.
Table 1: research background on the subject under study
Surname Name year Research title
Zaliapin Ilya 2013 Earthquake clusters in southern California
Conrad George 1970 Geology and stratigraphy (oligomiocene row and miopaleocene row), Lout tectonic
Motamed Ahamd 1974 Research design of Lout
Mirzaei et al Nourbakhsh 2002 Basic parameters of Iranian earthquakes
Alavipanah et al Kazem 2007 The role of remote measurement and field studies on morpho-tectonic analyses
Azizizadeh et al Mehran 2011 Techniques of remote measurement of Izeh fault structure
Rajabi Masoumeh 2013 Neo-tectonic and geo-morphological effects of the main fault of Tabriz
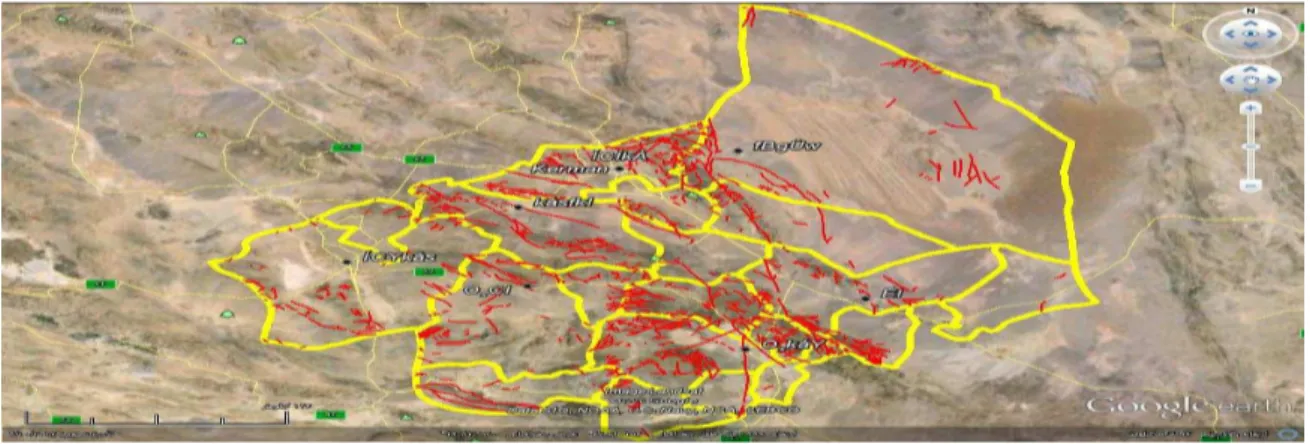
Geographical location of the region under study
Fig.1: geographical location of the region under study
Research methodology
- preparing maps required for the region with appropriate scale (125000 and 150000 maps in this
research)
- taking satellite images from the region with appropriate scales
- preparing geological maps from important faults in the region
- positioning and identifying faults in satellite images by ENVI software
- visiting the region and adapting fault maps with geological realities of the region
- adapting faults derived from satellite images with topographic maps of the region by ArcGIS software
- measuring dimensions of the faults of the region under study
- preparing statistical information from earthquakes occurred in recent years in faults of the region
under study
- studying the amount of earthquake magnitude occurred in identified faults and also expansion of the
rupture resulted from the earthquake
- calculating the possible relationship between fault dimensions and earthquake magnitudes of the fault,
expansion of rupture and the destruction
- summarizing and analyzing results and final conclusion
The main discussion
Faults of Kerman are towards north west-south east and to some extent to north-south and they are long faults that incline towards the west. The movement of these faults is right handed strike-slip and results from Katanga orogeny in the late Precambrian. Their trends agree with seismotectonic trends related to Katanga folding. These faults usually form the border between structural-sedimentary units in the region such that they cause changes in stone faces, thickness of sediments and seismotectonic alterations such as magmatism, deformation, and folding during geological periods.
The faults in this region form weak points of the crust so that energy centralized in the earth can be released from these points. Therefore, these faults are effective on seismicity of the region. In addition to main faults, small and subsidiary faults are seismic as well and they can create great earthquakes depending on the direction and type of pressures present in the earth.
Therefore, regarding the placement of recent earthquake centers on these faults (main and subsidiary), most of the faults in this region are active and high risk. Concerning the studies done in this regard, most of old faults of the region have right handed movement while current active faults are left handed strike-slip depending on the pressures. In addition, the amount of displacement is not similar in the fault and it may be compressive or tensile.
New movements of young faults are destroyed by erosion or vegetative coverage (buried faults). So the importance of these faults should not be ignored. However, such movements can be tracked by the signs appeared on the earth.
Classification of the faults in the region under study based on density and direction
By looking carefully at size & tectonic map of Kerman and studying the trend and direction of faults in macro view, The region under study can be investigated in three profiles based on fig.///.
Each profile with morphometric features will be analyzed allometrically.
Fig. /// profile and faults plotted on the region under study
A) Profile of northwest- northeast (A-B)
This profile (with the direction shown in fig.///) crosses cities and villages in north west and north east. The most important fault in this region is Kouhbanan fault with 300 kilometers long and it has extended from north of Kerman to northwest of Bahabad. This fault was firstly identified by Huckriede et al and its name was originated from the city of Kouhbanan. The fault divides into several parts in its passage (table)
Fig./// faults and domain of the profile A-B
Table: specifications of different parts of Kouhbanan fault
Name of fault Length in Km Distance from Kerman (in Km)
Kouhbanan 1 27 30
Kouhbanan 2 19 56
Kouhbanan 3 30 69
Kouhbanan 4 31 92
Kouhbanan 5 9 125
Kouhbanan 6 25 135
Kouhbanan 7 54 151
Kouhbanan 8 33 14
Kouhbanan 9 85 34
Kouhbanan fault displaces clearly young sediments in some points and it is observable in Gisak village in the boundary of mountain and desert (Shahpasand Zadeh & Heidari: 1996). This fault inclines to the northeast end and continues irregularly. In eastern part of Zarand, this fault has caused thrust of Precambrian formation on younger formations towards the western end (Triassic and Jurassic). This active fault is determined by great earthquakes with tensile faults. It is accounted as an active fault in Quaternary due to cuts in contemporary sediments and destructive earthquake at present time. Generally, the movements of this fault system are reverse and right handed strike-slip
Fig./// 3D model, overlay of digital terrain model with fault system of profile A-B
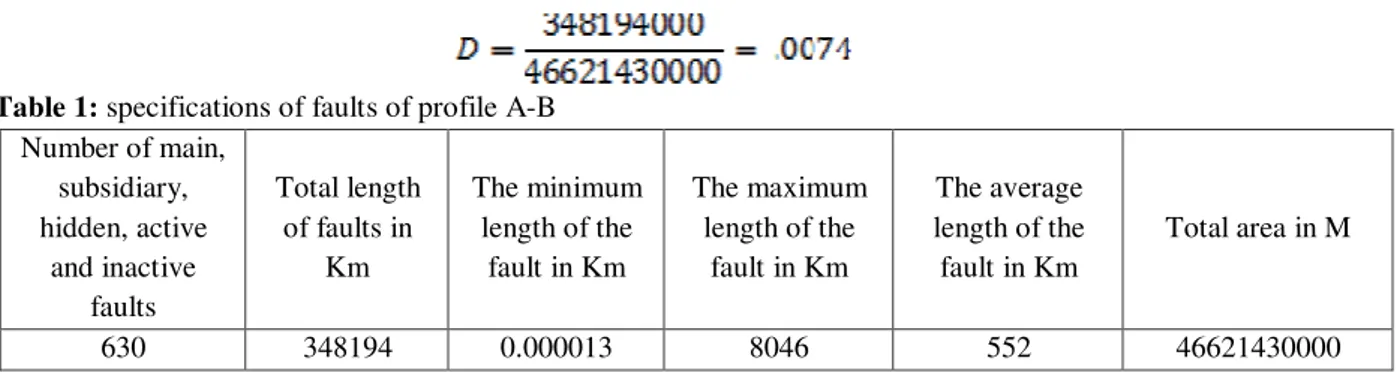
- Calculating fault density in profile (A-B)
In above relation, D is density, is total length of faults, A is the area
Table 1: specifications of faults of profile A-B
Total area in M
The average length of the fault in Km
The maximum length of the
fault in Km
The minimum length of the
fault in Km
Total length of faults in
Km Number of main,
subsidiary, hidden, active
and inactive faults
46621430000
552 8046
0.000013
348194
630
B) western-eastern fault (C-D)
There are three main faults of Golbaft, Bam, and Rafsanjan in this region and each of them will be illustrated as follows
- Gouk fault (Golbaft): this fault extends from south west of Bam desert to west of Shahdad with a north-south trend and it divides into two parts. Northern Golbaft is 49 km long with 44 km distance from Kerman. Southern Golbaft is 49 km long with 77 km distance from Kerman
Golbaft fault was mapped by Yugoslavian geologist in 1972 and is known as Sarvestan fault. Concerning that it is the center of several historical earthquakes and those of the contemporary age, it is one of the most active ad seismic faults in the province (Abbasnejad, Dastanpour, 1999). Several tectonic holes are seen along with this fault suggesting it is an active fault. The movement of these faults is reverse and right handed strike-slip.
Fig. ///: faults and the area of profile C-D
- Bam fault: this fault locates at 168 km from Kerman with 83 km long and it crosses Bam with north- northwest and south-southwest trends. This fault displaced Neogene sediments in the center of Bam desert and created a fault valley, the earthquake occurred in 2003 shows its seismicity.
- Rafsanjan fault: this fault locates at south of the city in the boundary of mountain and desert and extended with northwest-southeast trend and divided into several parts in the passage (table …)
Table: parts of Rafsanjan fault
Name of fault Length in km Distance from Kerman
Rafsanjan 1 51 148
Rafsanjan 2 73 95
Fig./// C-D section, overlay of fault layers on satellite images of Google earth
Fig.: 3D model, overlay of digital terrain model with fault system of profile C-D
- Calculation of fault density in profile C-D
Based on formula 1, fault density in the profile is 4.36. table … shows other specifications of faults
Table 2: specifications of faults of profile C-D
Total area in M
The average length of the fault in Km
The maximum length of the fault
in Km The minimum
length of the fault in Km
Total length of faults in
Km Number of main,
subsidiary, hidden, active and inactive faults of profile C-D
489114140000
594 8046
0.000013
650129
1093
C) Southwest-southeast profile (E-F)
Fig.: faults and areas of profile A-B
Fig….: section E-F, overlay of fault layers on satellite images of Google earth
Fig:3D model, overlay of digital terrain model with fault system of profile E-F
Fault density was obtained for this fault as follows
Table 3: specifications of faults of profile E-F
Total area in M The average
length of the fault in Km
The maximum length of the
fault in Km
The minimum length of the
fault in Km
Total length of faults in
Km Number of main,
subsidiary, hidden, active and inactive faults of profile E-F 25374881000 977 82 0.001 2484 254 CONCLUSION
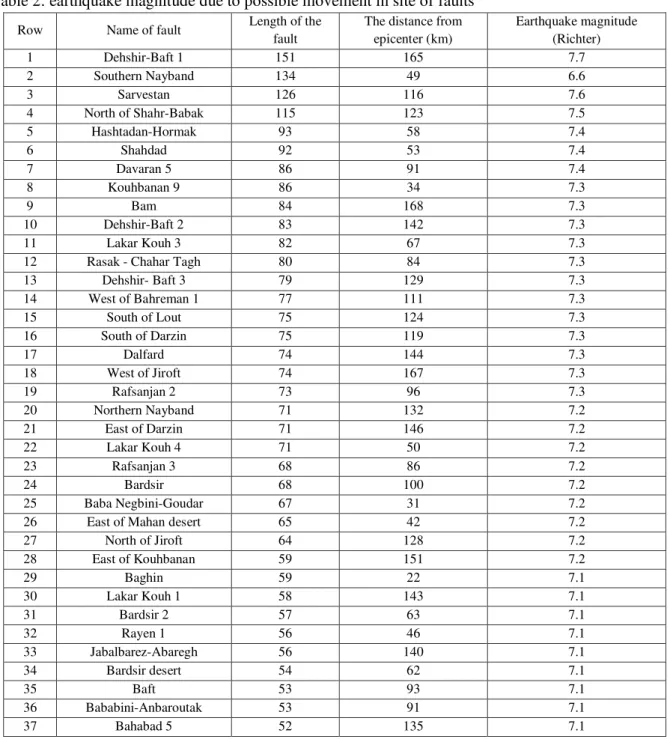
Concerning extraction of faults available in Kerman province and their morphometric studies, each part of fault was calculated in GIS setting and its relation with earthquake magnitude was measured. Results in table 2 showed that there is a significant relationship between fault length and earthquake magnitude in regions under study. The longer the fault, the earthquake will be more intensive.
Table 2: earthquake magnitude due to possible movement in site of faults
Row Name of fault Length of the
fault
The distance from epicenter (km)
Earthquake magnitude (Richter)
1 Dehshir-Baft 1 151 165 7.7
2 Southern Nayband 134 49 6.6
3 Sarvestan 126 116 7.6
4 North of Shahr-Babak 115 123 7.5
5 Hashtadan-Hormak 93 58 7.4
6 Shahdad 92 53 7.4
7 Davaran 5 86 91 7.4
8 Kouhbanan 9 86 34 7.3
9 Bam 84 168 7.3
10 Dehshir-Baft 2 83 142 7.3
11 Lakar Kouh 3 82 67 7.3
12 Rasak - Chahar Tagh 80 84 7.3
13 Dehshir- Baft 3 79 129 7.3
14 West of Bahreman 1 77 111 7.3
15 South of Lout 75 124 7.3
16 South of Darzin 75 119 7.3
17 Dalfard 74 144 7.3
18 West of Jiroft 74 167 7.3
19 Rafsanjan 2 73 96 7.3
20 Northern Nayband 71 132 7.2
21 East of Darzin 71 146 7.2
22 Lakar Kouh 4 71 50 7.2
23 Rafsanjan 3 68 86 7.2
24 Bardsir 68 100 7.2
25 Baba Negbini-Goudar 67 31 7.2
26 East of Mahan desert 65 42 7.2
27 North of Jiroft 64 128 7.2
28 East of Kouhbanan 59 151 7.2
29 Baghin 59 22 7.1
30 Lakar Kouh 1 58 143 7.1
31 Bardsir 2 57 63 7.1
32 Rayen 1 56 46 7.1
33 Jabalbarez-Abaregh 56 140 7.1
34 Bardsir desert 54 62 7.1
35 Baft 53 93 7.1
36 Bababini-Anbaroutak 53 91 7.1
38 Askar castle- Kouh Panj 52 83 7.1
39 Joupar 52 29 7.1
40 Rafsanjan 1 51 148 7.1
41 Kouhbanan 7 50 152 7.1
42 Bahabad 4 50 57 7.1
43 Northern Golbaft- Sirch 50 44 7.1
44 Gour- Hasanali castle 50 100 7.1
45 Southern Golbaft 49 78 7.1
46 Lakar Kouh 7 48 64 7
47 South of Baghin desert 48 38 7
48 Baghin 2 46 69 7
49 Ekhtiarabad (Alghadir) 45 16 7
50 Golousalar-Aliabad 45 43 7
51 Rafsanjan 3 45 79 7
52 Davaran 4 45 113 7
53 Mahan 1 44 16 7
54 Ravar 42 136 7
55 Hosseinabad-Jiroft 42 170 7
56 Gouykan-Hasanali castle 41 107 7
57 Sharif village 41 166 7
58 Lakar kouh 2 40 135 6.9
59 Ahmadabad-Ghodratabad 40 137 6.9
60 Bahabad 1 39 166 6.9
61 Ghataroyeh 39 60 6.9
62 Bahabad 3 39 97 6.9
63 Kenarouyeh 38 151 6.9
64 Davaran 1 37 25 6.9
65 Sardouyeh 37 117 6.9
66 Sarasiab-Andar 36 138 6.9
67 Dahouyeh 36 106 6.9
68 Bahabad 2 35 128 6.9
69 Gharyatol Arab 35 68 6.9
70 Kouhbanan 8 34 15 6.9
REFERENCES
1. Alavipanah, Kazem, 2007, the role of remote measurement and field studies on morpho-tectonic analyses, case study: Bam earthquake, geographical researches, No.60, Pp 15-29, 2007
2. Rajabi, Masoumeh, Soleimani Abolfazl, analysis, and evaluation of morpho-tectonic and neo-tectonic features of southern hill of Sabalan mountain, urban planning and geography, 17th period, No.45, 2013.
3. Aziz zadeh Mehran, Molamehr Alizadeh Fatemeh, structural analysis of Izeh fault in central part of Zagros using remote measuring techniques, researches of natural geography, 75th period, Pp 1-18, 2011
4. Shayan Siavash, Sokvand Habib, Sharifi kia Mohammad, measuring the relationship between fault length, earthquake magnitude,
failure zone and vertical displacement of the earth (case study: Silakhor desert), space logistics and planning, 15th period, No 2, 2011
5. Vazin, Nargis, 2007, Local and Modern Knowledg Roles in Reducing Environmental Hazards in Rural Areas. Case: Khoresh Rostam District- Khalkhal, M.A. Thesis presented in, Tarbiat Modares University. 6. Jaafari, M.K. and Saeedi, M., 1993, Public
Education Planning for Earthquake Risk Reduction, 1rd International Conference on Natural Hazard in Urban Area, 21