BGD
7, 787–822, 2010Increased bacterial growth efficiency with environmental
variability
M. Eichinger et al.
Title Page
Abstract Introduction
Conclusions References
Tables Figures
◭ ◮
◭ ◮
Back Close
Full Screen / Esc
Printer-friendly Version
Interactive Discussion Biogeosciences Discuss., 7, 787–822, 2010
www.biogeosciences-discuss.net/7/787/2010/ © Author(s) 2010. This work is distributed under the Creative Commons Attribution 3.0 License.
Biogeosciences Discussions
This discussion paper is/has been under review for the journal Biogeosciences (BG). Please refer to the corresponding final paper in BG if available.
Increased bacterial growth e
ffi
ciency with
environmental variability: results from
DOC degradation by bacteria in pure
culture experiments
M. Eichinger, R. Semp ´er ´e, G. Gr ´egori, B. Charri `ere, J. C. Poggiale, and D. Lef `evre
Universit ´e de la M ´editerran ´ee, LMGEM, CNRS/INSU, UMR 6117, Centre d’Oc ´eanologie de Marseille, Campus de Luminy, Case 901, 13288 Marseille Cedex 9, France
Received: 18 January 2010 – Accepted: 20 January 2010 – Published: 1 February 2010
Correspondence to: R. Semp ´er ´e ([email protected])
Published by Copernicus Publications on behalf of the European Geosciences Union.
BGD
7, 787–822, 2010Increased bacterial growth efficiency with environmental
variability
M. Eichinger et al.
Title Page
Abstract Introduction
Conclusions References
Tables Figures
◭ ◮
◭ ◮
Back Close
Full Screen / Esc
Printer-friendly Version
Interactive Discussion Abstract
This paper assesses how considering variation in DOC availability and cell mainte-nance in bacterial models affects Bacterial Growth Efficiency (BGE) estimations. For this purpose, we conducted two biodegradation experiments simultaneously. In exper-iment one, a given amount of substrate was added to the culture at the start of the
5
experiment whilst in experiment two, the same amount of substrate was added, but using periodic pulses over the time course of the experiment. Three bacterial mod-els, with different levels of complexity, (the Monod, Marr-Pirt and the dynamic energy budget (DEB) model), were used, and calibrated using the above experiments. BGE has been estimated using the experimental values obtained from discrete samples
10
and from model generated data. Cell maintenance was derived experimentally, from respiration rate measurements. The results showed that the Monod model did not reproduce the experimental data accurately, whereas the Marr-Pirt and DEB models demonstrated a good level of reproducibility, probably because cell maintenance was built into their formula. Whatever estimation method was used, the BGE value was
15
always higher in experiment two (the periodically pulsed substrate) as compared to the initially one-pulsed-substrate experiment. Moreover, BGE values estimated with-out considering cell maintenance (Monod model and empirical formula) were always smaller than BGE values obtained from models taking cell maintenance into account. Since BGE is commonly estimated using constant experimental systems and ignore
20
BGD
7, 787–822, 2010Increased bacterial growth efficiency with environmental
variability
M. Eichinger et al.
Title Page
Abstract Introduction
Conclusions References
Tables Figures
◭ ◮
◭ ◮
Back Close
Full Screen / Esc
Printer-friendly Version
Interactive Discussion 1 Introduction
Dissolved organic carbon (DOC) represents one of the largest active organic carbon reservoirs in the biosphere (Hedges, 1992; Amon and Benner, 1996). It is commonly assumed that numerous processes are responsible for DOC production such as its release by phytoplankton, egestion, excretion and sloppy feeding from grazers and
5
cellular lysis generated by viruses (Nagata, 2000). Bacteria are considered to be the major consumers and remineralisers of DOC in the ocean (Pomeroy, 1974; Williams, 2000). According to bacterial reactivity, DOC is usually fractionated into three pools: the refractory (R-DOC), semi-labile (SL-DOC) and labile DOC (L-DOC) (Williams and Druffel, 1987; Carlson and Ducklow, 1995; Hansell et al., 1995). Bacterial activity
10
is often measured using the bacterial growth efficiency (BGE). This is the proportion of DOC that is converted by bacteria into particulate organic matter (POC) that can be later consumed by higher trophic levels (Cajal-Medrano and Maske, 2005). The L-DOC component and BGE can be determined by measuring the bacterial DOC consumption in biological assays (Carlson and Ducklow, 1996; Cherrier et al., 1996; Semp ´er ´e et
15
al., 1998; Carlson et al., 1999). Both DOC production and consumption occur in the natural environment through different processes, therefore any experimental design must endeavour to uncouple these two processes in order to study either one or the other. Consequently, such experiments are generally performed over 1–2 weeks either by isolating natural assemblages of bacteria from the primary producers and grazers
20
by filtering in situ seawater samples, or by working with monospecific cultures.
It is generally assumed that the complementary proportion (1-BGE) corresponds to respiration and results in metabolic CO2 release in the ambient medium. BGE is
commonly used as a constant parameter in biogeochemical models (Baretta-Bekker et al., 1995; Blackburn et al., 1996; Anderson and Williams, 1998, 1999; Lancelot
25
et al., 2002), which are subsequently used to investigate the carbon cycle (Anderson and Williams, 1998, 1999). According to this, the general mathematical definition of BGE is: BGE=∆BB/−∆DOC, where ∆BB is the bacterial biomass produced from the
BGD
7, 787–822, 2010Increased bacterial growth efficiency with environmental
variability
M. Eichinger et al.
Title Page
Abstract Introduction
Conclusions References
Tables Figures
◭ ◮
◭ ◮
Back Close
Full Screen / Esc
Printer-friendly Version
Interactive Discussion consumption of available ∆DOC. However, BGE is generally determined
experimen-tally from bacterial production (BP) and respiration (BR) measurements, or from BP and bacterial carbon demand (BCD) according to the following formula: BGE=BP/BCD where BCD=BP+BR (del Giorgio and Cole, 1998; Semp ´er ´e et al., 1998; Rivkin and Legendre, 2001; Reinthaler and Herndl, 2005). BGE may also be estimated from
5
mathematical models as it often consists of a model parameter (Eichinger et al., 2006) or is a function of the specific growth rate (Cajal-Medrano and Maske, 1999, 2005).
Although biological assays provide a large set of BGE values, they are difficult to extend to real ecosystems due to the wide range of methods used and the utilisa-tion of conversion factors which also exhibit large variautilisa-tions (Cherrier et al., 1996;
10
del Giorgio and Cole, 1998). Despite this, previous studies have indicated that BGE varies greatly depending on biological and physical factors (del Giorgio and Cole, 1998) such as : DOC chemical nature/molecular weight (Amon and Benner, 1996; Cherrier et al., 1996), elemental ratio (Goldman et al., 1987), distance of the study site from the seashore (La Ferla et al., 2005), season (Reinthaler and Herndl, 2005),
tempera-15
ture (Rivkin and Legendre, 2001), depth (Eichinger et al., 2006) and UV exposure of dissolved organic matter prior to incubation (Abboudi et al., 2007). Moreover, batch experiments in which DOC monotonously decreases according to its consumption by bacteria are certainly not representative of the real world.
To date, to the best of our knowledge, there has been no study focusing on the
20
direct effects of DOC availability on BGE. Indeed, due to physical, chemical, and bi-ological processes (Carlson and Ducklow, 1995; Carlson et al., 2004; La Ferla et al., 2005), and to the decoupling between DOC production and consumption (Hansell et al., 1995; Carlson et al., 2002), the DOC concentration fluctuates spatially and tempo-rally in oceanic ecosystems. Thus, relatively weak temporal variations in the dynamics
25
BGD
7, 787–822, 2010Increased bacterial growth efficiency with environmental
variability
M. Eichinger et al.
Title Page
Abstract Introduction
Conclusions References
Tables Figures
◭ ◮
◭ ◮
Back Close
Full Screen / Esc
Printer-friendly Version
Interactive Discussion The first objective of this paper is to assess how the variation in DOC availability
and supply affects BGE values using experimental and modelling approaches simul-taneously. Most biogeochemical models use simplistic and empirical formulae to rep-resent DOC consumption and bacterial growth, which are respectively described with Michaelis-Menten kinetics and Monod formulation. Thus they do not take into account
5
cell maintenance, the importance of which has been highlighted in several studies (del Giorgio and Cole, 1998; Eichinger et al., 2009). The second aim of this paper is to highlight the cell maintenance process using biodegradation assays and varying DOC supplies, in order to study how this affects BGE estimates. For this purpose, we have used several bacterial growth models with different levels of complexity, some
consid-10
ering cell maintenance.
To meet these objectives, we performed two laboratory biodegradation experiments. In the first experiment, all the substrate was added at the beginning of the time series, whereas in the second experiment the same amount of substrate was divided into several smaller pulses and added to the culture every 2 days. Since the total quantity
15
of substrate is the same at the end of both experiments, the only difference is the substrate regime.
This paper is organised as follows: in the first section we present a detailed de-scription of the experiments carried out to assess the influence of the DOC load on BGE, and the various methods used for its estimation, including empirical
calcula-20
tions and model calibration. The different processes included in each model and their mathematical descriptions are given. The second section compares the experimental dynamics obtained from both experiments, and presents the calibration and simulation of the models. It also compares the BGE values estimated from both experiments, as obtained with each method. Finally, the last section presents the conclusions and
25
discusses their implication for BGE determined in aquatic ecosystems.
BGD
7, 787–822, 2010Increased bacterial growth efficiency with environmental
variability
M. Eichinger et al.
Title Page
Abstract Introduction
Conclusions References
Tables Figures
◭ ◮
◭ ◮
Back Close
Full Screen / Esc
Printer-friendly Version
Interactive Discussion 2 Material and methods
2.1 Main concepts
To prevent problems arising from the sensibility of DOC measurements, the lability of DOC and bacterial activity, we used a monospecific bacterial strain and a highly labile carbon substrate source. Thus, we assumed that the decrease in DOC concentration is
5
directly related to bacterial growth. We also applied an intensive sampling regime and used DOC concentrations well above oceanic conditions; the total L-DOC concentra-tion added to the cultures was 8 mM C whereas oceanic DOC concentraconcentra-tions generally range from 40 µM C to more than 200 µM C. In this study, we defined L-DOC as the substrate and thus the DOC that is consumed during the time course of the experiment
10
(with a turnover time of a few hours, approximately) whereas R-DOC was considered to be the DOC remaining at the end of the experiments. This R-DOC could consist of SL-DOC or R-DOC for our bacterial strain.
2.2 Experimental design
The culture medium was composed of artificial seawater (Lyman and Fleming, 1940),
15
containing vitamins, minerals and excess nutrients at the beginning of each experi-ment; KH2PO4and NH4Cl were provided at concentrations of 0.2 and 6.7 mM,
respec-tively, and the pH was adjusted to 7.5. Pyruvate was selected as the carbon substrate and Alteromonas infernus as the bacterial strain (refer to Eichinger et al., 2009, for the explanations of these choices). Each medium was autoclaved for 20 min at 110◦C
20
prior to inoculation. The cultures were incubated in a temperate room at 25±1◦C, in
the dark, and were continuously agitated. To prevent bacterial contamination, the ma-terial used to sample the batch cultures was sterilised by autoclaving 20 min at 110◦C, and all samples were handled under a laminar flow air hood. To prevent carbon con-tamination, all borosilicate glass materials used for the cultures and sample collection
25
BGD
7, 787–822, 2010Increased bacterial growth efficiency with environmental
variability
M. Eichinger et al.
Title Page
Abstract Introduction
Conclusions References
Tables Figures
◭ ◮
◭ ◮
Back Close
Full Screen / Esc
Printer-friendly Version
Interactive Discussion Two experiments were performed: one using a single substrate addition (B), and
one using pulse additions of substrate (P). In the case of experiment P, the initial con-ditions were: (DOC)=1.6 mM C and bacterial density=6.106cells cm−3 subsequently followed by pulse additions of DOC (1.6 mM C) every 48 h. The initial conditions set for experiment B were: (DOC)=8 mM C (equivalent to 5×1.6 mM C) and bacterial
5
density=6.106cells cm−3. The initial conditions set for experiment P were chosen so that; (1) DOC decrease and bacterial growth were substantial, (2) the pulse period was long enough to allow sample collection between subsequent pulses, and (3) substrate DOC was apparently exhausted and bacteria were in the stationary phase at the end of the pulse period. This latter condition was necessary to observe cell maintenance
10
when bacteria were in “starving” conditions.
The total volume of the culture enabled samplings to take place over 5 pulses. Both experiments were conducted in 5 litre pre-combusted borosilicate bottles filled with 4 (experiment P) or 3 (experiment B) litres of culture medium. Because of the large volumes needed for sampling experiment P, 3 replicate bottles were used and
succes-15
sively sampled. This setup made possible to use the same apparatus in both experi-ments. We checked reproducibility by carrying out the same experiment independently several times and checking the dynamics were always identical (data not shown). 2.3 Sampling
Sampling was always carried out in the same order to avoid bias from any time lag
20
occurring between the different measurements. To prevent carbon contamination the first sub-sample was always dedicated to carbon measurements (DOC and POC). The sampling order was: (1) POC/DOC, (2) cell count by microscopy and flow cytometry analyses, and (3) oxygen consumption (respiration). To ensure reproducibility, samples were always further homogenised before sampling by gentle hand-mixing. To ensure
25
the results were significant, the final volume of the batch cultures was always higher than 50% of the initial culture volume.
BGD
7, 787–822, 2010Increased bacterial growth efficiency with environmental
variability
M. Eichinger et al.
Title Page
Abstract Introduction
Conclusions References
Tables Figures
◭ ◮
◭ ◮
Back Close
Full Screen / Esc
Printer-friendly Version
Interactive Discussion DOC and POC were separated using pre-combusted GF/F filters (0.7 µm
nomi-nal porosity). DOC was measured by high temperature catalytic oxidation (HTCO) using a Shimadzu TOC 5000 Analyzer following the same protocol as Sohrin and Semp ´er ´e (2005). At time 0, the DOC measured was derived from the vitamins and pyruvate. The vitamin-DOC concentration was negligible compared to that of the
pyru-5
vate and estimated to account for only 3 and 0.6% of the initial DOC for the P and B experiments, respectively. In this study, we refer to POC as the C-bacterial biomass. Following filtration onto the GF/F filter, each filter was dried in an oven (30◦) carefully stored in a desiccator in the dark and then analysed with a carbon analyser (Leco SC-144) following the same protocol as Semp ´er ´e et al. (2000).
10
O2consumption was determined by measuring O2concentration dynamics with the Oroboros-2k oxygraph (OROBOROS, Austria). This oxygraph provides the instrumen-tal basis for temporal high-resolution respirometry due to a small time lag between two measurements (2 s). As recommended by the manufacturer the volume of the two thermoregulated chambers was set to 2 cm3, and the stirrer speed to 750 rounds per
15
minute. Respiration measurements were carried out at 25◦C, the same temperature as the cultures. Each day, the basal consumption of each polarographic oxygen sensor (POS) was determined using a sterile medium sample. This value was then subtracted from each O2 consumption rate measured the same day. The POS were calibrated
with 0 and 100% oxygen saturation. 0% oxygen saturation was achieved by adding
an-20
hydre sodium hydrosulfite (Na2SO3) in excess, in order to complex all the oxygen in the
chambers. The 100% oxygen saturation was calibrated prior to each measurement by introducing 2 cm3 of sterile culture medium to each chamber and keeping the stopper open to equilibrate the gas with the atmosphere. Once equilibrium had been reached, the 100% oxygen saturation was recorded. This medium was then replaced by 2 cm3
25
of culture. The decreasing O2 concentration was measured at each time point. O2 consumption was calculated by applying a linear regression on the O2concentrations,
BGD
7, 787–822, 2010Increased bacterial growth efficiency with environmental
variability
M. Eichinger et al.
Title Page
Abstract Introduction
Conclusions References
Tables Figures
◭ ◮
◭ ◮
Back Close
Full Screen / Esc
Printer-friendly Version
Interactive Discussion O2consumption estimation started 10 min after closing the stopper.
Bacterial density was estimated using microscopy counts to calculate specific bac-terial activities (specific carbon content and O2 consumption). Bacteria fixation was
carried out by adding 100 mm3 of a 20% tetraborated formol solution into 900 mm3 of culture. A few mm3 were taken out from this formol-mixture and added to filtered
5
MilliQ water. The volume of the formol-mixture was adjusted according to the expected bacterial density, so that there were at least 30 bacteria per field under the micro-scope. Bacteria were stained with Diamidino-4′,6-ph ´enylindol-2 Dichlorhydrate (DAPI) (2.5 µg cm−3final concentration). The final mixture was filtered onto a 0.2 µm porosity dark polycarbonate membrane. The counts (in cell cm−3) were realised with an
epiflu-10
orescent microscope (Olympus BH2 or BX61, Olympus, USA) by analysing 30 fields per sample.
In some samples bacterial density was also analysed using flow cytometry for total counts, and in the DOC samples to check for any bacterial transfer through the GF/F filters. Bacterial fixation was carried out using 1.8 cm3 sample and 0.2 cm3 of a 20%
15
para-formaldehyde (PFA) solution in 2 cm3cryotubes (Nalgene, USA). Samples were then stored in liquid nitrogen (−180◦C) until analysis. Before analysis the samples
were gently thawed in a water bath at room temperature, stained with DAPI solution (2.5 µg cm−3final concentration) and analysed by a MoFlo cell sorter (Dako, Dk). 2.4 BGE estimation
20
According to the general definition, BGE can be estimated from experimental data as BGE=−∆POC/∆DOC. ∆POC was estimated from the difference between the
maxi-mum and initial POC values and∆DOC from the difference between the total substrate amount introduced in the culture (8 mM C) and the remaining DOC amount at the end of the experiment.
25
BGE has also been estimated by using three models with different levels of com-plexity: the Monod, Marr-Pirt and Dynamic Energy Budget (DEB) models. For each model, BGE was estimated as: BGE=−d BB/d L, where BB is the bacterial biomass
BGD
7, 787–822, 2010Increased bacterial growth efficiency with environmental
variability
M. Eichinger et al.
Title Page
Abstract Introduction
Conclusions References
Tables Figures
◭ ◮
◭ ◮
Back Close
Full Screen / Esc
Printer-friendly Version
Interactive Discussion andL the substrate concentration (L-DOC) (Table 1). The DEB model takes into
ac-count one C-reserve compartment as well as two C-maintenance fluxes (see below); the Marr-Pirt model considers one C-maintenance flux but no reserve compartment; the Monod model comprises neither reserve nor maintenance. Descriptions of state variables and parameters are given in Table 1. The DEB model originates from the
5
dynamic energy budget theory (Kooijman, 2000). It has been specifically developed for the conditions in experiment P and its construction has been extensively described in Eichinger et al. (2009). Briefly, the DEB theory assumes that bacterial biomass is composed of a reserve (ME) and structure (MV). Differential equations on the left part
of (Eq. 1) correspond to a typical growth model for heterotrophic bacteria, whereas
10
differential equations on the right part describe bacterial dynamics in starvation condi-tions. During growth, substrate is first assimilated into the reserve and then C-energy is allocated to growth. Maintenance is paid from the mobilized reserve if the flux is large enough (growth case). Otherwise, structure is used to pay the remaining part of the maintenance costs (starvation case), which causes size reduction of the cell (Tolla et
15
al., 2007; Eichinger et al., 2009). Release of recalcitrant-to-degradation DOC (R) was associated with the use of structure for maintenance purpose (Eq. 1). For this model: BGE=−d Ld
ME/yMEMV+MV
. Contrary to the DEB model, the Marr-Pirt model (Marr et al., 1963; Pirt, 1965) assumes a direct transfer from assimilation to growth and includes one maintenance term only. As this model does not comprise any reserve
compart-20
ment, maintenance is directly realised from biomass (Eq. 2). As in the DEB model,R
is produced from the maintenance of the biomass. For this model, BGE=−d BB/d L.
The Monod model (Monod, 1942) assumes that the absorbed substrate is directly and instantaneously transformed into biomass with a constant efficiency (Eq. 3) (Eichinger et al., 2006): BGE=−d BB/d L.
25
DEB model:(Eq. 1)
d L
BGD
7, 787–822, 2010Increased bacterial growth efficiency with environmental
variability
M. Eichinger et al.
Title Page Abstract Introduction Conclusions References Tables Figures ◭ ◮ ◭ ◮ Back Close
Full Screen / Esc
Printer-friendly Version
Interactive Discussion ifkEME> jMEMMV
d ME
d t =yMELαLMV−jMEMMV
−yMEMV
kEME−jMEMMV
ME+yM
EMVMV MV
d MV d t =
kEME−jMEMMV
ME+yMEMVMVMV
d R d t =0
ifkEME< jM EMMV
d ME
d t =yMELαLMV−kEME
−MjMEMMV−kEME
E+jMEM/jMVMMVME
d MV d t =−
jMEMMV−kEME
ME+jM
EM/jMVMMV MV
d R
d t =yRMV
jMEMMV−kEME
ME+jMEM/jMVMMVMV
Marr-Pirt model: (Eq. 2)
d L
d t =−αLBB
5
d BB
d t =yBBLαLBB−jBBMBB
d R
d t =yRBBjBBMBB
10
Monod model:(Eq. 3)
d L
d t =−αLBB
d BB
d t =yBBLαLBB
BGD
7, 787–822, 2010Increased bacterial growth efficiency with environmental
variability
M. Eichinger et al.
Title Page
Abstract Introduction
Conclusions References
Tables Figures
◭ ◮
◭ ◮
Back Close
Full Screen / Esc
Printer-friendly Version
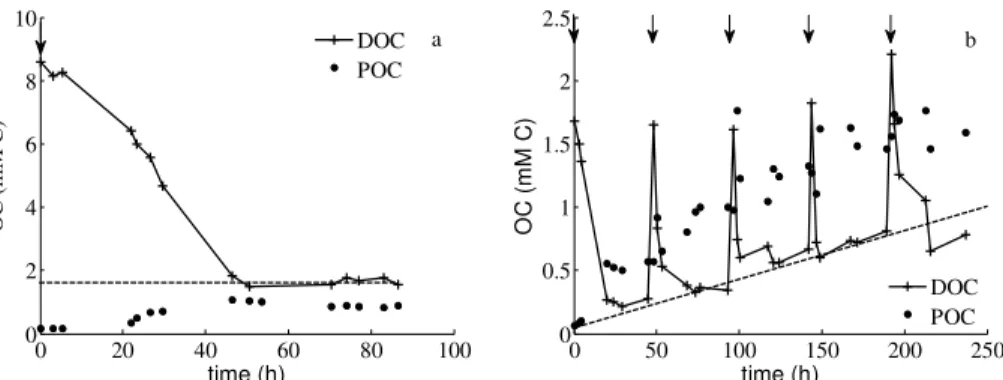
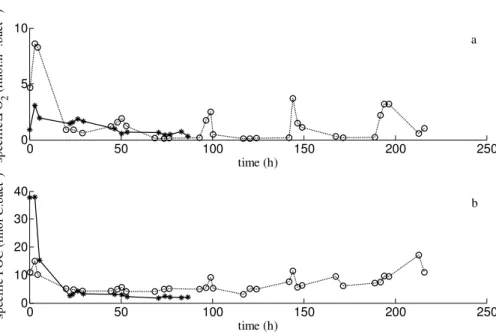
Interactive Discussion Note that in this study we also report that bacteria are able to produce unusable DOC,
referred to here as R-DOC. The Monod model does not permit any product formation therefore in order to compare parameters governing assimilation and growth on L-DOC between the three models, the DOC data were modified, for the utilisation of this model only (see below), to deal with just the labile fraction of DOC. In experiment B, apparent
5
R-DOC concentrations seem constant (Fig. 1a). L-DOC values were thus estimated by offsetting the R-DOC values at the end of the experiment to the total DOC values. In experiment P, apparent R-DOC concentrations increased after each pulse and a linear regression on R-DOC values for all the experiment was applied (Fig. 1b). We calculated L-DOC values for the Monod model as L-DOC=DOC−(0.0038t+0.1067), where DOC
10
represents the measured DOC concentrations and t is time. This data modification does not influence BGE values as it is only based on L-DOC and bacterial biomass (POC) data.
3 Results
3.1 DOC and POC dynamics
15
Flow cytometry analyses revealed that the percentage of bacteria in DOC samples ranged from 0 to 14% in experiment B. Higher values were obtained during the ex-ponential growth phase, whereas this percentage was close to 0% during the lag and the stationary phases (data not shown). This suggests that bacteria are larger during the non dividing period, and that cell division leads to bacteria shrinking, subsequently
20
reaching the size limit of the filter retention in some cases. We thus corrected POC and DOC concentration values according to the fraction of bacteria crossing the filters. In experiment P, with the exception of two values of 11 and 13%, the percentage of bacteria in DOC samples were always lower than 4.5%. Unfortunately, some samples were not checked for bacterial density due to technical problems. Due to the low
per-25
BGD
7, 787–822, 2010Increased bacterial growth efficiency with environmental
variability
M. Eichinger et al.
Title Page
Abstract Introduction
Conclusions References
Tables Figures
◭ ◮
◭ ◮
Back Close
Full Screen / Esc
Printer-friendly Version
Interactive Discussion DOC and POC values for experiment P. Experimental dynamics of DOC and POC take
into account the correction for experiment B (Fig. 1a) but not for experiment P (Fig. 1b). DOC kinetics indicated an apparent remaining DOC during the time course of exper-iment P (Fig. 1b). Indeed, as represented by the dashed line in Fig. 1b, the baseline level for DOC concentration increased following each substrate addition. As
hypoth-5
esised, bacteria always consumed the substrate added after each pulse, thus the in-crease in remaining DOC is not likely to be labile DOC for this strain. In this experiment we considered this “remaining-accumulating” DOC to be unconsumed DOC produced by the cultured bacteria and referred to it as R-DOC, over the scale of this study (refer to Eichinger et al. (2009) for additional details on this DOC production). On the
con-10
trary, no apparent R-DOC was produced over the time course of experiment B; how-ever, there was a DOC concentration of about 1.9 mM C at the end of the experiment (Fig. 1a). As no substrate was added during this experiment, it is difficult to determine if this remaining DOC consisted of unconsumed substrate due to a limitation such as nutrients or O2, or whether the R-DOC was produced during another period of the
15
experiment. We assumed this remaining DOC consisted of R-DOC, as in experiment P.
Over the entire experiment, about 6.1 and 7 mM of DOC were consumed in the P and B experiments, respectively. However, due to the very rapid reactivity of bacteria towards DOC supply in experiment P and to the time lag necessary for DOC sampling
20
following the additions, it is difficult to estimate the exact total concentration of DOC that was supplied in this experiment. It is therefore possible that the total concentration of consumed DOC is higher than that estimated for experiment P. POC concentrations were identical at time 0 (t0) in both experiments. However, although the total
concentra-tion of substrate was the same in both experiments, the maximum POC concentraconcentra-tions
25
differed. It reached a value of 1.8 and 1.1 mM C for experiments P and B, respectively. This suggests a higher productivity, of a factor of 1.6 for experiment P.
BGD
7, 787–822, 2010Increased bacterial growth efficiency with environmental
variability
M. Eichinger et al.
Title Page
Abstract Introduction
Conclusions References
Tables Figures
◭ ◮
◭ ◮
Back Close
Full Screen / Esc
Printer-friendly Version
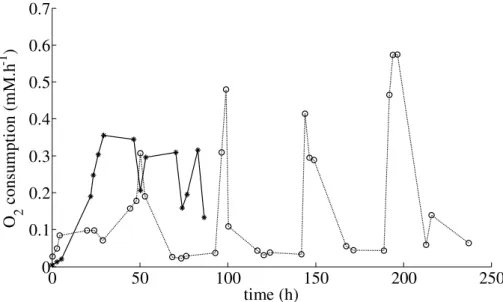
Interactive Discussion 3.2 Respiration dynamics
In both experiments, O2 consumption increased rapidly a few hours after t0 (Fig. 2).
However, this increase was more than 3 times higher for experiment B: O2
consump-tion peaked at 0.35 and 0.10 mM O2h−1for experiments B and P, respectively (Fig. 2). This difference is assumed to be due to the higher initial substrate concentration (×5)
5
in experiment B. The increase in respiration rate was slow in experiment B, which correlates to the DOC degradation period (Fig. 1a). O2 consumption then stabilised with only small variations around 0.25 mM O2h−1
. Respiration rates followed the DOC dynamics in experiment P, increasing very rapidly following each substrate pulse, with higher values reaching 0.6 mM O2h−
1
(Fig. 2). As for the DOC measurements, O2
con-10
sumption increased very rapidly following substrate addition, and as a period of at least 30 min was required before O2measurements could be carried out, it is highly possible
that O2 consumption was underestimated. Only a few hours after substrate addition,
respiration rates decreased linearly never dropping to zero but stabilising at a constant value until the next substrate pulse. This constant value increased after each pulse as
15
bacterial density increased throughout the experiment and demonstrated the mainte-nance process which can not be considered to be negligible. We also estimated the total concentration of O2 consumed during the experiments using a trapezoidal
inte-gration method between the data points. We obtained about 30 and 20 mM O2for the
P and B experiments, respectively. From this estimation, experiment P was 1.5 times
20
more productive than experiment B. Consequently, observed O2consumption
BGD
7, 787–822, 2010Increased bacterial growth efficiency with environmental
variability
M. Eichinger et al.
Title Page
Abstract Introduction
Conclusions References
Tables Figures
◭ ◮
◭ ◮
Back Close
Full Screen / Esc
Printer-friendly Version
Interactive Discussion 3.3 Specific activities
Specific O2 consumption (fmol O2h− 1
bact−1) and specific organic-C content (fmol C bact−1) were estimated by dividing O2consumption values and POC
concen-trations by their respective bacterial density at each sampling time (Fig. 3). Specific O2 consumption rapidly increased att0and then decreased in both experiments (Fig. 3a).
5
In experiment B, the specific respiration rate gradually decreased during the time course of the experiment. Contrary to this, the specific respiration rate sharply in-creased after each substrate addition and dein-creased a few hours later in experiment P. Specific respiration rates dropped to a mean value of 0.2 fmol O2h−
1
bact−1 between each subsequent pulse (and after the second pulse), a value which is an approximation
10
of the specific maintenance respiration rate.
Although the initial POC concentration and bacterial density should be identical in both experiments, the initial specific organic-C contents were different, 38 and 11 fmol C bact−1 for experiments B and P, respectively (Fig. 3b). This could be due to the initial values of POC concentration and bacterial density being low and thus
15
difficult to accurately measure. Nevertheless, the specific organic-C content rapidly decreased after the start of both experiments to about 3–5 fmol C bact−1. The specific POC content then gradually decreased from approximatively 4 to 2 fmol C bact−1during the remaining time of experiment B. Contrary to this, specific POC content increased after each substrate pulse in experiment P and was relatively stable, 5 fmol C bact−1
20
between two subsequent pulses. After 20 h, specific POC values were always higher in experiment P than in experiment B (Fig. 3b).
3.4 Model fitting
The DEB, Marr-Pirt and, Monod models were calibrated from the data sets obtained from each experiment. Parameter estimation was based on the minimisation of the sum
25
of squared deviations of model predictions to data points, using the Nelder Mead’s sim-plex method. To compare model outputs to DOC and POC measurements, we made
BGD
7, 787–822, 2010Increased bacterial growth efficiency with environmental
variability
M. Eichinger et al.
Title Page
Abstract Introduction
Conclusions References
Tables Figures
◭ ◮
◭ ◮
Back Close
Full Screen / Esc
Printer-friendly Version
Interactive Discussion the following assumptions: (1) for the DEB model, DOC=L+R and POC=ME+MV; (2)
for the Marr-Pirt model, DOC=L+R and POC=BB; (3) for the Monod model, DOC=L
and POC=BB. Calibrations were carried out using the whole original data set for
ex-periment P and the whole corrected data set for exex-periment B, as DOC and POC values were corrected for the bacteria that crossed the filters. The Monod model was
5
calibrated with modified data sets from both experiments as we subtracted the esti-mated R-DOC concentrations from each DOC data point of each experiment. Esti-mated parameter values for each model are given in Table 2 for experiment B and in Table 3 for experiment P.
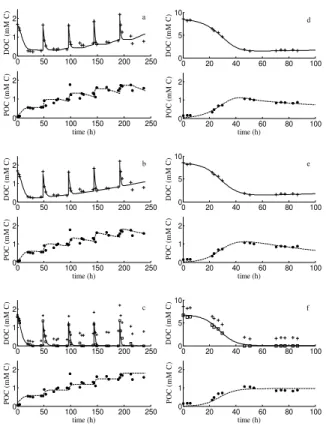
The DEB and Marr-Pirt models fitted the DOC and POC data producing a good fit for
10
both experiments (Fig. 4a,b,d and e). However, the DEB model showed greater flexi-bility than the Marr-Pirt one. After data modification (represented by squares in Fig. 4c and f), the Monod model accurately fitted the DOC dynamics of both experiments, which can be explained by the fact that L-DOC uptake was governed by the same formulation in the three models. However, the Monod model did not produce a good
15
fit for the POC data (Fig. 4c and f). We indeed prevented the problems associated with unconsumed DOC release as this process was not incorporated into the Monod model. However, the absence of the maintenance process did not enable the model to demonstrate the decrease in POC, which is clearly visible at the end of experiment B. 3.5 BGE estimations
20
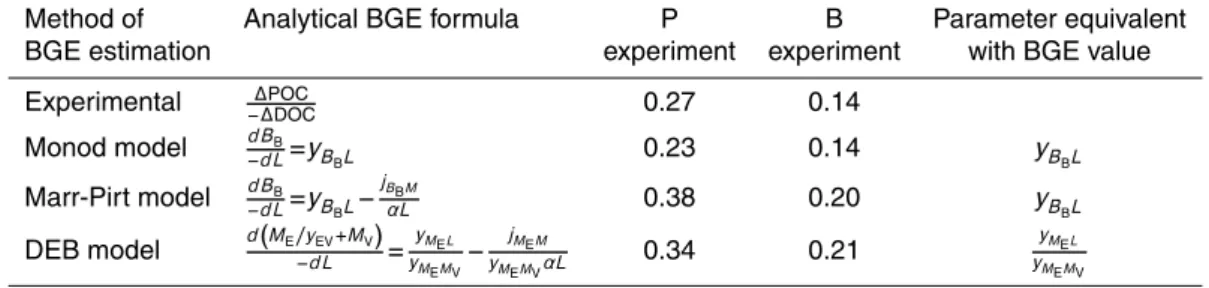
BGE was directly estimated experimentally as BGE=−∆∆DOCPOC. BGE was 0.14 and 0.27
for experiments B and P, respectively (Table 4), suggesting that bacteria were twice as efficient when provided with regular pulsed DOC inputs than when provided with a single DOC addition. BGE was computed for each experiment and each model (see Material and Method, BGE estimation). Whatever the estimation method, BGE values
25
BGD
7, 787–822, 2010Increased bacterial growth efficiency with environmental
variability
M. Eichinger et al.
Title Page
Abstract Introduction
Conclusions References
Tables Figures
◭ ◮
◭ ◮
Back Close
Full Screen / Esc
Printer-friendly Version
Interactive Discussion for the Monod model. Growth efficiencies differed in the same range of magnitude for
all estimations: BGE values were approximately 50% higher in experiment P compared to experiment B in both the experimental and Marr-Pirt estimations, and 60% for the Monod and DEB estimations.
BGE estimations were always higher using the methods taking into account
main-5
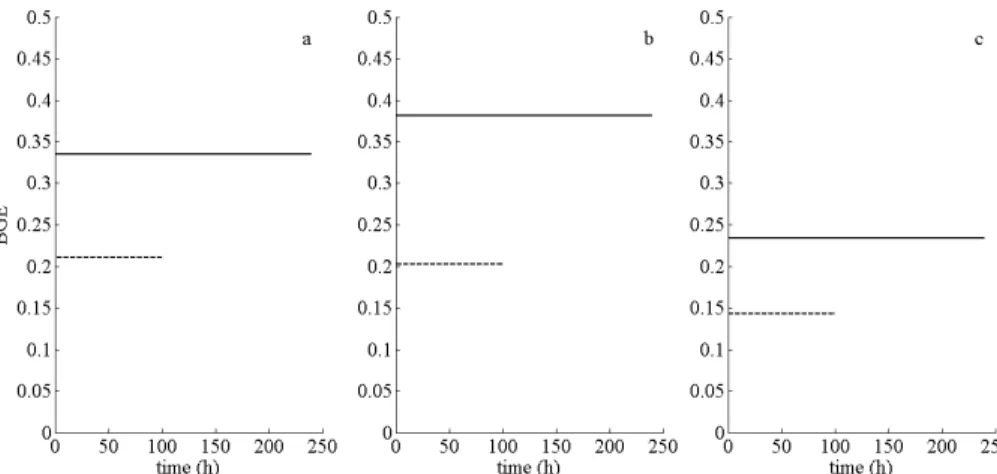
tenance (DEB and Marr-Pirt models) compared to the Monod model and empirical estimations. The analytical calculations of BGE for the three models gave the follow-ing results: for the DEB model, BGE=yMEL
yMEMV− jMEM yM
EMVαL
(by taking only the growth model into account, otherwise we would obtain a negative BGE); for the Marr-Pirt model, BGE=yBBL−jBBM/αL; and for the Monod model, BGE=yBBL (Table 4). BGE for DEB
10
and Marr-Pirt models depend onL, and should thus vary according to time. Finally, the parameter estimation showed that the variable parts of BGE (for Marr-Pirt and DEB models) were negligible: the constant values observed in Fig. 5 corresponded to the constant part of BGE (Table 4).
4 Discussion
15
4.1 Maintenance process and model choice for bacterial growth
Respiration rate measurements enabled cell maintenance to be studied during the sta-tionary phase. The Monod model is not suitable for this purpose. Indeed, it considers that a proportion BGE from assimilated substrate is used for growth, and implicitly that the remaining proportion (1-BGE) is used for respiration. However, when
con-20
sidering the equations, L=0 would imply that the respiration rate (which amounts to (1−BGE)αLBB) is also null. This result is inconsistent with our experimental results
that clearly exhibited respiration rate values different from zero during starvation pe-riods. The choice of a model is highly influenced by the available data. Indeed, if our experiments had been stopped after the growth phase and we had not measured
25
BGD
7, 787–822, 2010Increased bacterial growth efficiency with environmental
variability
M. Eichinger et al.
Title Page
Abstract Introduction
Conclusions References
Tables Figures
◭ ◮
◭ ◮
Back Close
Full Screen / Esc
Printer-friendly Version
Interactive Discussion Consequently, performing an experiment that continuously alternated between supply
and depletion of substrate, coupled to respiration rate measurements, enabled us to reject the Monod model, when measuring bacterial growth in a fluctuating substrate supply, i.e. in fluctuating environments. In this study, the Marr-Pirt and DEB mod-els were almost equivalent in terms of dynamics and BGE estimations. However, by
5
increasing the complexity of the experiment by including other trophic levels for exam-ple, one could likely appreciate the relevance of mechanistic approach, as in the DEB theory. It has been demonstrated using a food chain with bacteria, fed on glucose, and a predator, that the Monod and Marr-Pirt models were not able to reproduce the experimental dynamics, whereas the DEB model was (Kooi and Kooijman, 1994).
Con-10
sequently, experimental developments, as those presented in this study, are needed in order to assess bacterial processes and should be included in ecosystem models.
The calibration of the three models using data sets from both experiments showed that the Monod model was weak in reproducing the experimental dynamics. We had previously reached this conclusion by analysing the respiration rate measurements,
15
but the maintenance process was also evident from decreasing POC concentrations during starvation periods, dynamics that can not be produced with the Monod model. However, the formulation of the maintenance process had little impact on model out-puts in this study. Nevertheless, the DEB model is more flexible than the Marr-Pirt due to its mechanistic formulation model and can be validated in more diverse situations.
20
For example, if we had conducted a pulse experiment with the initial conditions of ex-periment B and over a longer pulse period, the Marr-Pirt model may have been unable to reproduce the experimental dynamics as it does not comprise a component for cell maintenance from the reserve, component that would not be longer negligible. Indeed, the maintenance from the reserve was higher in experiment B than in experiment P
25
(jEM is negligibly small in experiment P whereas it equals 0.021 h− 1
BGD
7, 787–822, 2010Increased bacterial growth efficiency with environmental
variability
M. Eichinger et al.
Title Page
Abstract Introduction
Conclusions References
Tables Figures
◭ ◮
◭ ◮
Back Close
Full Screen / Esc
Printer-friendly Version
Interactive Discussion in conditions other than our pulse experiment, and may show dynamic differences with
the Marr-Pirt model. Tolla et al. (2007) discussed the interest and efficiency of a mech-anistic formulation of maintenance.
4.2 Bacterial versatility to respond to a perturbation
By estimating specific activities of bacteria faced to a pulsed substrate supply, we
5
highlighted the versatility of bacterial metabolism, which would be difficult to observe in steady-state conditions. O2 concentration measurements revealed that respiration
rates sharply increased as soon as substrate was introduced to the culture. This in-crease was so rapid that we probably underestimated O2consumption due to the time lag between substrate addition in the culture, sampling, and respiration rate
measure-10
ments. This conclusion is certainly true for DOC measurements, because if bacterial respiration rates increased so rapidly, they obviously consumed DOC very quickly after substrate addition. We may introduce the notion of population synchronisation as bac-teria are constrained by the presence or absence of food. This synchronisation may be due to several factors, such as the stress generated by the absence of substrate
15
and the large energy requirement for maintenance. Consequently, when we added substrate to the culture, the bacteria became simultaneously active to assimilate and grow, and cells continued maintenance even when the substrate was totally exhausted. This metabolic flexibility is necessary to cope with the in situ heterogeneity of a largely oligotrophic and ever-changing environment, and may result from the uncoupling of
20
anabolic and catabolic processes (del Giorgio and Cole, 1998). We believe that the sit-uation is the same in natural seawater, as food is not continuously available (Hanegraaf and Kooi, 2002) and bacteria may have to face long periods of absence of one or more nutrients (Konopka, 1999) and short periods of high substrate availability. Thus, by car-rying out batch biodegradation experiments using in situ samples, bacteria may be in
25
one or another situation. It is important to note that because bioassays often eliminate the effects of DOC production processes, these incubations only assess the standing stock of L-DOC at a given time (Raymond and Bauer, 2000). The resulting BGE values
BGD
7, 787–822, 2010Increased bacterial growth efficiency with environmental
variability
M. Eichinger et al.
Title Page
Abstract Introduction
Conclusions References
Tables Figures
◭ ◮
◭ ◮
Back Close
Full Screen / Esc
Printer-friendly Version
Interactive Discussion are obviously affected by the temporal variation of substrate availability and are finally
not necessarily representative of the studied site. Therefore, extrapolating BGE values from incubations to the field may result in misrepresentation. Consequently, we have to be very cautious when comparing BGE from different study sites and periods, without considering the “history” of the water mass. In a study using daily sampling of DOC in
5
the central equatorial Pacific Ocean, Carlson and Ducklow (1995) demonstrated that they sampled different water each day because of the upstream.
4.3 Higher BGE in a realistically perturbed environment
In this study, four constant BGE values (one empirical and three modelled BGE) dif-fered, but they were always higher in the pulse experiment. It seems that bacteria were
10
unable to efficiently grow when large amounts of substrate were present, whereas growth was stimulated when the same amount of substrate was added periodically. Results on higher BGE values in transient environments are consistent with the analy-sis of BGE values in diverse aquatic systems described in the literature. For instance, BGE values are higher in estuarine when compared to open ocean systems (del
Gior-15
gio and Cole, 1998). Indeed, estuarine systems are more influenced by episodic inputs of DOC compared to oceans. Raymond and Bauer (2000) reported a negative relation-ship between the L-DOC concentration and BGE in an estuarine system. This outcome could also mean that these higher BGE values resulted from a frequent input of L-DOC, but in a low concentration, which is unfortunately difficult to measure in situ. If
consid-20
ering oceanic systems, our results confirm those of Coffin et al. (1993) who reported a marked diel cycle, with BGE ranging from 37 to 72% and increasing during the day, presumably following inputs of algae derived organic substrates.
We also demonstrated that BGE values were higher when maintenance was taken into account in the calculation. BGE are generally estimated from steady-state
ex-25
BGD
7, 787–822, 2010Increased bacterial growth efficiency with environmental
variability
M. Eichinger et al.
Title Page
Abstract Introduction
Conclusions References
Tables Figures
◭ ◮
◭ ◮
Back Close
Full Screen / Esc
Printer-friendly Version
Interactive Discussion CO2in the medium. This would finally lead to the conclusion that most of the previous
studies investigating BGE using batch experiments overestimate the role of bacteria as CO2 producers. It is thus important to take into account the spatial and temporal
variability of DOC when assessing and quantifying the role of bacteria in the oceanic carbon cycle. We need to find a more consistent method for investigating bacterial
5
growth and utilisation of DOC in natural environments in order to correctly compare results from different study sites and periods. By using a daily sampling strategy in the Pacific Ocean, during two periods in the spring and autumn, Carslon and Ducklow (1995) demonstrated the presence of a high frequency variability of bulk DOC, which is driven by physical processes. By using the same sampling strategy and carrying out
10
degradation experiments on each water sample, one could examine the effect of this variability on bacterial metabolism and BGE.
4.4 More consideration for estimating BGE
In this study, the coupling of the experimental and modelling work made possible to es-timate BGE values using two methods: the empirical (by calculating∆DOC and∆POC)
15
and the modelling methods (by calibrating three models on the data sets). However, most studies estimate BGE values via the utilisation of indirect methods by considering that BCD=BP+BR contrary to BCD=∆DOC. To estimate BR, experimentalists gener-ally apply a linear regression on the O2 dynamics and only consider the slope of this
regression (del Giorgio and Cole, 1998; Eichinger et al., 2006). However, our
exper-20
iments clearly demonstrated that the BR value varies greatly during an experiment, being high during assimilation and low during starvation periods. The non systematic linearity of BR, and its impact on BGE estimation, has already been demonstrated by performing continuous oxygen measurements with oxygen microprobes (Briand et al., 2004). BP is generally estimated from radiolabeled thymidine or leucine incorporation
25
or by the difference between the final and initial bacterial abundances. However, these estimates rely on various conversion factors that have great uncertainties (Jahnke and Craven, 1995). We also demonstrated in this study that these factors may vary in time.
BGD
7, 787–822, 2010Increased bacterial growth efficiency with environmental
variability
M. Eichinger et al.
Title Page
Abstract Introduction
Conclusions References
Tables Figures
◭ ◮
◭ ◮
Back Close
Full Screen / Esc
Printer-friendly Version
Interactive Discussion Indeed, we obtained values for the specific POC content, which are equivalent to the
carbon content factor (CCF) commonly used to convert bacterial density into bacterial biomass, varying from 3 to 38 fmol C bact−1. This result means that we may produce an error of factor 10 when estimating bacterial carbon from bacterial density. The specific POC content always increased after substrate assimilation, reflecting the capability of
5
bacteria to store carbon. It then decreased during starvation periods, until a “thresh-old” value. This would mean that CCF should be adapted to the physiological state of bacteria, which depends on substrate availability.
5 Conclusions
Numerous studies have investigated how biological, chemical, and physical factors
af-10
fect BGE values (del Giorgio and Cole, 1998). However, there have only been a few in-vestigations dealing with daily and detailed seasonal variation of natural BGE (del Gior-gio and Cole, 1998). To the best of our knowledge, this is the first study demonstrating that the temporal variation in substrate availability greatly influences BGE, which may be twice as high in pulsed experimental conditions. Our simulated temporal variation
15
of the DOC supply can simulate various biological factors occurring in situ, such as intermittent DOC release from phytoplankton and zooplankton, and transient physical forcing, as in turbulent eddies. This spatio-temporal variability of DOC distribution in the field would make BGE highly variable and makes it difficult to apprehend in situ. More experiments are however required to confirm our results, for example
measur-20
ing nutrient concentration and progressively incorporating more natural DOC sources. However, we should still consider the pulse load of substrate and other kinds of variable inputs. The outcome of this study is even more important knowing that model formu-lation and parameter estimation from experimental dynamics are often used in global models to investigate the oceanic carbon cycle.
BGD
7, 787–822, 2010Increased bacterial growth efficiency with environmental
variability
M. Eichinger et al.
Title Page
Abstract Introduction
Conclusions References
Tables Figures
◭ ◮
◭ ◮
Back Close
Full Screen / Esc
Printer-friendly Version
Interactive Discussion
Acknowledgements. The authors received financial support from the LMGEM research grant,
from the French National Program for Coastal Environment (AMPLI Project) and Foundation TOTAL from the REMECCA program. Ph.D. scholarships for M.E. came from the French Min-istry of Research and Education. We would like to thank the Service Central d’Analyse du CNRS for POC analyses and the Regional Flow Cytometry Platform for Microbiology
(PRE-5
CYM) on the Oceanology Centre of Marseille. Authors are grateful to M. Garel and A. Robert for their help in the experimental conception and realisation, and to T. Bentley for editorial as-sistance.
10
The publication of this article is financed by CNRS-INSU.
References
Abboudi, M., Jeffrey, W. H., Ghiglione, J.-F., Oriol, L., Semp ´er ´e, R., Charri `ere, B., and Joux, F.: Effects of photochemical transformations of dissolved organic matter on bacterial metabolism and diversity in three contrasting coastal sites in the northwestern Mediterranean sea during
15
summer, Microb. Ecol., 55(2), 344–357, doi:10.1007/s00248–007-9280-8, 2007.
Amon, R. M. W. and Benner, R.: Bacterial utilization of different size classes of dissolved organic matter, Limnol. Oceanogr., 41(1), 41–51, 1996.
Anderson, T. R. and Williams, P. J. L. B.: Modelling the seasonal cycle of dissolved organic carbon at station E-1 in the English Channel, Estuar. Coast. Shelf S., 46(1), 93–109, 1998.
20
Anderson, T. R. and Williams, P. J. L. B.: A one-dimensional model of dissolved organic carbon cycling in the water column incorporating combined biological-photochemical decomposition, Global Biogeochem. Cy., 13(2), 337–349, 1999.
BGD
7, 787–822, 2010Increased bacterial growth efficiency with environmental
variability
M. Eichinger et al.
Title Page
Abstract Introduction
Conclusions References
Tables Figures
◭ ◮
◭ ◮
Back Close
Full Screen / Esc
Printer-friendly Version
Interactive Discussion Baretta-Bekker, J. G., Baretta, J. W., and Rasmussen, E. K.: The microbial food web in the
European Regional Seas Ecosystem Model, Neth. J. Sea Res., 33(3/4), 363–379, 1995. Blackburn, N., Zweifel, U. L., and Hagstrom, A.: Cycling of marine dissolved organic matter II.,
A model analysis, Aquat. Microb. Ecol., 11(1), 79–90, 1996.
Briand, E., Pringault, O., Jacquet, S., and Torr ´eton, P.: The use of oxygen microprobes to
5
measure bacterial respiration for determining bacterioplankton growth efficiency, Limnol. Oceanogr.-Meth., 2, 406–416, 2004.
Cajal-Medrano, R. and Maske, H.: Growth efficiency, growth rate and the remineralization of organic substrate by bacterioplankton – revisiting the Pirt model, Aquat. Microb. Ecol., 19(2), 119–128, 1999.
10
Cajal-Medrano, R. and Maske, H.: Growth efficiency and respiration at different growth rates in glucose-limited chemostats with natural marine bacteria populations, Aquat. Microb. Ecol., 38(2), 125–133, 2005.
Carlson, C. A. and Ducklow, H. W.: Dissolved organic carbon in the upper ocean of the central equatorial Pacific Ocean, 1992: daily and finescale vertical variations, Deep-Sea Res. Pt. II,
15
42, 639–656, 1995.
Carlson, C. A. and Ducklow, H. W.: Growth of bacterioplankton and consumption of dissolved organic carbon in the Sargasso Sea, Aquat. Microb. Ecol., 10(1), 69–85, 1996.
Carlson, C. A., Bates, N. R., Ducklow, H. W., and Hansell, D. A.: Estimation of bacterial respira-tion and growth efficiency in the Ross Sea, Antarctica, Aquat. Microb. Ecol., 19(3), 229–244,
20
1999.
Carlson, C. A., Giovannoni, S. J., Hansell, D. A., Goldberg, S. J., Parsons, R., Otero, M. P., Ver-gin, K., and Wheeler, B. R.: Effect of nutrient amendments on bacterioplankton production, community structure, and DOC utilization in the northwestern Sargasso Sea, Aquat. Microb. Ecol., 30(1), 19–36, 2002.
25
Carlson, C. A., Giovannoni, S. J., Hansell, D. A., Goldberg, S. J., Parsons, R., and Vergin, K.: Interactions among dissolved organic carbon, microbial processes, and community structure in the mesopelagic zone of the northwestern Sargasso Sea, Limnol. Oceanogr., 49(4), 1073– 1083, 2004.
Cherrier, J., Bauer, J. E., and Druffel, E. R. M.: Utilization and turnover of labile dissolved
30
organic matter by bacterial heterotrophs in eastern north Pacific surface waters, Mar. Ecol.-Prog. Ser., 139(1–3), 267–279, 1996.
BGD
7, 787–822, 2010Increased bacterial growth efficiency with environmental
variability
M. Eichinger et al.
Title Page
Abstract Introduction
Conclusions References
Tables Figures
◭ ◮
◭ ◮
Back Close
Full Screen / Esc
Printer-friendly Version
Interactive Discussion carbon and nitrogen inputs in surface ocean waters, Aquat. Microb. Ecol., 35(3), 229–241,
2004.
Coffin, R. B., Connolly, J. P., and Harris, P. S.: Availability of dissolved organic carbon to bacte-rioplankton examined by oxygen utilization, Mar. Ecol.-Prog. Ser., 101, 9–22, 1993.
del Giorgio, P. A. and Cole, J. J.: Bacterial growth efficiency in natural aquatic systems, Annu.
5
Rev. Ecol. Syst., 29, 503–541, 1998.
Eichinger, M., Poggiale, J. C., Van Wambeke, F., Lef `evre, D., and Semp ´er ´e, R.: Modelling DOC assimilation and bacterial growth efficiency in biodegradation experiments: a case study in the Northeast Atlantic Ocean, Aquat. Microb. Ecol., 43(2), 139–151, 2006.
Eichinger, M., Kooijman, S. A. L. M., Semp ´er ´e, R., Lef `evre, D., Gr ´egori, G., Charri `ere, B.,
10
and Poggiale, J. C.: DOC consumption and release by marine bacteria in pulsed-substrate environment: from experiments to modelling, Aquat. Microb. Ecol., 56(1), 41–54, 2009. Goldman, J. C., Caron, D. A., and Dennett, M. R.: Regulation of gross growth efficiency and
ammonium regeneration in bacteria by substrate C:N ratio, Limnol. Oceanogr., 32(6), 1239– 1252, 1987.
15
Gonz ´alez, N., Anad ´on, R., and Mara ˜n ´on, E.: Large-scale variability of planktonic net community metabolism in the Atlantic Ocean: importance of temporal changes in oligotrophic subtropical waters, Mar. Ecol.-Prog. Ser., 233, 21–30, 2002.
Hanegraaf, P. P. F. and Kooi, B. W.: The dynamics of a tri-trophic food chain with two-component populations from a biochemical perspective, Ecol. Model., 152(1), 47–64, 2002.
20
Hansell, D. A., Bates, N. R., and Gundersen, K.: Mineralization of dissolved organic carbon in the Sargasso Sea, Mar. Chem., 51(3), 201–212, 1995.
Hedges, J. I.: Global biogeochemical cycles: progress and problems, Mar. Chem., 39, 67–93, 1992.
Jahnke, R. A. and Craven, D. B.: Quantifying the role of heterotrophic bacteria in the carbon
25
cycle – a need for respiration rate measurements, Limnol. Oceanogr., 40(2), 436–441, 1995. Konopka, A.: Theoretical analysis of the starvation response under substrate pulses, Microb.
Ecol., 38(4), 321–329, 1999.
Kooi, B. W. and Kooijman, S. A. L. M.: The transient-behaviour of food-chains in chemostats, J. Theor. Biol., 170(1), 87–94, 1994.
30
Kooijman, S. A. L. M.: Dynamic energy and mass budgets in biological systems, 2nd ed., Cambridge University Press, Cambridge, 424 pp., 2000.
La Ferla, R., Azzaro, F., Azzaro, M., Caruso, G., Decembrini, F., Leonardi, M., Maimone, G.,
BGD
7, 787–822, 2010Increased bacterial growth efficiency with environmental
variability
M. Eichinger et al.
Title Page
Abstract Introduction
Conclusions References
Tables Figures
◭ ◮
◭ ◮
Back Close
Full Screen / Esc
Printer-friendly Version
Interactive Discussion Monticelli, L. S., Raffa, F., Santinelli, C., Zaccone, R., and Ribera d’Alcal ´a, M.: Microbial
con-tribution to carbon biogeochemistry in the Central Mediterranean Sea: variability of activities and biomass, J. Marine Syst., 57, 146–166, 2005.
Lancelot, C., Staneva, J., Van Eeckhout, D., Beckers, J. M., and Stanev, E.: Modelling the Danube-influenced north-western continental shelf of the Black Sea. II: Ecosystem response
5
to changes in nutrient delivery by the Danube River after its damming in 1972, Estuar. Coast. Shelf S., 54(3), 473–499, 2002.
Lyman J. and Fleming R.: Composition of sea water, J. Mar. Res., 3, 134–146, 1940.
Marr, A. G., Nilson, E. H., and Clark, D. J.: The maintenance requirement ofEscherichia coli, Ann. NY Acad. Sci., 102, 536–548, 1963.
10
Monod, J.: Recherches sur la croissance des cultures bact ´eriennes, Ph.D. thesis, University of Paris, Paris, France, 1942.
Nagata, T.: Production mechanisms of dissolved organic matter, in: Microbial Ecology of the Oceans, edited by: Kirchman, D. L., Wiley-Liss, New York, 121–152, 2000.
Pirt, S. J.: The maintenance energy of bacteria in growing cultures, P. Roy. Soc. Lond. B Bio.,
15
163, 224–231, 1965.
Pomeroy, L. R.: The ocean’s food web, a changing paradigm, Bioscience, 24, 499–504, 1974. Raymond, P. A. and Bauer, J. E.: Bacterial consumption of DOC during transport through
a temperate estuary, Aquat. Microb. Ecol., 22, 1–12, 2000.
Reinthaler, T. and Herndl, G. J.: Seasonal dynamics of bacterial growth efficiencies in relation
20
to phytoplankton in the southern North Sea, Aquat. Microb. Ecol., 39(1), 7–16, 2005. Rivkin, R. B. and Legendre, L.: Biogenic carbon cycling in the upper ocean: effects of microbial
respiration, Science, 291(5512), 2398–2400, 2001.
Semp ´er ´e, R., Van Wambeke, F., Azourmanian, H., Chambaut, A. L., Ferri `ere, L., and Bianchi, M.: On the use of batch systems to determine DOC bacterial lability and
bacte-25
rial growth efficiency in seawater samples, in: Integrated Marine System Analysis, edited by: Bayens, J., Dehairs, F., and Goyens, L., European Network for integrated Marine System Analysis, Brussels, 233–238, 1998.
Semp ´er ´e, R., Yoro, S. C., Van Wambeke, F., and Charri `ere, B.: Microbial decomposition of large organic particles in the northwestern Mediterranean Sea: an experimental approach,
30
Mar. Ecol.-Prog. Ser., 198, 61–72, 2000.
BGD
7, 787–822, 2010Increased bacterial growth efficiency with environmental
variability
M. Eichinger et al.
Title Page
Abstract Introduction
Conclusions References
Tables Figures
◭ ◮
◭ ◮
Back Close
Full Screen / Esc
Printer-friendly Version
Interactive Discussion Tolla, C., Kooijman, S. A. L. M., and Poggiale, J. C.: A kinetic inhibition mechanism for
mainte-nance, J. Theor. Biol., 244(4), 576–587, 2007.
Williams, P. J. L. B.: Heterotrophic bacteria and the dynamics of dissolved organic material, in: Microbial Ecology of the Oceans, edited by: Kirchman, D. L., Wiley-Liss, New York, 153–199, 2000.
5
Williams, P. M. and Druffel, E. R. M.: Radiocarbon in dissolved organic-matter in the central north Pacific-Ocean, Nature, 330(6145), 246–248, 1987.
BGD
7, 787–822, 2010Increased bacterial growth efficiency with environmental
variability
M. Eichinger et al.
Title Page
Abstract Introduction
Conclusions References
Tables Figures
◭ ◮
◭ ◮
Back Close
Full Screen / Esc
Printer-friendly Version
Interactive Discussion
Table 1.Symbols, units and descriptions of notations, state variables and parameters used in each model.
Symbol Unit Description Models
Monod Marr-Pirt DEB
General notations
j∗1∗2 h− 1
Specific flux of state variable∗1 x x x associated with process∗2
y∗1∗2 – Yield coefficient (efficiency) of state x x x variable∗2on state variable∗1
Processes
A Assimilation x x x
M Maintenance x x x
State variables
L mM C Substrate (L-DOC) concentration x x x
ME mM C Reserve concentration x
MV mM C Structure concentration x
BB mM C Bacterial biomass x x
R mM C R-DOC (non-labile DOC) concentration x x
Parameters
jLAm h− 1
Maximum specific substrate utilisation rate x x x
K mM C Half-saturation constant x x x
α= jLAm/K
mM C−1 h−1
Ratio betweenjLAmandK x x x
kE h− 1
Reserve turnover rate x
yM
EL – Yield coefficient from L-DOC to reserve x
yB
BL Yield coefficient from L-DOC to biomass x x
yM
EMV – Yield coefficient from structure to reserve x
yRM
V – Yield coefficient from structure to R-DOC x
yRB
B – Yield coefficient from biomass to R-DOC x
jM
EM h
−1
Maintenance flux from reserve x
jB
BM h
−1
Maintenance flux from biomass x
jMVM h −1
BGD
7, 787–822, 2010Increased bacterial growth efficiency with environmental
variability
M. Eichinger et al.
Title Page
Abstract Introduction
Conclusions References
Tables Figures
◭ ◮
◭ ◮
Back Close
Full Screen / Esc
Printer-friendly Version
Interactive Discussion
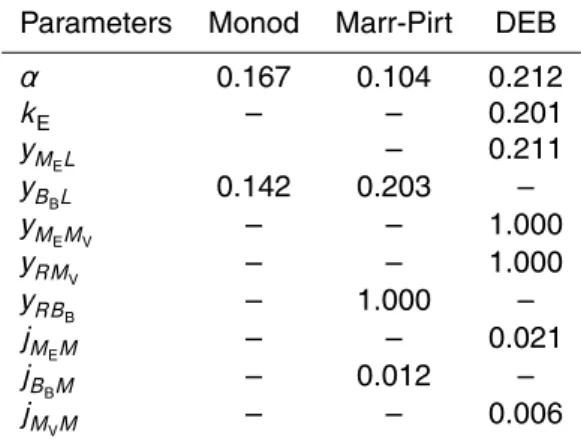
Table 2. Parameter values for each of the three models for experiment B. POC and DOC data were corrected for bacteria passing through the filters. Parameters were estimated by the minimisation of the sum of squared deviations of model predictions to data points. As the Monod model cannot produce any release of non-labile material, DOC concentrations were modified by subtracting the R-DOC concentration at the end of the experiment from each DOC data point.
Parameters Monod Marr-Pirt DEB
α 0.167 0.104 0.212
kE – – 0.201
yMEL – 0.211
yBBL 0.142 0.203 –
yMEMV – – 1.000
yRM
V – – 1.000
yRB
B – 1.000 –
jM
EM – – 0.021
jB
BM – 0.012 –
jM
VM – – 0.006
BGD
7, 787–822, 2010Increased bacterial growth efficiency with environmental
variability
M. Eichinger et al.
Title Page
Abstract Introduction
Conclusions References
Tables Figures
◭ ◮
◭ ◮
Back Close
Full Screen / Esc
Printer-friendly Version
Interactive Discussion
Table 3. Parameter values for each of the three models for experiment P. Parameters were estimated by the minimisation of the sum of squared deviations of model predictions to data points. As the Monod model cannot produce any release of non-labile material, DOC data were modified to account for only the labile part of DOC by using the following equation: L-DOC=DOC−(0.0038t+0.1067). This does not affect parameter and BGE estimations.
Parameters Monod Marr-Pirt DEB
α 0.364 0.347 0.484
kE – – 0.603
yMEL – – 0.500
yBBL 0.234 0.382 –
yMEMV – – 1.492
yRM
V – – 1.000
yRB
B – 0.855 –
jM
EM – – 0.000
jB
BM – 0.004 –
jM
BGD
7, 787–822, 2010Increased bacterial growth efficiency with environmental
variability
M. Eichinger et al.
Title Page
Abstract Introduction
Conclusions References
Tables Figures
◭ ◮
◭ ◮
Back Close
Full Screen / Esc
Printer-friendly Version
Interactive Discussion
Table 4. Summary of the different formulae used to estimate BGE, directly from data points (experimental) or with three models (Monod, Marr-Pirt and DEB models) for the pulse (P) and batch (B) experiments, and their corresponding values. The right side of the analytical formulae has been calculated with equations of each model (Eq. 1–3). The last column represents parameters of each model to which BGE values corresponds analytically (see Fig. 5).
Method of Analytical BGE formula P B Parameter equivalent
BGE estimation experiment experiment with BGE value
Experimental ∆POC
−∆DOC 0.27 0.14
Monod model d BB
−d L=yBBL 0.23 0.14 yBBL
Marr-Pirt model d BB
−d L=yBBL− jBBM
αL 0.38 0.20 yBBL
DEB model d(ME/yEV+MV)
−d L =
yMEL
yMEMV− jMEM
yMEMVαL
0.34 0.21 yMEL
yMEMV