EFFECTS OF SHORT TERM PRACTICE OF BHASTRIKA PRANAYAMA ON METABOLIC FITNESS (METF) AND BONE INTEGRITY (BI)
Baljinder Singh Bal
Department of Physical Education, Guru Nanak Dev University, Amritsar, India
Abstract. Purpose: The present study was conducted with the objective to determine the short term practice of bhastrika pranayama on Metabolic Fitness and Bone Integrity.Material: 30 university level females between the age group of 21-26 years were selected. The subjects were randomly matched and assigned into two groups: Group-A: Experimental (n1=15); Group-B: Control (n2=15). The subjects from Group-A: Experimental were provided to a 4-weeks bhastrika
pranayama. Statistical Analysis:Student t test for paired samples was utilized to compare the means of the pre-test and the post-test. Results & Conclusions: Based on the analysis of the results obtained, we conclude that the significant differences were found in Metabolic Fitness (i.e., Maximal Oxygen Consumption (VO2max) and blood pressure of
University Level Girls. Insignificant between-group differences were noted in Blood Lipid, Blood Sugar and Bone Integrity of University Level Girls.
Keywords: Bhastrika Pranayama, Metabolic, Fitness, Bone Integrity.
Introduction1
Yoga breathing is considered an intermediary between the mind and body. Yoga breathing owes their great potentials to prana. Regular practice of yoga breathing gives maximum benefits through complete and comprehensive utilization of the prana system [8]. The physiological and psychological benefits of yoga have been demonstrated in several studies [1, 2, 3, 4]. Numerous researches clearly reveal that regular practice of yoga leads to enhancement in physical and physiological functions and human sports performance. Some reports show the benefits in both peripheral nerve function [5] as well as central neuronal processes [6, 7]. According to literature one can reveal that the very meaning of yoga is to achieve a balance within the internal and external environment, in this manner looking for to accomplish physical, spiritual and mental well-being. This is made possible through the practice of "Pranayama" or breathing exercises, "Asana" or specific postures, and Meditation [9]. It is a notion that regular practicing of yoga over a period of time guides to a decrease in muscular relaxation, physical and respiratory rate, along with calming of the mind, and decreased state of arousal [10, 11]. Growing number of evidences have claimed that yoga practices increases longevity, [12] has therapeutic [13] and rehabilitative effects. The beneficial effects of six weeks practice of different pranayamas are well reported and have sound scientific basis [14]. Yoga, which is a way of life, is characterized by balance, health, harmony, and bliss. [15]. By practicing yoga, a person is supposed to reach a state of mental equanimity, where responses to favorable or unfavorable external events are well under the individual’s control, and responses are moderate in intensity [16]. The science of yoga is a powerful stream of knowledge, which enables the practitioners to achieve radiant physical health, serene mind, continues spiritual uplift, and creates the ability for harmonious social living [17]. Pranayam, the fourth step of ashtang yoga is an important component of yoga training [18]. The very meaning of yoga is to achieve a balance within the internal and external environment, thereby seeking to attain mental, spiritual and physical well-being. This is made possible through the practice of "Pranayama" or breathing exercises, "Asana" or specific postures, and Meditation [19]. It is thought that practicing yoga over a period of time leads to a decrease in respiratory rate, muscular relaxation along with calming of the mind, which might be interpreted at least partly as a decreased state of arousal [20-21]. But various studies show that respiratory parameters improve after yoga & pranayama. A significant increase in the vital capacity, tidal volume increase in expiratory and inspiratory pressures and breath’s holding time [22]. Pranayama has immense therapeutic potential in a wide range of psychosomatic disorders, but there is currently lack of an adequate meta-analysis in relation to Bhastrika Pranayama to assess its efficacy with respect to Metabolic Fitness (MetF) and Bone Integrity (BI) and as a result the present study was conducted to find out therapeutic effects of Bhastrika Pranayama on Metabolic Fitness (MetF) and Bone Integrity (BI).
Material and Methods Subjects
Thirty, university level women between the age group of 21-26 years were selected. The subjects were randomly matched and assigned into two groups: Group-A: Experimental (n1=15); Group-B: Control (n2=15).
Table 1. Distribution and Demographics of Subjects.
Sample Size (N=30) Variables Total
(N=30)
Experimental group (n1=15)
Control group (n2=15)
Methodology
This study is designed as a retrospective cross-sectional study. The subjects from Group-A: Experimental were provided to a 4-week training of BhastrikaPranayama. This lasted 4 weeks and consisted of daily sessions.
Maximal oxygen uptake (VO2max) was used as a measure of fitness of cardiopulmonary system and was assessed by a running test at maximal pace on a treadmill. Maximal oxygen uptake was scaled relative to body weight (mL . min-1.kg-2/3).
Blood samples (10 ml) for the determination of lipid profiles were obtained. All of biochemical tests have been done with serum samples.
Blood pressure was assessed by Sphygmomanometer.
The blood sugar levels were measured by Digital Glucometer (ACCU-CHEK, Sr no-GN20606850 manufactured by Roche Diagnostics India Pvt. Ltd, Mumbai).
Bone mineral density (BMD) of lumbar spine (L2-L4) was assessed by dual-energy X-ray absorptiometry (DXA) with the help of a Hologic QDR 1500W (Bedford, MA, USA).
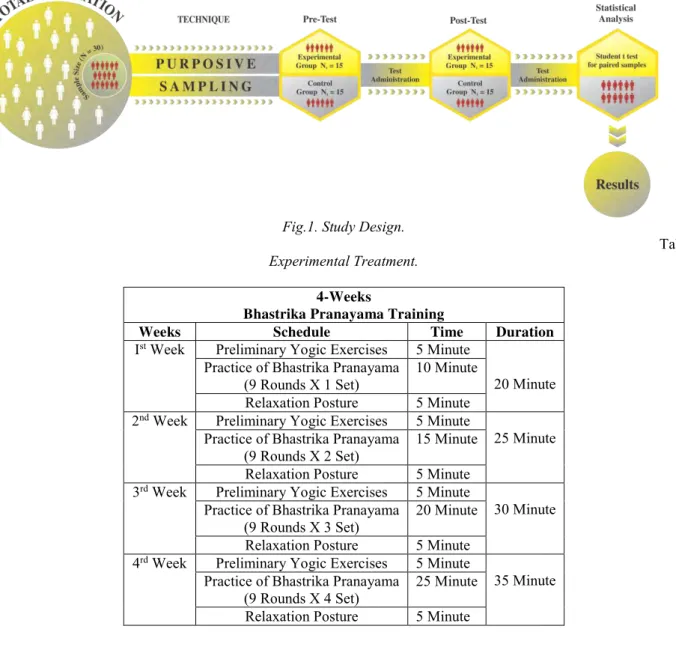
Fig.1. Study Design.
Table 2 Experimental Treatment.
4-Weeks
Bhastrika Pranayama Training
Weeks Schedule Time Duration
Ist Week Preliminary Yogic Exercises 5 Minute
20 Minute Practice of Bhastrika Pranayama
(9 Rounds X 1 Set) 10 Minute Relaxation Posture 5 Minute 2nd Week Preliminary Yogic Exercises 5 Minute
25 Minute Practice of Bhastrika Pranayama
(9 Rounds X 2 Set) 15 Minute Relaxation Posture 5 Minute 3rd Week Preliminary Yogic Exercises 5 Minute
30 Minute Practice of Bhastrika Pranayama
(9 Rounds X 3 Set) 20 Minute Relaxation Posture 5 Minute 4rd Week Preliminary Yogic Exercises 5 Minute
35 Minute Practice of Bhastrika Pranayama
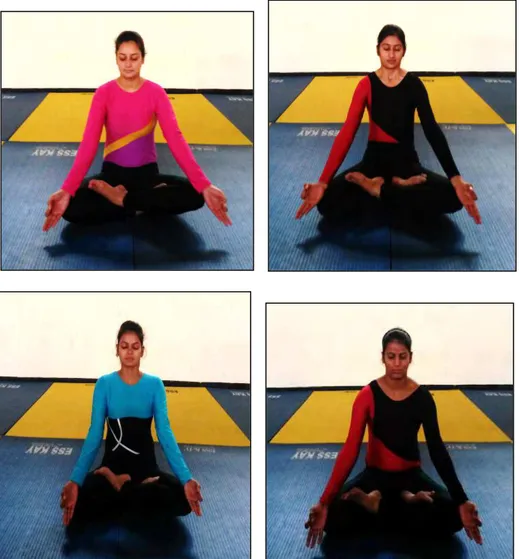
Fig. 2. Subjects Performing Bhastrika Pranayama. Statistical Analyses
Data are expressed as the mean ± SD. Student t test for paired samples was utilized to compare the means of the pre-test and the post-test.
Results
Table 3 Mean values (±SD) and Paired Sample t-test of Metabolic Fitness (MetF) (i.e., Maximal Oxygen Consumption (VO2max), Blood Lipid, Blood Pressure and Blood Sugar) in Experimental and Control group (n=15 each) before (Pre)
and after (Post) 4-weeks Bhastrika Pranayama Training Programme (Experimental group only).
Parameters Group Pre-Test Post-Test t-value p-value
Maximal Oxygen Consumption
(VO2max)
Experimental 33.24±2.38 34.48±1.63 5.145* 0.0001
Control 22.66±0.40 22.48±0.29 1.5730 0.1380
Blood
Lipid
Cholesterol Experimental 159.26±10.74 159.33±10.77 1.375 0.190 Control 154.25±12.25 154.44±12.07 0.9242 0.3710
Triglycerides Experimental 146.56±1.90 146.76±1.71 1.462 0.165 Control 135.82±8.72 135.83±8.69 1.450 0.168
Parameters Group Pre-Test Post-Test t-value p-value
Blood
Pressure
Diastolic Blood
Pressure
Experimental 75.47±2.00 78.13±2.13 6.324* 0.0001
Control 83.33±2.55 84.13±1.88 1.1687 0.2620
Blood
Sugar
Fasting Blood Sugar Experimental 95.07±2.79 96.53±3.11 1.3291 0.2051 Control 85.47±3.07 86.40±3.62 0.8750 0.3963
Post Prandial Blood
Sugar
Experimental 124.20±3.17 125.67±2.66 1.0822 0.2975
Control 133.53±4.29 135.00±3.00 0.9644 0.3512
Maximal Oxygen Consumption (VO2max)
The results of Metabolic Fitness (MetF) in group (Experimental) and group (Control) are shown in Table-3. The Mean and Standard Deviation (±SD) values of Maximal Oxygen Consumption (VO2max) of pre-test and post-test of
experimental group were 33.24±2.38 & 34.48±1.63 respectively. However, the Mean and Standard Deviation (±SD) values of Maximal Oxygen Consumption (VO2max) of pre-test and post-test of control group were 22.66±0.40 &
22.48±0.29. The t-value in case of experimental group was 5.145*and for control group it was 1.5730.
Significant between-group differences were noted in Maximal Oxygen Consumption (VO2max) in the
experimental group before (Pre) and after (Post) subjected to 4-week Bhastrika Pranayama Training Programme since, the calculated value of (t=5.145*) is greater than tabulated value of t.05 (14)=2.1448 for the selected degree of freedom
and level of significance. However, no significant changes over that 4- week period were noted in the control group. Cholesterol
The Mean and Standard Deviation values (±SD) of Cholesterol of pre-test and post-test of experimental group were 159.26±10.74 and 159.33±10.77 respectively. However, the Mean and Standard Deviation (±SD) values of Cholesterol of pre-test and post-test of control group were 154.25±12.25 and 154.44±12.07. The t-value in case of experimental group was 1.375 and for control group it was 0.9242.
Insignificant between-group differences were noted in Cholesterol in the experimental group before (Pre) and after (Post) subjected to 4-week Bhastrika Pranayama Training Programme since, the calculated value of (t=1.375) is less than tabulated value of t.05 (14) = 2.1448 for the selected degree of freedom and level of significance. However, no
significant changes over that 4- week period were noted in the control group. Triglycerides
The mean and standard deviation values of Triglycerides of pre and post-test of experimental group were 146.56±1.90 and 146.76±1.71 respectively. However, the mean and standard deviation values of Triglycerides of pre and post-test of control group were 135.82±8.72 and 135.83±8.69. The t-value in case of experimental group was 1.462 and for control group it was 1.450.
Insignificant between-group differences were noted in Triglycerides in the experimental group before (Pre) and after (Post) subjected to 4-week Bhastrika Pranayama Training Programme since, the calculated value of (t=1.462) is less than tabulated value of t.05 (14)=2.1448 for the selected degree of freedom and level of significance. However, no
significant changes over that 4- week period were noted in the control group. Systolic Blood Pressure
The Mean and Standard Deviation (±SD) values of Systolic Blood Pressure of pre-test and post-test of experimental group were 117.13±1.60 & 118.60±1.24 respectively. However, the Mean and Standard Deviation (±SD) values of Systolic Blood Pressure of pre-test and post-test of control group were 125.93±3.45 & 126.40±2.23. The t-value in case of experimental group was 6.204* and for control group it was 0.5191.
Significant between-group differences were noted in Systolic Blood Pressure in the experimental group before (Pre) and after (Post) subjected to 4-week Bhastrika Pranayama Training Programme since, the calculated value of (t=6.204*) is greater than tabulated value of t.05 (14)=2.1448 for the selected degree of freedom and level of significance.
However, no significant changes over that 4- week period were noted in the control group. Diastolic Blood Pressure
The Mean and Standard Deviation (±SD) values of Diastolic Blood Pressure of pre-test and post-test of experimental group were 75.47±2.00 & 78.13±2.13 respectively. However, the Mean and Standard Deviation (±SD) values of Diastolic Blood Pressure of pre-test and post-test of control group were 83.33±2.55 & 84.13±1.88. The t-value in case of experimental group was 6.324* and for control group it was 1.1687.
Fasting Blood Sugar
The Mean and Standard Deviation (±SD) values of Fasting Blood Sugar of pre-test and post-test of experimental group were 95.07±2.79 & 96.53±3.11 respectively. However, the Mean and Standard Deviation (±SD) values of Fasting Blood Sugar of pre-test and post-test of control group were 85.47±3.07 & 86.40±3.62. The t-value in case of experimental group was 1.3291 and for control group it was 0.8750.
Insignificant between-group differences were noted in Fasting Blood Sugar in the experimental group before (Pre) and after (Post) subjected to 4-week Bhastrika Pranayama Training Programme since, the calculated value of (t=1.3291) is less than tabulated value of t.05 (14)=2.1448 for the selected degree of freedom and level of significance.
However, no significant changes over that 4- week period were noted in the control group. Post Prandial Blood Sugar
The Mean and Standard Deviation (±SD) values of Post Prandial Blood Sugar of pre-test and post-test of experimental group were 124.20±3.17 & 125.67±2.66 respectively. However, the Mean and Standard Deviation (±SD) values of Post Prandial Blood Sugar of pre-test and postest of control group were 133.53±4.29 & 135.00±3.00. The t-value in case of experimental group was 1.0822 and for control group it was 0.9644.
Insignificant between-group differences were noted in Post Prandial Blood Sugar in the experimental group before (Pre) and after (Post) subjected to 4-week Bhastrika Pranayama Training Programme since, the calculated value of (t=1.0822) is less than tabulated value of t.05 (14)=2.1448 for the selected degree of freedom and level of significance.
However, no significant changes over that 4- week period were noted in the control group.
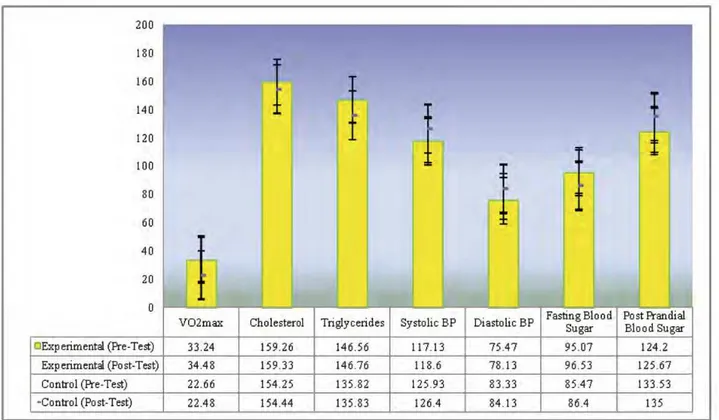
Fig. 3.Mean values of Metabolic Fitness (MetF) (i.e., Maximal Oxygen Consumption (VO2max), Blood Lipid and Blood
Sugar) in Experimental and Control group (n=15 each) before (Pre) and after (Post) 4-weeks Bhastrika Pranayama Training Programme (Experimental group only).
Table 4. Mean values (±SD) and Paired Sample t-test of Bone Integrity in Experimental and Control group (n=15 each) before
(Pre) and after (Post) 4-weeks Bhastrika Pranayama Training Programme (Experimental group only).
Parameters Group Pre-Test Post-Test t-value p-value
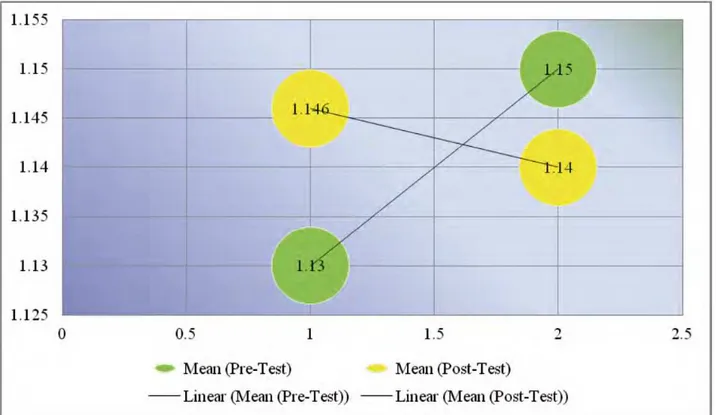
The Mean and Standard Deviation (±SD) values of Bone Integrity of pre-test and post-test of experimental group were 1.13±0.028 & 1.146±0.023 respectively. However, the Mean and Standard Deviation (±SD) values of Bone Integrity of pre-test and post-test of control group were 1.15±0.027 29 & 1.14±0.026. The t-value in case of experimental group was 1.464 and for control group it was 0.159.
Insignificant between-group differences were noted in Bone Integrity in the experimental group before (Pre) and after (Post) subjected to 4-week Bhastrika Pranayama Training Programme since, the calculated value of (t=1.464) is less than tabulated value of t.05 (14)=2.1448 for the selected degree of freedom and level of significance. However, no
significant changes over that 4- week period were noted in the control group.
Fig. 4. Mean values of Bone Integrity in Experimental and Control group (n=15 each) before (Pre) and after (Post) 4-weeks Bhastrika Pranayama Training Programme (Experimental group only).
Conclusions:
Based on the analysis of the results obtained, we conclude that the significant differences were found in Metabolic Fitness (MetF) (i.e., Maximal Oxygen Consumption (VO2max) and blood pressure of University Level Girls.
Insignificant between-group differences were noted in Blood Lipid, Blood Sugar and Bone Integrity of University Level Girls.
References:
1. Madanmohan Thombre DP, & Bharathi B. Effect of yoga training on reaction time, respiratory endurance and muscle strength. Indian J Physiol Pharmacol. 1992;36:229-233.
2. Udupa KN, & Singh RH. The scientific basis of yoga. JAMA 1972;220:1365-1370.
3. Dostalek C. Yoga: A returning constituent of medical sciences. Yoga Mimamsa 1985;24:21–34.
4. Selvamurthy W, Nayar HS, Joseph NT, & Joseph S. Physiological effects of yogic practice. Nimhans Journal 1983;1:71-80.
5. Malhotra V, Singh S, Tandon OP, Madhu SV, Prasad A, & Sharma SB. Effect of yoga asanas on nerve conduction in type 2 diabetes. Indian J Physiol Pharmacol. 2002;46:298-306.
6. Malathi A, & Parulkar VG. Effect of Yogasanas on the visual and auditory reaction time. Indian J Physiol Pharmacol. 1989;33:110-112.
7. Telles S, Joseph C, Venkatesh S, & Desiraju T. Alterations of auditory middle latency evoked potentials during yogic consciously regulated breathing and alternative states of the mind. Int J Psychophysiol. 1993;14:189–198. 8. Nancy. The Art of Breathing, Bantam Books Publishers; New York; 1986.
9. Taimni LK. The Science of Yoga. Madras. The Theosophical Publishing House; 1961.
10. Maharishi MY. The science of being and art of living. In: Rev.ed. Los Angeles, International SRM Publications; 1969.
13. Khanam AA, Sachdev V, Guleria R, & Deepak KK. Study of Pulmonary and Autonomic Functions of Asthma Patients After Yoga Training. Indian J Physiol Pharmacol. 1996;40(4):318-24.
14. Joshi LN, Joshi VD, & Gokhale LV. Effect of Short Term Pranayama on Breathing Rate and Ventilatory Functions of Lungs. Indian J Physiol Pharmacol, 1992;36(2):105-8.
15. Patel Sanjay. Surya Namaskar-Teach You the Sun Salute. Srishti Publishers: New Delhi; 2004.
16. Nagendra HR, & Nagarathna R. New Perspectives in Stress Management. Bangalore Vivekananda Kendra Prakashana;1977.
17. Telles S, Reddy SK, Nagendra HR. Oxygen Consumption and Respiration Following Two Yoga Relaxation Techniques. Appl Psychophysiol Biofeedback 2000;25:221–7.
18. Kumar Kundan. Yogacharya. ‘Achieve Inner Well-Being Through Practice of Yoga’. The Times of India 2005;14:100-108.
19. Madanmohan T, Bharathi B, Nambinarayanan TK, Thalur S, Krishnamurthy N, & Chandrabose A. Effect of Yoga Training on Reaction Time, Respiratory Endurance and Muscle Strength. Indian J Physiol Pharmacol, 1992;36:229-233.
20. Taimni LK. The Science of Yoga. Madras, The Theosophical Publishing House; 1961.
21. Maharishi MY. The Science of Being and Art of Living. In: Rev.ed. Los Angeles, International SRM Publications; 1969.