ISSN 2005-940X
Comparison of Cerebral Glucose Metabolism between
Possible and Probable Multiple System Atrophy
Background: To investigate the relationship between presenting clinical manifestations and
imaging features of multisystem neuronal dysfunction in MSA patients, using 18 F-fluoro-deoxyglucose positron emission tomography (18F-FDG PET). Methods: We studied 50 consecutive MSA patients with characteristic brain MRI findings of MSA, including 34 pa-tients with early MSA-parkinsonian (MSA-P) and 16 with early MSA-cerebellar (MSA-C). The cerebral glucose metabolism of all MSA patients was evaluated in comparison with 25 age-matched controls. 18F-FDG PET results were assessed by the Statistic Parametric Map-ping (SPM) analysis and the regions of interest (ROI) method. Results: The mean time from disease onset to 18F-FDG PET was 25.9±13.0 months in 34 MSA-P patients and 20.1± 11.1 months in 16 MSA-C patients. Glucose metabolism of the putamen showed a greater decrease in possible MSA-P than in probable MSA-P (p=0.031). Although the Unified Multiple System Atrophy Rating Scale (UMSARS) score did not differ between possible MSA-P and probable MSA-P, the subscores of rigidity (p=0.04) and bradykinesia (p= 0.008) were significantly higher in possible MSA-P than in probable MSA-P. Possible MSA-C showed a greater decrease in glucose metabolism of the cerebellum than probable MSA-C (p=0.016). Conclusions: Our results may suggest that the early neuropathological pattern of possible MSA with a predilection for the striatonigral or olivopontocerebellar system differs from that of probable MSA, which has prominent involvement of the auto-nomic nervous system in addition to the striatonigral or olivopontocerebellar system. Journal of Movement Disorders 2009;2:22-28
Key Words: Multiple system atrophy, 18F-fluorodeoxyglucose positron emission tomography,
Autonomic dysfunction, Parkinsonism, Cerebellar dysfunction.
Kyum-Yil Kwona
Jae Seung Kimb
Ki Chun Imb
Myoung Chong Leea
Sun Ju Chunga
aCenter for Parkinsonism and
Other Movement Disorders, Departments of Neurology and
bNuclear Medicine,
Asan Medical Center, University of Ulsan
College of Medicine, Seoul, Korea
Received February 14, 2009
Revised March 20, 2009
Accepted March 14, 2009
Corresponding author
Sun Ju Chung, MD, PhD Center for Parkinsonism and Other Movement Disorders, Department of Neurology,
Asan Medical Center, University of Ulsan College of Medicine,
388-1 Poongnap-dong, Songpa-gu, Seoul 138-736, Korea
Tel +82-2-3010-3988
Fax +82-2-474-4691
E-mail sjchung@amc.seoul.kr
Introduction
Multiple system atrophy (MSA) is a sporadic, relentlessly progressive neurodegenerative disorder characterized clinically by various combinations of parkinsonism, cerebellar dys-function, autonomic dysdys-function, and corticospinal tract dysfunction.1 Despite considerable recent advances in research into neurodegenerative disorders, the diagnosis of MSA still rests on the clinical history and neurological examination, and several investigations have been proposed to aid in the differential diagnosis of this disease from Parkinson’s disease or other atypical parkinsonisms.2-8
Two types of MSA have been distinguished in terms of clinicopathological correlations.1,9
Parkinsonian type MSA (MSA-P), predominantly displaying parkinsonian features, is cor-related with pathological involvement of the striatonigral system, whereas cerebellar type MSA (MSA-C), predominantly revealing cerebellar ataxia, is associated with that of the olivopontocerebellar system. MSA-P patients present initially with extrapyramidal features, and commonly progress to develop autonomic disturbances, cerebellar ataxia, or both. Con-versely, MSA-C patients who begin with cerebellar dysfunction often progress to develop parkinsonian or autonomic dysfunction, or both.
clinical features listed in the Consensus criteria. A retrospec-tive evaluation of the Consensus criteria on pathologically proven cases showed excellent positive predictive values for both possible (93%) and probable MSA (100%) at the first clinic visit,10 although the sensitivity for probable MSA was
poor.
The rate of progression in MSA may vary considerably between individual MSA patients9,11 and predictors of
pro-gression of the disease remain unclear. Although neuropatho-logical characteristics of the striatonigral system and oli-vopontocerebellar system in MSA have been described,12,13
their correlation with pathological changes of the autonomic nervous system remains to be clarified. We therefore investi-gated the cerebral glucose metabolism of patients with pos-sible MSA who had no or mild autonomic dysfunction and those with probable MSA who had severe autonomic dys-function.
Patients and Methods
Patients
We studied 34 patients with MSA-P (possible 10, probable 24) and 16 with MSA-C (possible 10, probable 6) who un-derwent 18F-fluorodeoxyglucose (FDG) PET studies within 5
years after disease onset at Asan Medical Center, South Korea, between January 2004 and July 2007. Clinical diagnoses of MSA were assessed by experienced movement disorder ex-perts (M.C.L and S.J.C). All MSA patients were diagnosed on the basis of Consensus statement for the diagnosis of MSA1 and were classified as having MSA-P or MSA-C. For the patients with possible MSA as well as those with pro-bable MSA, we only included patients who had character-istic brain MRI findings of MSA to increase the probability of clinical diagnosis of MSA.8 A detailed clinical history was obtained from each patient, and careful neurological exami-nation was performed to exclude the presence of other aty-pical parkinsonism such as progressive supranuclear gaze palsy, corticobasal degeneration, or frontotemporal dementia. Patients excluded from this study included those with symp-toms suggestive of Parkinson’s disease, other atypical parkin-sonism, secondary parkinparkin-sonism, dementia, other significant neurologic diseases, psychiastric disorders, or severe systemic illness. In all patients, PET studies were performed after written informed consents.
Clinical assessment
Patients were assessed on disease duration, Unified Par-kinson’s Disease Rating Scale (UPDRS),14 Unified Multiple
System Atrophy Rating Scale (UMSARS),15 and Hoehn and Yahr stage. The tremor score was defined as the sum of the motor subscore of UPDRS part III items 20 (resting type) and 21 (postural type) in all four limbs and face (score range,
0-28). The rigidity score was defined as the sum of the motor subscore of UPDRS part III item 22 in all four limbs and neck (score range, 0-20). The bradykinesia score was de-fined as the sum of the motor subscore of UPDRS part III items 23-26 and 31 in all four limbs and body (score range, 0-36). The ‘axial’ subscore was defined as the sum of the motor subscores for speech, facial expression, chin-tongue tremor, neck rigidity, arising from a chair, posture, and body bradykinesia (items 18-20, 22, 27, 28, and 31 of UPDRS part III)(score range, 0-28). The postural instability and gait diffi-culty (PIGD) subscore was defined as the sum of the motor subscores of the UPDRS part III items 13, 15, 29, and 30 (score range, 0-16).
Patients with MSA-P or MSA-C were divided into two groups according to disease duration (≤2 vs. >2 years), Hoehn and Yahr stage (≤2 vs. >2), and diagnostic category (possible vs. probable MSA).
18F-FDG PET scans and statistical parametric
mapping analysis
18F-FDG PET was performed in all 50 patients with MSA,
all of whom had fasted for at least 6 hours before the scan. Transmission scan of 5 min using a 68Ge rotating pin source
and emission scan of 15 min were acquired using ECAT HR+scanner (Siemens Medical Systems, Hoffman estate, IL,
USA) 40 min after intravenous injection of 370 MBq 18 F-FDG. The system provides 63 planes (2.46 mm slice thick-ness) and a 15.5 cm longitudinal field view. After a 5-min transmission scan for segmented attenuation correction with a rotating 68Ge source, an emission scan was acquired for 15 min in three-dimensional mode. All emission images were reconstructed with ordered subset expectation maxi-mization (OSEM) using 16 subsets and six iterations. 18F-FDG PET
images were normalized using SPM2 (Wellcome Functional Imaging Laboratory) in conjunction with MATLAB version 6.5 (The Mathworks Inc., USA) running on Windows NT. After converting the data from DICOM file into Analyze format, PET images obtained from patients with MSA symp-toms that were worse on the right side of the body were flipp-ed to the contralateral side (right) for the group analysis of ipsilateral and contralateral brain glucose metabolism. The images from each subject were spatially transformed to a generic SPM2 PET template.
Twenty-five normal volunteers (mean age, 60.4±8.4 years; 14 males and 11 females) were used as controls in the SPM analysis. All normal volunteers had no history of neurolo-gical or psycholoneurolo-gical disease, and they did not take any me-dication. Grouped 18F-FDG PET results were analyzed for
Regions of interest analysis of 18F-FDG PET To confirm the SPM results, binary comparisons according to disease duration, Hoehn and Yahr stage, and diagnostic cat-egories of MSA (possible vs. probable) were also investigated using the ROI method. We used the macroscopic anatomical parcellation method with an Automated Anatomical Labeling template16 and ROI was automatically defined among the 90
three-dimensional anatomical volumes of interest on the basis of SPM results. The average glucose metabolic activity of each ROI (putamen and cerebellum) was calculated by total glucose activity of the ROI divided by its volume (MBq/cc), using the in-house program developed with Interactive Data Language (IDL, version 5.5). For quantitative analysis, the in-dividual value of the ROI was normalized to the global brain activity to correct for intraparticipant or interparticipant varia-bility in glucose metabolism and 18F-FDG dose.
Statistical analysis
Contingency tables were analyzed using the chi-square test. The Mann-Whitney U test was used to compare non-para-metric continuous variables for different groups. For the an-alysis of SPM data, a two-sided t-test was performed to assess the group comparison. The analysis produced a t statistic for each voxel and t values were transformed to the standard dis-tribution (Z scores). SPSS for Windows (version 12.0, SPSS Inc.) was used for all statistical analyses and p values <0.05 were regarded as statistically significant.
Results
Clinical characteristics of patients
The clinical characteristics of the patients with MSA-P and MSA-C are summarized in Table 1. Patient age, disease duration, and time interval from the onset of clinical motor symptoms to the 18F-FDG PET study did not differ
signifi-cantly between possible and probable MSA subtypes.
18F-FDG PET analysis of MSA-P using SPM and
ROI methods
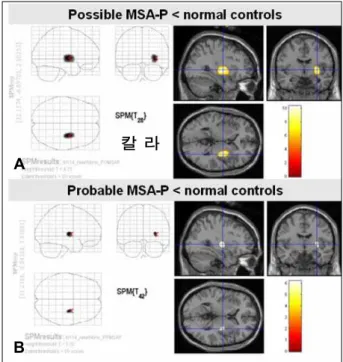
SPM analysis of the MSA-P group in comparison with
nor-mal controls (Figure 1) revealed a greater decrease in glucose metabolism visually in the putamen contralateral to the body side with worse parkinsonism in patients with possible MSA-P than in those with probable MSA-MSA-P. ROI method analysis (Figure 2) also showed a greater decrease in glucose meta-bolism in the putamen contralateral to the body side with worse parkinsonism in patients with possible MSA-P (median, 0.88; range, 0.84-0.98) than in those with probable MSA-P (median, 0.97; range, 0.81-1.32)(p=0.018).
There was no significant difference in glucose metabolism between MSA-P patients with disease duration of ≤2 years (median, 0.95; range, 0.81-1.33) and those with disease du-ration of >2 years (median, 0.93; range, 0.84-1.18)(p=0.584). In addition, in patients with MSA-P, glucose metabolism did not differ between patients with Hoehn and Yahr stage ≤2
Table 1. Clinical characteristics of patients with MSA
MSA-P (n=34) MSA-C (n=16)
Po ssib le (n=10) Pro b a b le (n=24)
p-v a lue
Po ssib le (n=10) Pro b a b le (n=6)
p-v a lue
O nse t a g e (ye a r) 61.0±6.00 58.6±8.40 0.384 58.0±6.70 55.0±7.70 0.480
Se x (M/ F), n 2/ 8 8/ 16 0.683 4/ 6 3/ 3 1.000
Dise a se d ura tio n (mo nth) 37.8±15.4 35.7±12.0 0.719 33.2±17.2 39.5±12.6 0.480
Asymme try, n (%) 10 (100%) 21 (87.5%) 0.539 7 (70%) 5 (83.3%) 1.000
H&Y sta g ing 2.8±0.6 3.2±1.1 0.535 2.7±0.7 2.9±0.7 0.555
Time fro m d ise a se o nse t to PET (mo nth) 22.6±9.30 27.2±14.1 0.427 21.5±13.0 17.7±7.40 0.828 Da ta a re p re se nte d a s me a n±sta nd a rd d e via tio n. MSA-P: multip le syste m a tro p p a rkinso nia n, MSA-C: multip le syste m a tro p hy-c e re b e lla r, H&Y sta g ing : Ho e hn a nd Ya hr sta g ing , PET: 18F-FDG PET.
Figure 1.Statistical parametric mapping (SPM) analysis of pos-sible and probable Parkinsonian type multiple system atrophy (MSA-P) by 18
F-FDG PET. A greater decrease in glucose metabo-lism is revealed in the putamen in patients with possible MSA-P (A) than in those with probable MSA-P (B), at a false discovery rate (FDR) corrected statistical threshold of p<0.01.
칼 라
(median, 0.93; range, 0.81-1.14) and those with Hoehn and Yahr stage >2 (median, 0.94; range, 0.84-1.33)(p=0.796).
18F-FDG PET analysis of MSA-C using SPM and
ROIs methods
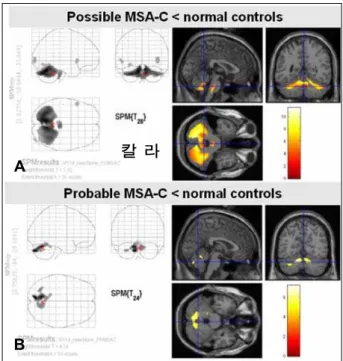
SPM analysis of the MSA-C group in comparison with normal controls (Figure 3) revealed a greater decrease in glucose metabolism visually in the cerebellum in patients with possible MSA-C than in those with probable MSA-C. ROI method analysis (Figure 4) showed a greater decrease in glucose metabolism in the cerebellum in patients with pos-sible MSA-C (median, 0.61; range, 0.53-0.69) than in those with probable MSA-C (median, 0.67; range, 0.62-0.69)(p= 0.016).
In patients with MSA-C, glucose metabolism did not differ between patients with disease duration of ≤2 years (median, 0.62; range, 0.53-0.69) and those with disease duration >2 years (median, 0.63; range, 0.58-0.69)(p=0.798), nor did glu-cose metabolism differ between patients with Hoehn and Yahr stage ≤2 (median, 0.66; range, 0.61-0.69) and those with Hoehn and Yahr stage >2 (median, 0.62; range, 0.53-0.69)(p= 0.263).
Analysis of clinical scales in patients with MSA-P UPDRS and UMSARS were evaluated in 15 patients with MSA-P (Table 2). There was no difference between patients with possible and probable MSA-P in motor UPDRS III subscores and total UPDRS scores. UMSARS Part II score
did not differ between patients with probable and possible MSA-P. However, patients with possible MSA-P showed higher subscores for rigidity and bradykinesia of the body side with worse parkinsonism than those with probable MSA-P.
Figure 4. Comparison of cerebellar metabolism between possible and probable cerebellar type multiple system atrophy (MSA-C) by
18
F-FDG PET using the regions of interest (ROI) method reveals a greater decrease in glucose metabolism in the cerebellum of patients with possible MSA-C than in those with probable MSA-C. Data are represented as median values (Mann-Whitney U test,
p=0.018) and inter-quartile ranges.
0.70
0.65
0.60
0.55
0.50
N
o
rm
a
liz
e
d
c
e
re
b
e
lla
r
m
e
ta
b
o
lis
m
Po ssib le MSA-C (n=10)
Pro b a b le MSA-C (n=6)
Figure 2. Comparison of putaminal metabolism between possible and probable Parkinsonian type multiple system atrophy (MSA-P) by 18F-FDG PET using the regions of interest (ROI) method. A
greater decrease in glucose metabolism is revealed in the puta-men contralateral to the body side with worse parkinsonism in pa-tients with possible MSA-P than in those with probable MSA-P. Data are represented as median values (Mann-Whitney U test,
p=0.018) and inter-quartile ranges.
1.4
1.3
1.2
1.1
1.0
0.9
0.8
N
o
rm
a
liz
e
d
p
u
ta
m
in
a
l
m
e
ta
b
o
lis
m
o
f
th
e
s
e
v
e
re
s
id
e
Po ssib le MSA-P (n=10)
Pro b a b le MSA-P (n=24)
Figure 3. Statistical parametric mapping (SPM) analysis of pos-sible and probable cerebellar type multiple system atrophy (MSA-C) by 18F-FDG PET. A greater decrease in glucose metabolism is revealed in the cerebellum in patients with possible MSA-C (A) than in those with probable MSA-C (B) at a false discovery rate (FDR) corrected statistical threshold ofp<0.01.
칼 라
A
There was no difference between patients with possible and probable MSA-P for tremor subscore, axial subscore, PIGD subscore, Hoehn and Yahr stage, and UMSARS Part IV scores.
Discussion
In the present study, patients with possible MSA who had no or mild autonomic dysfunction showed a greater decrease in cerebral glucose metabolism than those with probable MSA who had severe autonomic dysfunction. In addition, the scores for rigidity and bradykinesia of the body side with worse parkinsonism in patients with possible MSA-P were higher than in those with probable MSA-P. These imaging and clinical findings suggest that the pattern of pathological involvement of early probable MSA, predominantly involv-ing autonomic systems, differs from that of early possible MSA, mainly involving the striatonigral or olivopontocere-bellar system.
Our results are in line with previous suggestions that motor progression in MSA is unrelated to the presence of additional cerebellar symptoms and pyramidal signs at baseline,17 and
that progression of MSA is not uniform but depends on the presence or absence of distinct core features.18 In the present
study, although patients with possible MSA had no or mild autonomic dysfunction, they showed a greater decrease in glucose metabolism in the putamen or cerebellum than those with probable MSA, suggesting the independent pathological involvement and progression of the autonomic nervous sys-tem compared with the striatonigral or olivopontocerebellar system.
To date, the patterns and progression of pathological chan-ges of the brain and autonomic nervous system in MSA remain to be clarified. The variable combinations of clinical
manifestations of MSA suggest heterogeneous involvement of the nervous system, including the striatonigral system, olivopontocerebellar system, corticospinal tract, and auto-nomic nervous system.11-13 Clinically, a diagnosis of MSA is made based on the Consensus criteria1 and MSA categories,
including MSA-P and MSA-C, are assessed according to the predominant motor presentation. In reviewing the medical records of our patients, most patients with probable MSA developed autonomic failure earlier than parkinsonism or cerebellar dysfunction, whereas all patients with possible MSA presented with motor symptoms earlier than autonomic failure. Therefore, the diagnostic categories of MSA suggest-ed by the Consensus criteria1 may not be sufficient to rec-ognize the characteristics of heterogeneous clinical presenta-tions and the progression of MSA.
The Consensus criteria use the terms “criteria” and “fea-tures” in a specific and precise way.1 Compared with Quinn
possible and probable categories, the Consensus probable category showed considerably lower sensitivities than the possible category.10 The Consensus possible category of MSA requires a greater number of dysfunction items as options, whereas the probable category requires fewer, but more obli-gatory, items. The “criteria” items in Consensus criteria of MSA are stricter than the “feature” items of four domains that include autonomic and urinary dysfunction, parkinsonism, cerebellar dysfunction, and corticospinal tract dysfunction. The Consensus criteria of MSA,1 as well as the modified
Quinn criteria,9 were developed on the basis of expert opin-ion rather than a robust empirical evidence-based or clini-copathological correlation. Because there is no one set of ideal criteria of MSA, the Consensus possible and probable criteria can be used depending on the clinical and research objectives. The Consensus possible criteria can be used in a clinical trial
Table 2. Clinical scales in the comparison between probable and possible MSA-P
Ra ng e o f p o ssib le sc o re s
Po ssib le MSA-P (n=5)
Pro b a b le MSA-P (n=10)
p-v a lue
UPDRS III 0-108 46.8±9.90 36.9±10.2 0.165
H&Y sta g e 1-5 3.0±0.7 3.1±1.2 0.953
UMSARS Pa rt II 0-56 27.8±4.80 24.0±5.90 0.768
UMSARS Pa rt IV 1-5 2.8±1.3 2.5±1.3 0.371
Tre mo r 0-28 2.8±1.3 1.9±1.4 0.254
Rig id ity 0-20 11.2±2.20 8.1±2.5 0.040
Bra d ykine sia 0-36 20.8±4.80 16.1±4.50 0.096
Rig id ity (w o rse sid e ) 0-8 5.6±1.1 4.1±1.0 0.040
Bra d ykine sia (w o rse sid e ) 0-16 11.4±1.50 8.8±1.1 0.008
Axia l sub sc o re 0-28 12.4±3.40 10.2±4.20 0.310
PIGD sub sc o re 0-16 7.8±3.1 7.5±4.4 0.768
that requires high sensitivity at the expense of positive pre-dictive value, such as a pragmatic trial of a cheap, safe and potentially effective therapy that requires initiation early in the natural course of the disease. In the present study, 20 pa-tients with possible MSA who had characteristic brain MRI findings of MSA were evaluated.
Although several highly regarded studies have described the clinico-pathological correlations in patients with MSA,12,13,19,20
most of those studies have been retrospective and used tissue from brain banks, which might cause selection bias. These previous postmortem studies had limitations in demonstrat-ing the relation between key pathological changes and the rate of MSA progression. 18F-FDG PET provides a sensitive means of detecting and characterizing the regional changes in brain metabolism associated with MSA,7,8,21-24 and can be of diagnostic value in patients with early-stage MSA and in objectively following disease progression. Using 18F-FDG
PET, we aimed to investigate the relationship between re-gional brain metabolism and various combinations of clinical manifestations in patients with early-stage MSA. In the pre-sent study, MSA patients had mean disease durations of less than 3 years; the patients with probable MSA had obvious autonomic dysfunction and showed a lesser degree of cere-bral glucose hypometabolism than those with possible MSA who had no or mild autonomic dysfunction. Our results sug-gest that the severity of pathological involvement of the au-tonomic nervous system in MSA may not be correlated with the severity of striatonigral or olivopontocerebellar degene-ration.
Patients with MSA-P may have atypical features compared with those with Parkinson’s disease, such as poor response to levodopa,19,25 rapid disease progression,17,20,26-28 jerky postural
tremor,9 or focal reflex myoclonus.29 However, poor
diag-nostic sensitivity and accuracy of MSA among movement disorder specialists have been reported.10,30,31 In the present
study, patients with possible MSA showed a greater decrease in glucose metabolism in the putamen or cerebellum than those with probable MSA, which has clinical implications. Indeed, the identification of patients with only “possible” items of MSA is challenging, in view of the lack of definite diagnostic tests. Moreover, neuropathological studies have shown that even signs and symptoms that are considered di-agnostic of Parkinson’s disease may be found in patients ultimately recognized to have MSA.25,26,32 Therefore, the 18
F-FDG PET findings in our patients with possible MSA sug-gest that 18F-FDG PET may be a highly useful imaging tool in confirming the clinical suspicion of early-stage MSA.
The present study had limitations. First, 18F-FDG PET was
evaluated in patients clinically diagnosed with MSA, but in the absence of pathological information. Second, semi-quan-titative comparison between motor features and 18F-FDG PET findings was not performed.
In conclusion, patients with early-staged possible MSA showed a greater decrease in cerebral glucose metabolism of the putamen or cerebellum than those with early-staged pro-bable MSA. Our results suggest that the early neuropatholo-gical pattern of possible MSA with a predilection for the striatonigral or olivopontocerebellar system may differ from that of probable MSA with predominant involvement of the autonomic nervous system. A larger, well-designed prospec-tive study with neuropathological data is required to confirm our findings.
Acknowledgments
This study was supported by a grant (2007-416) from the Asan Institute for Life Sciences, Seoul, Korea.
REFERENCES
1. Gilman S, Low P, Quinn N, Albanese A, Ben-Shlomo Y, Fowler C, et al. Consensus statement on the diagnosis of multiple system atrophy. American Autonomic Society and American Academy of Neurology. Clin Auton Res 1998;8:359-362.
2. Schrag A, Kingsley D, Phatouros C, Mathias CJ, Lees AJ, Daniel SE, et al. Clinical usefulness of magnetic resonance imaging in multiple system atrophy. J Neurol Neurosurg Psychiatry 1998;65:65-71.
3. Schocke MF, Seppi K, Esterhammer R, Kremser C, Jaschke W, Poewe W, et al. Diffusion-weighted MRI differentiates the Parkinson variant of multiple system atrophy from PD. Neurology 2002;58:575-580.
4. Kraft E, Trenkwalder C, Auer DP. T2*-weighted MRI differentiates multiple system atrophy from Parkinson’s disease. Neurology 2002; 59:1265-1267.
5. Minnerop M, Specht K, Ruhlmann J, Schimke N, Abele M, Weyer A, et al. Voxel-based morphometry and voxel-based relaxometry in mul-tiple system atrophy-a comparison between clinical subtypes and cor-relations with clinical parameters. Neuroimage 2007;36:1086-1095.
6. Otsuka M, Kuwabara Y, Ichiya Y, Hosokawa S, Sasaki M, Yoshida T, et al. Differentiating between multiple system atrophy and Parkinson’s disease by positron emission tomography with 18F-dopa and 18F-FDG. Ann Nucl Med 1997;11:251-257.
7. Juh R, Pae CU, Lee CU, Yang D, Chung Y, Suh T, et al. Voxel based comparison of glucose metabolism in the differential diagnosis of the multiple system atrophy using statistical parametric mapping. Neurosci Res 2005;52:211-219.
8. Kwon KY, Choi CG, Kim JS, Lee MC, Chung SJ. Comparison of brain MRI and 18F-FDG PET in the differential diagnosis of multiple system atrophy from Parkinson’s disease. Mov Disord 2007;22:2352-2358.
9. Wenning GK, Ben Shlomo Y, Magalhães M, Daniel SE, Quinn NP. Clinical features and natural history of multiple system atrophy. An analysis of 100 cases. Brain 1994;117:835-845.
10. Osaki Y, Wenning GK, Daniel SE, Hughes A, Lees AJ, Mathias CJ, et al. Do published criteria improve clinical diagnostic accuracy in mul-tiple system atrophy? Neurology 2002;59:1486-1491.
11. Wenning GK, Tison F, Ben Shlomo Y, Daniel SE, Quinn NP. Multiple system atrophy: a review of 203 pathologically proven cases. Mov Dis-ord 1997;12:133-147.
12. Ozawa T, Paviour D, Quinn NP, Josephs KA, Sangha H, Kilford L, et al. The spectrum of pathological involvement of the striatonigral and olivopontocerebellar systems in multiple system atrophy: clinicopa-thological correlations. Brain 2004;127:2657-2671.
13. Jellinger KA, Seppi K, Wenning GK. Grading of neuropathology in multiple system atrophy: proposal for a novel scale. Mov Disord 2005; 20(Suppl 12):S29-36.
S, Marsden C, Calne D, Goldstein M, eds. Recent Developments in Parkinson’s Disease. Florham Park: Mac-Millan Health Care Informa-tion, 1987:153-163.
15. Wenning GK, Tison F, Seppi K, Sampaio C, Diem A, Yekhlef F, et al; Multiple System Atrophy Study Group. Development and validation of the Unified Multiple System Atrophy Rating Scale (UMSARS). Mov Disord 2004;19:1391-1402.
16. Tzourio-Mazoyer N, Landeau B, Papathanassiou D, Crivello F, Etard O, Delcroix N, et al. Automated anatomical labeling of activations in SPM using a macroscopic anatomical parcellation of the MNI MRI single-subject brain. Neuroimage 2002;15:273-289.
17. Seppi K, Yekhlef F, Diem A, Luginger Wolf E, Mueller J, Tison F, et al. Progression of parkinsonism in multiple system atrophy. J Neurol 2005;252:91-96.
18. Geser F, Wenning GK, Seppi K, Stampfer-Kountchev M, Scherfler C, Sawires M, et al. The European MSA Study Group. Progression of mul-tiple system atrophy (MSA): a prospective natural history study by the European MSA Study Group (EMSA SG). Mov Disord 2006;21:179-186.
19. Wenning GK, Ben-Shlomo Y, Hughes A, Daniel SE, Lees A, Quinn NP. What clinical features are most useful to distinguish definite multiple system atrophy from Parkinson’s disease? J Neurol Neurosurg Psychi-atry 2000;68:434-440.
20. Watanabe H, Saito Y, Terao S, Ando T, Kachi T, Mukai E, et al. Pro-gression and prognosis in multiple system atrophy: an analysis of 230 Japanese patients. Brain 2002;125:1070-1083.
21. Juh R, Kim J, Moon D, Choe B, Suh T. Different metabolic patterns analysis of Parkinsonism on the 18F-FDG PET. Eur J Radiol 2004;51: 223-233.
22. Eckert T, Barnes A, Dhawan V, Frucht S, Gordon MF, Feigin AS, et al. FDG PET in the differential diagnosis of parkinsonian disorders. Neu-roimage 2005;26:912-921.
23. Taniwaki T, Nakagawa M, Yamada T, Yoshida T, Ohyagi Y, Sasaki M,
et al. Cerebral metabolic changes in early multiple system atrophy: a PET study. J Neurol Sci 2002;200:79-84.
24. Antonini A, Leenders KL, Vontobel P, Maguire RP, Missimer J, Psylla M, et aI. Complementary PET studies of striatal neuronal function in the differential diagnosis between multiple system atrophy and Par-kinson’s disease. Brain 1997;120:2187-2195.
25. Hughes AJ, Colosimo C, Kleedorfer B, Daniel SE, Lees AJ. The do-paminergic response in multiple system atrophy. J Neurol Neurosurg Psychiatry 1992;55:1009-1013.
26. Colosimo C, Albanese A, Hughes AJ, de Bruin VM, Lees AJ. Some specific clinical features differentiate multiple system atrophy (striato-nigral variety) from Parkinson’s disease. Arch Neurol 1995;52:294-298.
27. Schulz JB, Klockgether T, Petersen D, Jauch M, Müller-Schauenburg W, Spieker S, et al. Multiple system atrophy: natural history, MRI mor-phology, and dopamine receptor imaging with 123IBZM-SPECT. J Neurol Neurosurg Psychiatry 1994;57:1047-1056.
28. Müller J, Wenning GK, Jellinger K, McKee A, Poewe W, Litvan I. Progression of Hoehn and Yahr stages in Parkinsonian disorders: a cli-nicopathologic study. Neurology 2000;55:888-891.
29. Rodriguez ME, Artieda J, Zubieta JL, Obeso JA. Reflex myoclonus in olivopontocerebellar atrophy. J Neurol Neurosurg Psychiatry 1994;57: 316-319.
30. Litvan I, Goetz CG, Jankovic J, Wenning GK, Booth V, Bartko JJ, et al. What is the accuracy of the clinical diagnosis of multiple system atro-phy? A clinicopathologic study. Arch Neurol 1997;54:937-944.
31. Hughes AJ, Daniel SE, Ben-Shlomo Y, Lees AJ. The accuracy of di-agnosis of parkinsonian syndromes in a specialist movement disorder service. Brain 2002;125:861-870.