doi:10.5194/bg-8-2895-2011
© Author(s) 2011. CC Attribution 3.0 License.
Application of
δ
13
C and
δ
15
N isotopic signatures of organic matter
fractions sequentially separated from adjacent arable and forest
soils to identify carbon stabilization mechanisms
Z. E. Kayler1, M. Kaiser2, A. Gessler1,5, R. H. Ellerbrock3, and M. Sommer3,4
1Institute for Landscape Biogeochemistry, Leibniz-Center for Agricultural Landscape Research (ZALF), Eberswalderstr. 84,
15374 M¨uncheberg, Germany
2School of Natural Sciences, University of California – Merced, 4225 N. Hospital Road, Atwater 95301, California, USA 3Institute of Soil Landscape Research, Leibniz-Center for Agricultural Landscape Research (ZALF), Eberswalderstr. 84,
15374 M¨uncheberg, Germany
4Institute of Earth and Environmental Sciences, University of Potsdam, Karl-Liebknecht-Str. 24–25, 14476 Potsdam,
Germany
5Professorship for Landscape Biogeochemistry, Faculty of Agriculture and Horticulture, Humboldt University at Berlin,
Lentze-Allee 75, 14195 Berlin, Germany
Received: 28 January 2011 – Published in Biogeosciences Discuss.: 1 March 2011
Revised: 12 September 2011 – Accepted: 25 September 2011 – Published: 17 October 2011
Abstract. Identifying the chemical mechanisms behind soil carbon bound in organo-mineral complexes is necessary to determine the degree to which soil organic carbon is stabi-lized belowground. Analysis ofδ13C andδ15N isotopic sig-natures of stabilized OM fractions along with soil mineral characteristics may yield important information about OM-mineral associations and their processing history. We an-layzed theδ13C andδ15N isotopic signatures from two or-ganic matter (OM) fractions along with soil mineral proxies to identify the likely binding mechanisms involved. We ana-lyzed OM fractions hypothesized to contain carbon stabilized through organo-mineral complexes: (1) OM separated chem-ically with sodium pyrophosphate (OM(PY)) and (2) OM oc-cluded in micro-structures found in the chemical extraction residue (OM(ER)). Because the OM fractions were separated from five different soils with paired forest and arable land use histories, we could address the impact of land use change on carbon binding and processing mechanisms. We used partial least squares regression to analyze patterns in the isotopic signature of OM with established mineral and chemical prox-ies indicative for certain binding mechanisms. We found dif-ferent mechanisms predominate in each land use type. For arable soils, the formation of OM(PY)-Ca-mineral associ-ations was identified as an important OM binding
mecha-Correspondence to:Z. E. Kayler ([email protected])
nism. Therefore, we hypothesize an increased stabilization of microbial processed OM(PY) through Ca2+interactions.
In general, we found the forest soils to contain on average 10 % more stabilized carbon relative to total carbon stocks, than the agricultural counter part. In forest soils, we found a positive relationship between isotopic signatures of OM(PY) and the ratio of soil organic carbon content to soil surface area (SOC/SSA). This indicates that the OM(PY) fractions of forest soils represent layers of slower exchange not directly attached to mineral surfaces. From the isotopic composition of the OM(ER) fraction, we conclude that the OM in this fraction from both land use types have undergone a different pathway to stabilization that does not involve microbial pro-cessing, which may include OM which is highly protected within soil micro-structures.
1 Introduction
organic compounds at different stages of decomposition pos-ing a significant problem of characterizpos-ing the residence time of carbon belowground based on an understanding of chemi-cal and physichemi-cal properties (Kleber and Johnson, 2010). On-going challenges facing soil scientist and biogeochemists are to define and quantify which organic molecules are stabi-lized, how long carbon molecules persist in soil, and to iden-tify the underlying stabilization and destabilization mecha-nisms.
Currently, OM is considered stabilized in soil when it is protected from microbial oxidation by (1) occlusion in ag-gregates (Bachmann et al., 2008), (2) interactions with poly-valent cations (OM-cation complexes), (3) interactions via polyvalent cations with soil mineral surfaces (OM-mineral associations) (von L¨utzow et al., 2006) or OM is pre-served due to freezing temperatures, low O2content or
wa-ter saturation (climatic stabilization; Trumbore, 2009). To characterize binding mechanisms, soil OM is generally di-vided into operationally defined fractions that are hypothe-sized to contain carbon stabilized by the mechanisms pre-viously described (Mikutta et al., 2006; von L¨utzow et al., 2007; Sollins et al., 2009). Specifically, an extraction with Na-pyrophosphate solution separates soil OM that inter-acts with polyvalent cations (forming OM-cation complexes) (Masiello et al., 2004) and OM that interacts via polyvalent cations with soil mineral surfaces (forming OM-mineral as-sociations) (Wattel-Koekkoek et al., 2003; K¨ogel-Knabner et al., 2008). Consequently, Na-pyrophosphate soluble frac-tions are primarily comprised of OM stabilized through com-plexes formed with soil mineral compounds (Kaiser et al., 2011).
Experiments using changes in C3/C4 vegetation, have in-terpreted the stable isotopic signature (δ13C and δ15N) of OM fractions to determine mean residence times (Balesdent and Mariotti, 1996; Liao et al., 2006; Haile-Mariam et al., 2008; Ellerbrock and Kaiser, 2005), the impact of vegeta-tion change (Solomon et al., 2002) and mining disturbance (Wick et al., 2009). However, the potential to use the iso-topic signature of soil OM fractions to reveal OM binding mechanisms that lead to stabilization has not been fully re-alized. Studies that have analyzed the isotopic signature of soil OM fractions (beyond C3/C4 labeling techniques) have found patterns of enrichment ofδ13C andδ15N with increas-ing density of sequentially separated OM fractions (Huygens et al., 2008; Sollins et al., 2009; Marin-Spiotta et al., 2010). They attributed these patterns to isotope discrimination dur-ing microbial processdur-ing whereby microbes consume OM, respire the light isotope (carbon and nitrogen) and incorpo-rate the heavy isotope (carbon and nitrogen) into biomass that is subsequently deposited in the soil OM complex. In-deed, Huygens et al. (2008) found a high degree of microbial biomarkers in soil micro-aggregates, providing strong evi-dence that microbial processing of OM is an important step towards OM stabilization.
Analysis ofδ13C and δ15N isotopic signatures of stabi-lized OM fractions along with soil mineral characteristics may yield important information about OM-mineral asso-ciations and their processing history. For example, oxalate extractable Al and Fe contents are established proxies for poorly crystalline minerals, which form stable complexes with OM via ligand exchange reactions (Kleber et al., 2005; Mikutta et al., 2006), while polyvalent cations such as Ca2+ and Fe3+play an important role in bridging OM to mineral surfaces (Oades, 1988; Baldock and Nelson, 2000; Wuddi-vira and Camps-Roach, 2006). Thus, analyses of these prox-ies along side with patterns in stable isotopes can be used to characterize OM fractions of different land use types and potentially identify which binding mechanisms predominate. Breaking down soil OM into different fractions is nec-essary to identify which OM is stabilized, but we need a method of re-assembly to understand how OM and the differ-ent binding mechanisms are arranged in the organo-mineral complex. Kleber et al. (2007) provided such a tool by for-mulating a model that incorporates different binding mech-anisms into a zonal, structural model specific to organo-mineral interactions. While a detailed discussion of the model is beyond the scope of this paper, the model does pro-vide a framework to interpret the exchange and isotopic sig-natures of the OM directly interacting with mineral surfaces or present in the subsequent layers. The model describes a zone of direct interaction between OM and mineral surfaces (contact zone), a zone dominated by hydrophobic interac-tions and a kinetic zone of OM crosslinked via polyvalent cations. Each zone represents different levels of stabilization, the strongest being the contact zone while weak stabilization occurs in the kinetic zone.
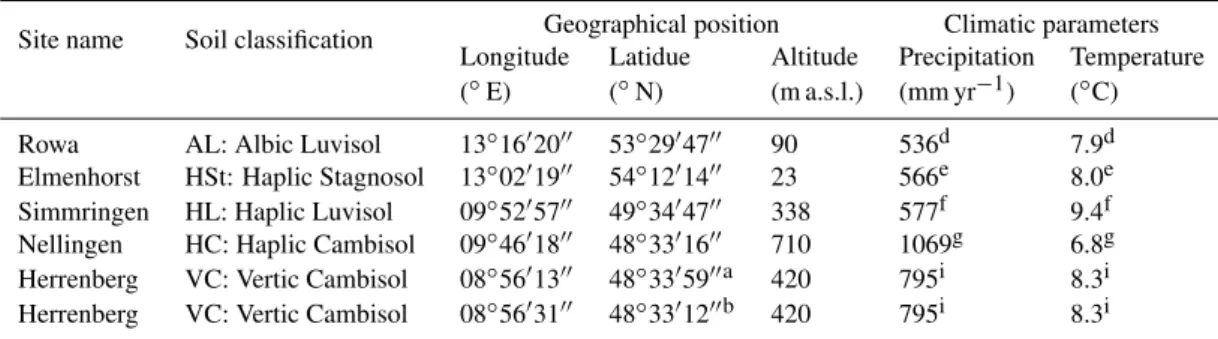
Table 1.Soil classification, coordinates, altitude, and climatic parameters for the different study sites.
Geographical position Climatic parameters Site name Soil classification
Longitude Latidue Altitude Precipitation Temperature (◦E) (◦N) (m a.s.l.) (mm yr−1) (◦C) Rowa AL: Albic Luvisol 13◦16′20′′ 53◦29′47′′ 90 536d 7.9d Elmenhorst HSt: Haplic Stagnosol 13◦02′19′′ 54◦12′14′′ 23 566e 8.0e Simmringen HL: Haplic Luvisol 09◦52′57′′ 49◦34′47′′ 338 577f 9.4f Nellingen HC: Haplic Cambisol 09◦46′18′′ 48◦33′16′′ 710 1069g 6.8g Herrenberg VC: Vertic Cambisol 08◦56′13′′ 48◦33′59′′a 420 795i 8.3i Herrenberg VC: Vertic Cambisol 08◦56′31′′ 48◦33′12′′b 420 795i 8.3i
Coordinates and altitude were taken from topographical maps with a scale of 1:25 000;acoordinates for the agricultural soil;bcoordinates for the forest soil. Soil classification was done according to WRB (2006). Climatic parameters are mean values recorded from the following climatic stations and years:dNeubrandenburg: 1961–1990;eGreifswald: 1961–1990;fW¨urzburg: 1971–2000;gGeislingen-St¨otten: 1961–1990;iRottenburg: 1961–1990.
2 Methods
2.1 Site selection and soil sampling
We selected 5 sites in Germany characterized by different soil types (Table 1) and mineral properties (Table 2). Two land use types, arable and forest, were present in close prox-imity at each site. The land uses have been practiced for at least 100 yr. Management practices, including crop ro-tation and fertilization regime, for the different sites are shown in Table 2. The selected soils were classified accord-ing to World Reference Base for Soil Resources (2006) as Albic Luvisol (AL), Haplic Stagnosol (HSt), Haplic Cam-bisol (HC), Haplic Luvisol (HL), and Vertic CamCam-bisol (VC). Kaiser et al. (2009), provides further details on soil sampling description.
2.2 Physicochemical characterization of soil samples
The pH values, and SOC, clay, silt, and sand contents were analysed as given in Kaiser et al. (2009). The amount of exchangeable cations (Caex)were determined from 5 g soil
according to Deutsche Idustrie Norm (DIN) 19684 (1977) using Inductive Coupled Plasma Optical Emission Spec-troscopy (ICP-OES; Type 138, Jobin Yvon Ltd, M¨unchen, Germany) (DIN EN ISO 11885 (1998)) and corrected by using data from blank solutions. The oxalate soluble Al and Fe (Feox, Alox)were extracted according to
Schlicht-ing et al. (1995), and the contents of Al and Fe in solu-tion were determined using ICP-OES (DIN EN ISO 11885 (1998)). All analyses were done in duplicates and the data were normalized to 105◦C dry soil. To assess the specific
surface area (SSA) of the soil mineral phase, the OM was oxidized (Kaiser and Guggenberger, 2003) using a NaOCl solution (6 %, adjusted to pH 8.0 with concentrated HCl) at a soil-to-solution ratio of 1:10 at 25◦C for 6 h (Siregar et al., 2005). The samples were centrifuged, and the super-natants were removed. The NaOCl-treatment was repeated five times (Kaiser and Guggenberger, 2003). The remaining
solid residues were then washed once with de-ionised water and centrifuged. The supernatant was removed, and the solid residue was shaken with de-ionised water overnight. Fol-lowing overnight storage, the NaOCl treated topsoil samples were dialysed and then freeze-dried (Siregar et al., 2005). The SSA of the freeze-dried solid residue was determined by N2adsorption (Quantasorb, QUANTACHROME CORP.,
Syosset, NY, USA). The NaOCl treatment did not remove the OM completely from the soil so we corrected the SSA values as determined after the NaOCl treatment according to Mikutta et al. (2005). The corrected SSA values are given in Table 3.
2.3 Sequential separation of Na-pyrophosphate (Na4P2O7) soluble OM (OM(PY)) and OM
remaining in extraction residue OM(ER)
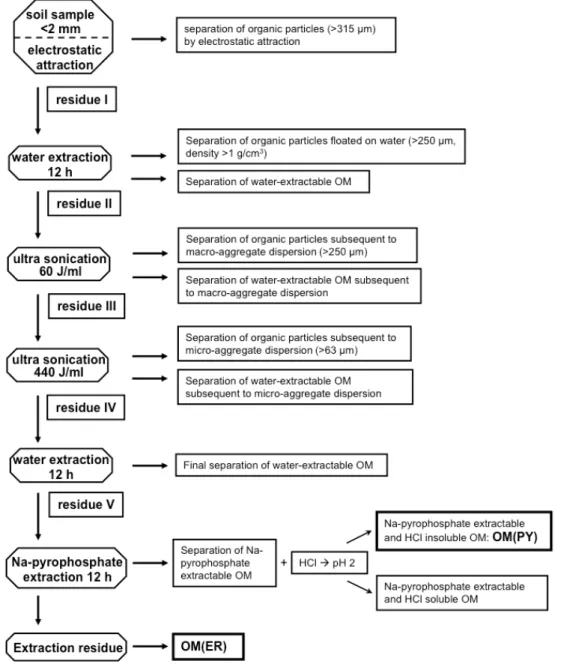
1. Following the methods of Kaiser et al. (2009, 2010) we sequentially separated the physically uncomplexed, macro- and micro-aggregate occluded organic parti-cle and water-extractable OM from air-dried (<2 mm) soil sample by a combination of electrostatic attraction, ultra-sonication (60 and 440 J ml−1), sieving, and water extraction (Fig. 1).
2. Following the methods of Ellerbrock and Kaiser (2005), the solid residue of (1) was mixed with 50 ml 0.1 m Na4P2O7 solution (pH 9–10) and shaken for 6 h with
a rock and roll shaker. The sample was centrifuged and the supernatant decanted. The decanted supernatant was filtered through a 0.45 µm polyamide filter (Schle-icher and Schuell, Dassel, Germany) and denoted as OM(PY)total. The pH of the filtrate - OM(PY)total– was
adjusted with 1 M HCl to pH 2 and cooled overnight in a refrigerator to precipitate organic matter. Then the mix-ture was centrifuged (35 min, 1400×g) to separate the
HCl soluble from the HCl insoluble (OM(PY): subfrac-tion of OM(PY)total)fraction. The reason for the
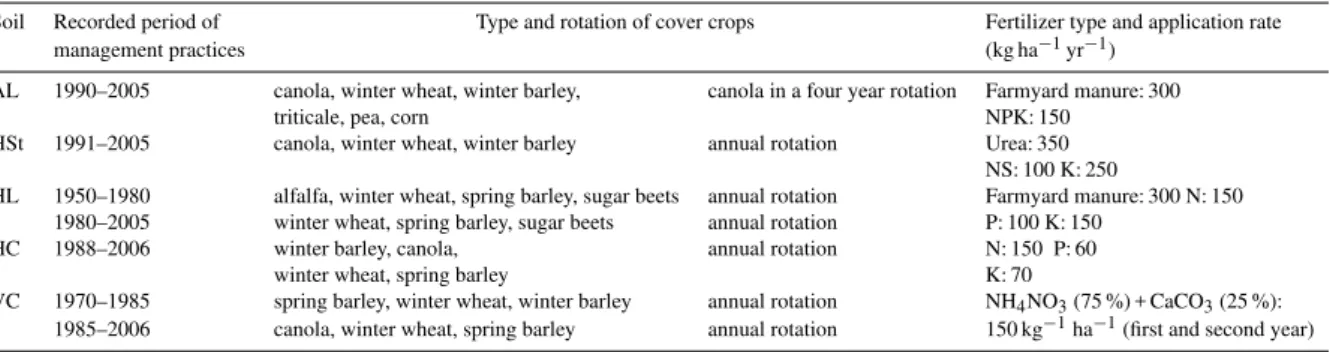
Table 2. Management practices, including duration of recorded period, type and rotation of cover crops, and fertilization regime, for the different arable sites.
Soil Recorded period of Type and rotation of cover crops Fertilizer type and application rate
management practices (kg ha−1yr−1)
AL 1990–2005 canola, winter wheat, winter barley, canola in a four year rotation Farmyard manure: 300
triticale, pea, corn NPK: 150
HSt 1991–2005 canola, winter wheat, winter barley annual rotation Urea: 350 NS: 100 K: 250
HL 1950–1980 alfalfa, winter wheat, spring barley, sugar beets annual rotation Farmyard manure: 300 N: 150 1980–2005 winter wheat, spring barley, sugar beets annual rotation P: 100 K: 150
HC 1988–2006 winter barley, canola, annual rotation N: 150 P: 60
winter wheat, spring barley K: 70
VC 1970–1985 spring barley, winter wheat, winter barley annual rotation NH4NO3(75 %) + CaCO3(25 %): 1985–2006 canola, winter wheat, spring barley annual rotation 150 kg−1ha−1(first and second year)
to concentrate high molecular OM containing carboxy-late functional groups in the OM(PY) fraction (Kaiser et al., 2011). We dialyzed and freeze dried OM that was Na4P2O7 soluble and insoluble in HCl (we
ana-lyzed this fraction’s isotopic composition and refer to it as OM(PY)) as well as the OM that was Na4P2O7
soluble and soluble in HCl.
3. The solid residues of (2) were washed with 0.1 m HCl and the Na4P2O7extraction was repeated as described
for step (2) to remove the Na4P2O7 soluble OM as
complete as possible. The remaining extraction residue (ER) was washed with destilled water and freeze dried. The OM residing in the ER (OM(ER)) might be un-extractable despite the use of H2O and Na4P2O7(step 1
and 2) due to the chemical nature of the OM (less ion-izable oxygen containing functional groups) and occlu-sion in aggregates not dispersed by ultrasonication (60 and 440 J ml−1). The ER can contain organic particles
<63 µm that cannot be distinguished by eye from min-eral particles. All extractions steps were done in 3 repli-cate samples.
2.4 Determination of the organic C contents separated by the OM(PY) and OM(ER) fractions from the soil samples
The organic C (OC) content in the OM(PY) fraction was determined (Formacs TOC Analyser, SKALAR, Breda, Netherlands) from the OC contents of the OM(PY)total
frac-tion minus the OC content of the OM fracfrac-tion that is Na4P2O7and HCl soluble (Kaiser et al., 2011). This method
was used because the precipitated Na4P2O7soluble and HCl
insoluble OM(PY) can not be homogenized and directly measured. The freeze dried ER was homogenized by grind-ing in an agate mortar. The total C content in the ER was determined by elemental analysis (vario EL, ELEMENTAR, Hanau, Germany) and was assumed to be equivalent to the OC content because the ER are free of carbonates. The data were normalized to 105◦C dry soil and given in g OC kg−1
soil.
2.5 Determination of δ13C and δ15N of OM(PY) and OM(ER)
The isotope composition of the OM(PY), and the OM(ER) fractions were analyzed at the Center for Agricultural Land-scape Research Stable Isotope Laboratory. A Thermo-Finnegan Flash HT elemental analyzer flash combusted the samples converting carbon and nitrogen to CO2and N2
re-spectively, which were separated on a gas chromatograph column. The sample gas was flushed via a con-flow III to a Thermo-Scientific, Delta V advantage isotope ratio mass spectrometer. Calibration at this facility was to IAEA-CH-6 (sucrose) and IAEA-N-1 (ammonium sulphate). The isotopic values are expressed in delta notation (in ‰ units), relative to VPDB (Vienna Pee Dee Belemnite) for carbon and N2in
air for nitrogen. Analysis of internal laboratory standards en-sured that the estimates of the organic isotopic values were accurate to within 0.1 ‰.
2.6 Statistics
Fig. 1.Organic matter fractionation scheme.
differences between soil types. From the PLS analysis we report percent of variance explained by the first three nents, weights of independent variables on the third compo-nent, and regression coefficients of the PLS model to indicate magnitude and direction of each independent variable on the variability in the isotopic data.
3 Results
The amount of OC separated by organic particle and water-extractable OM fractions relative to the bulk soil OC amount for the forest sites was 23.9 % (mean)±6.6 (s.d.) and, when
the HC soil was omitted (5.4 %), 13.6 % ±0.41 % for the
arable sites. The stablized carbon in the forest OM(PY) frac-tion was nearly twice that (20.4 %±4.8 %) of the arable sites (10.4 %±4.4 %). Differences in extractable cations were also seen between land use types. Arable sites tended to have greater exchangeable Ca(Caex)and Mg(Mgex)content which
corresponded with higher pH values as well. In general, for-est sites exhibited a higher oxalate-soluble Fe and Al content than the arable sites.
Table 3. Land use, and depth, as well as mean values of pH, and contents of sand, silt, clay, soil organic carbon (SOC; determined after the separation of organic particles by electrostatic attraction and aggregate occulded organic particles were removed), oxalate soluble Fe, Al (Feox, Alox) as well as exchangeable Ca (Caex) of the arable (Ap) and forest (Ah) topsoil samples from the Albic Luvisol (AL), Haplic
Stagnosol (HSt), Haplic Luvisol (HL), Haplic Cambisol (HC), and Vertic Cambisol (VC) sites.
Soil Land Horizon Horizon pHa Texture SOC SSA Feox Alox Caeex use Depth CaCl2 Sandb Siltc Clayd
(cm) g kg−1 g kg−1 g kg−1 g kg−1 m2g−1 mg kg−1 mg kg−1 cmol ckg−1
AL Arable Ap 0–25 6.7 592 348 69 7.4 (±0.18) 2.92 1372 (±2) 500 (±2) 3.4 Forest Ah 1/2–5/10f 3.4 616 341 63 39.0 (±0.97) 0.79 1886 (±10) 782 (±16) 0.5 HST Arable Ap 0–30 7.4 610 290 113 10.4 (±0.02) 4.09 1591 (±33) 451 (±15) 7.6 Forest Ah 2/3–10 3.6 650 279 90 26.4 (±0.01) 1.41 2256 (±38) 1115 (±7) 1.3 HL Arable Ap 0–20 7.5 45 799 174 9.1 (±0.05) 10.97 3252 (±174) 588 (±21) 11.2 Forest Ah 1/2–15/20 3.7 46 833 143 30.7 (±0.12) 5.87 4048 (±120) 1121 (±5) 4.0 HC Arable Ap 0–8/12 7 45 619 380 25.4 (±0.34) 17.52 5086 (±73) 2139 (±8) 25.1 Forest Ah 0.5/1–7/10 4.3 24 624 399 29.7 (±0.05) 21.40 4052 (±22) 2906 (±40) 8.9 VC Arable Ap 0–5/8 7.1 108 384 561 21.5 (±0.57) 34.41 2848 (±105) 1382 (±9) 20.8 Forest Ah 1/3–25/30 4.5 80 599 352 13.4 (±0.17) 23.68 4006 (±120) 1343 (±24) 4.2
Values in parenthesis are single standard errors (n=2). aSD (n=2) is less than or equal to±0.14.
bSD (n=2) is less than or equal to±11. cSD (n=2) is less than or equal to±11. dSD (n=2) is less than or equal to±3. eSD (n=2) is less than or equal to±0.08.
fMeans here, for example, upper boundary of the horizons between 1 and 2 cm depth and lower boundary of the horizons between 5 and 10 cm depth.
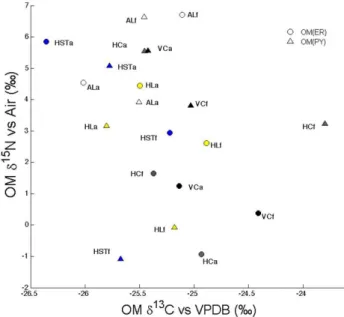
inδ15N (Fig. 2). Despite the trends in the data only theδ13C between land use was significantly different (p(F ) <0.03) when the OM(ER) and OM(PY) fractions were grouped; however, the differences between OM fractions were not significant when compiled by land use type (Supplement Fig. S1.1) or soil type (Supplement Fig. S1.2).
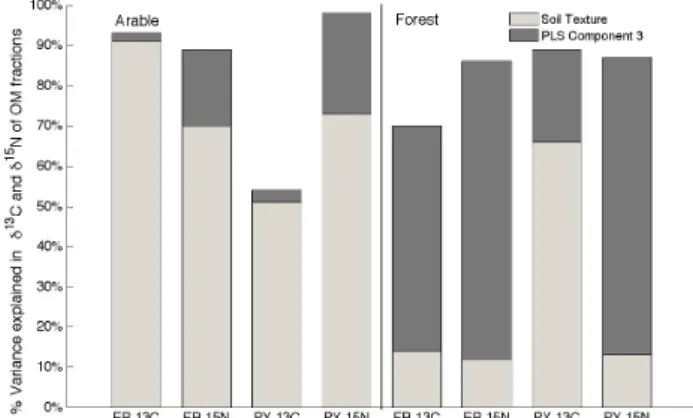
Given that the difference inδ13C of OM between arable and forest soils was significant, we grouped the data set by land use type for the Partial Least Square (PLS) analysis. The first three components of the PLS analysis explained 36–82 % of the variance in the δ13C data and 78–80 % of the variance inδ15N data for arable soils (Fig. 3). Contents of sand, silt and clay (i.e. texture) were strongly related to the first two components of the PLS analysis (Supplement S2), thus, the texture explained much of the variation in the isotopic data of OM(PY) and OM(ER) for the arable soils; however, this was not the case for the forest soils except for theδ13C of the OM(PY) fraction. Exchangable Caexheavily
influenced the third component for all OM fractions of arable soils and explained between 3 % and 25 % of the variation of δ13C andδ15N. While the third component for the forest sites explained much more (36–82 %) of the variation in theδ13C andδ15N data (Fig. 3).
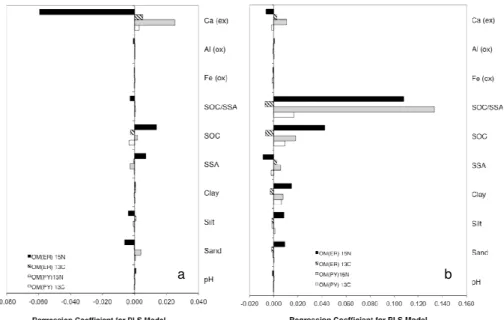
The impact of the measured variables on component three was analyzed through the weights calculated during PLS (Fig. 4a, b). The third component of the OM(ER) fraction for each of the two isotopes was impacted by the measured soil variables in a similar way: the weights of the variable on the component were either both positive or both negative for δ15N andδ13C. The opposite occurred in the OM(PY) frac-tion where the weights of the soil variables on the third
com-Fig. 2. Isotopic composition (δ15N, δ13C) of the OM(PY) and OM(ER) fractions sequentially separated from the arable and forest soils. Each soil type is represented by a single color and an abbre-viation (see Table 1 for abbreabbre-viations) that appear next to each data point along with a land use type abbreviations (a = arable, f = forest).
Fig. 3. Variance in the isotopic data (y-axis) in OM fractions (x-axis) explained by the first three components of the PLS anal-ysis. The first two components were highly correlated with soil texture (distribution of sand, silt, clay) and were combined. PLS component 3 is orthogonal to the first two components, therefore, the variation explained and the subsequent models are related to soil mineral proxies.
The regression coefficient of the PLS analysis reports the direction of the correlation to the isotopic data of the differ-ent OM fractions. For arable soils, the δ15NER signatures
became more depleted with Caex(Fig. 5a). This is in
con-trast to theδ15NPYwhich became more enriched with an
in-crease in Caex. The regression coefficient associated with
soil texture, primarily contents of silt and sand, was less than 0.01 but given the high variation in texture among soils, the impact on the ensuing isotopic composition could be large. Forδ15NER, an increase in silt and sand contents resulted in
depleted values whereas forδ13CER, an increase in the silt
content led to depleted values while an increase in the sand content led to enriched values.
For forest soils, δ15NER and δ15NPY signatures became
more enriched with an increase in the ratio of SOC and spe-cific surface area (SOC/SSA), (Fig. 5b). And, while the SOC/SSA ratio explained most of the variation of the third component, soil texture also played a role. Based on the re-gression coefficients, the degree of clay, silt or sand contents resulted in enrichedδ15NERandδ13CPYsignals whereas
de-creased silt or sand contents resulted in depletedδ15NPYand
δ13CERsignals.
4 Discussion
In this research, we set out to explore whether or not the iso-topic signal of OM fractions sequentially separated from a range of soil types under arable and forest land use would yield additional information about OM isotopic enrichment and insights into the type of interaction between OM and soil minerals. The investigated OM(PY) and OM(ER) fractions are both hypothesized to contain stabilized OM, but given
their differences in extractability we expected differences in interaction with the various compounds present in the soil.
The impact of soil texture (i.e. clay, silt, and sand con-tent) was overwhelming in explaining the isotopic variation in OM(PY) and OM(ER) of arable soils in our study. In con-trast, texture explained little of the isotopic variation in OM fractions of the forest soils except for δ13CPY. The
Rela-tionship between soil texture and stabilized OM is well es-tablished (Chenu and Plante, 2006; Six et al., 2002) and the driving question behind this research is to reach beyond this empirical relationship and determine whether or not we can identify how OM is bound to soil mineral particles. This explains why we used PLS analysis. The variation in our data that can be attributed to soil particle size distribution is accounted for by the first two PLS components. Thus, the third component is orthogonal to the first two components and allows us to investigate further the relationship between isotopic patterns and proxies for soil mineral characteristics. We analyzed five arable and five forest topsoil samples, but the different soil types could obscure significant land use pat-terns. By using PLS, we were able to factor out the influence of soil type and focus on the analysis of OM that is most susceptible to land use impacts.
4.1 Isotopic patterns in arable soils
We found that variation inδ15NERandδ15NPYof the arable
soils was related to Caex content. Interestingly, the Caex
level correlated differently to each fraction in the regression model: a negative correlation withδ15NERand a positive
cor-relation withδ15NPY, an indication of different nitrogen
pro-cessing or sources. From a soil biological perspective, the re-lationship between Ca and N is largely thought of in terms of the specific activity of microbial cells: the more Ca2+cations the more microbial activity due to higher pH values (Groff-man et al., 2006). Thus, the pattern ofδ15NPYenrichment
with an increase of Caex is consistent with the hypothesis
of enhanced microbial transformation (B¨ostrom et al., 2007; Sollins et al., 2009). Moreover, Ca2+plays an important role
in cation mediated interactions between organic molecules and mineral surfaces (Clough and Skjemstad, 2000; Wuddi-vira and Camps-Roach, 2007) and other organic molecules through a process decribed as “crosslinking” (sensu Subra-maniam et al., 2004). According to Oades (1988), the ef-fect of adding Ca2+to soil is a transient acceleration of OM
b a
Fig. 4.PLS weights of soil parameter of each soil parameter of arable soil(a)and forest soil(b)on the isotopic signature of different OM fractions represented in component 3.
b a
Fig. 5. PLS regression coefficients of each soil parameter of arable soil(a)and forest soil(b)on the isotopic signature of different OM fractions represented in component 3.
The pattern of a depletedδ15NERsignal with higher soil
Caexcontent has not been previously observed and the
pro-cesses that lead to this pattern are unclear. We hypothesize that the isotopic composition of OM(ER) is influenced by δ15N depleted OM of previous forest ecosystems still present in soils due to occlusion in soil micro-structures. We base this hypothesis on the methodology of OM separation we used. We sequentially separated at first organic particles (>63 µm) and water-extractable OM in combination with a
stepwise dispersion of macro- and micro-aggregates (using ultrasonic energy: 60 and 440 J ml−1)followed by an
extrac-tion of OM(PY) from soil samples. The extracextrac-tion residue after this treatments can contain highly stable clay and silt sized micro-structures, dispersible only by ultrasonic energy amounts>440 J ml−1)(Chenu and Plante, 2006, Zhu et al.,
2009; Moni et al., 2010), preserving OM occluded in such structures from separation. The δ15NER patterns show
OM(ER) fraction, indicating that nitrogenous compounds in this fraction are highly protected from microbial processing or the energy cost of microbes to release the N compounds is too high.
The arable soils are from actively managed sites and past land management effects are difficult to assess; however, tillage practices are generally thought to destabilize OM oc-cluded in aggregates thus freeing OM for microbial decom-position. In this study, we separated the more labile, physi-cally uncomplexed organic particles occluded in macro- and micro-aggregate as well as water extractable OM (Kaiser et al., 2011) prior to separating the OM(PY) fraction. Thus, the effect due to plowing should be negligible. Manage-ment practices extended to fertilization application at our sites. There were different fertilizers applications over the past 100 yr (Table 2) that could lead to a misinterpretation of the data. However, the differences between the agricultural fertilization regime and crop rotation had a small impact on the variability of the bulk isotopic signatures in the arable soils as a whole. Thus, the isotopic signatures of the sep-arated organic matter fractions are a result of different pro-cessing and binding mechanisms of organic matter.
Effects due to different land use practices are often un-avoidable with investigations that attempt to understand pro-cesses that occur over multiple time scales, such as OM sta-bilization in soil. We sought to limit these effects by cen-tering our hypothesis around the organo-mineral interactions that occur on two very specific OM fractions. This approach reduces the uncertainty associated with the analysis of mul-tiple isotopic sources represented in bulk OM. Furthermore, our results are similar to previous studies that found a consis-tency in isotopic signals within OM fractions that identified microbial processing as a precursor to deposition (Bol et al., 2005; Lobe et al., 2005). Nitrogenous compounds are in-creasingly seen as important for OM stabilization and only with further study can we realize the impact of varying ni-trogen fertilization practices on the subsequent15N isotopic signature of stabilized OM.
4.2 Isotopic patterns in forest soils
In forest soils, the third component for all OM fractions, which explained up to 55 % and 80 % of the variation inδ13C andδ15N respectively, was largely driven by SOC content and SOC/SSA ratio. Reports in the literature suggest that an increase in the SOC/SSA ratio indicates an increase in the number of OM layers covering mineral surfaces (Keil et al., 1994; Koegel-Knaber et al., 2008). The SOC/SSA ratios in soils of this study ranged from 0.61 to 59.62 g m−2, with all soils exceeding 1 mg OC m−2SSA, the theoretical lower threshold for multi-layering of OM on mineral surfaces. The isotopic signatures ofδ13CER andδ13CPY were influenced
by SOC and SOC/SSA ratios in contrasting directions. The δ13CPYsignature tended to become enriched with an increase
in SOC levels whileδ13CERincorporated less of the heavy
isotope, reflected by a depleted isotopic signature. The pat-tern of enrichment inδ13CPYwith SOC/SSA levels is an
indi-cation of microbial processing of OM. This pattern is shared with bothδ15NPYandδ15NERthus, reinforcing the
interpre-tation of microbially processed organic matter sequentially layered on soil mineral surfaces (Kleber et al., 2007; Huy-gens et al., 2008; Sollins et al., 2009). However, this did not occur with OM(ER) whereδ13C values decreased with in-creasing SOC levels. It is likely, that the OM in the ER frac-tion has undergone a different pathway to stabilizafrac-tion that does not involve microbial processing or perhaps the OM is highly protected within soil micro-structures, similar to the OM(ER) of the arable soil. Bachmann et al. (2008) posit that “there are several lines of evidence that organic matter covers minerals in a patchy manner and that even at the nanoscale organic matter and minerals aggregate”. This is confirmed by findings of Chenu and Plante (2006) who found that many of so called “clay particles” were nanometer to micrometer-sized micro-aggregates in which OM was encrusted by min-erals. The authors concluded that these very small micro-aggregates protect OM from decomposition through physical entrapment.
4.3 Molecular model application
We can infer relationships between the isotopic signatures of OM fractions and soil mineral characteristics. Applying the isotopic patterns within the context of the conceptual zonal model proposed by Kleber et al. (2007) an overall picture of OM dynamics and stabilization in soils under arable and forest land use may be achieved. The model of Kleber et al. (2007) describes OM interactions with minerals within three zones: a contact zone, a hydrophobic zone, and a ki-netic zone. Within each zone the force of attraction is dif-ferent: the contact zone represents the strongest attraction while in the kinetic zone organic matter is loosely bound. Within each zone the authors describe potential mechanisms that may lead to the binding of OM. In the arable soils, Caex
played a large role in driving theδ15N patterns of OM(PY). The δ15NPY enrichment with increasing Caex can be a
re-sult of separating OM(PY) from the contact zone where OM can bound to mineral surfaces via cation bridging by Ca2+
ions. In contrast, theδ15NERbecame depleted with
increas-ing Caexwhich suggests that the OM in the ER fraction was
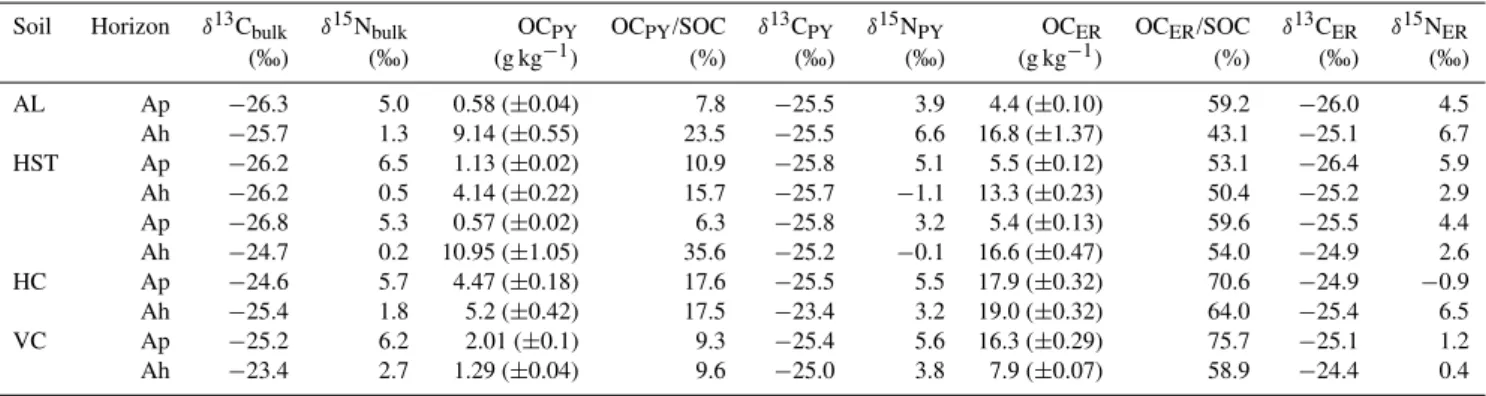
Table 4. Contents of organic carbon as well asδ13C andδ15N signatures of bulk organic matter and organic matter sequentially separated by Na-pyrophosphate solution (OCPY,δ13CPY,δ15NPY)and remaining in the extraction residue (OCER,δ13CER,δ15NER), as well as the
relative proportion of OCPYand OCERcontents in soil organic carbon (SOC) contents for the arable (Ap) and forest (Ah) topsoil samples
from the Albic Luvisol (AL), Haplic Stagnosol (HSt), Haplic Luvisol (HL), Haplic Cambisol (HC), and Vertic Cambisol (VC) sites.
Soil Horizon δ13Cbulk δ15Nbulk OCPY OCPY/SOC δ13CPY δ15NPY OCER OCER/SOC δ13CER δ15NER
(‰) (‰) (g kg−1) (%) (‰) (‰) (g kg−1) (%) (‰) (‰)
AL Ap −26.3 5.0 0.58 (±0.04) 7.8 −25.5 3.9 4.4 (±0.10) 59.2 −26.0 4.5
Ah −25.7 1.3 9.14 (±0.55) 23.5 −25.5 6.6 16.8 (±1.37) 43.1 −25.1 6.7
HST Ap −26.2 6.5 1.13 (±0.02) 10.9 −25.8 5.1 5.5 (±0.12) 53.1 −26.4 5.9
Ah −26.2 0.5 4.14 (±0.22) 15.7 −25.7 −1.1 13.3 (±0.23) 50.4 −25.2 2.9
Ap −26.8 5.3 0.57 (±0.02) 6.3 −25.8 3.2 5.4 (±0.13) 59.6 −25.5 4.4
Ah −24.7 0.2 10.95 (±1.05) 35.6 −25.2 −0.1 16.6 (±0.47) 54.0 −24.9 2.6
HC Ap −24.6 5.7 4.47 (±0.18) 17.6 −25.5 5.5 17.9 (±0.32) 70.6 −24.9 −0.9
Ah −25.4 1.8 5.2 (±0.42) 17.5 −23.4 3.2 19.0 (±0.32) 64.0 −25.4 6.5
VC Ap −25.2 6.2 2.01 (±0.1) 9.3 −25.4 5.6 16.3 (±0.29) 75.7 −25.1 1.2
Ah −23.4 2.7 1.29 (±0.04) 9.6 −25.0 3.8 7.9 (±0.07) 58.9 −24.4 0.4
Values in parenthesis are standard errors (n=3).
The absence of a strong correlation of component 3 and theδ13CPYorδ13CER patterns in the arable soils, indicates
that the small amount of carbon in these fractions is not in-teracting with mineral surfaces or is not occluded in micro-structures (represented by PLS component 1) and is, there-fore, readily available for exchange. The carbon could be derived from organic particles<63 µm not separated during soil fractionation. Alternatively, the carbon could be derived from OM present in the kinetic zone. Evidence for carbon exchanging in the kinetic zone is also found in14C studies where labeled C was identified in organo-mineral complexes, which are long thought to be stable based on long residence times (Swanston et al., 2005; Bruun et al., 2008).
Interestingly, in the forest soil, both the δ13CPY and
δ15NPYvalues become enriched with the increase in the ratio
of SOC/SSA. A SOC/SSA ratio>1 mg m−2implies multiple layers of OM attached to mineral surfaces, and as indicated by isotopic signature of the OM(PY), the OM in these layers is likely highly processed by microorganisms. The pattern in the enriched isotopic signals suggests that OM in these layers exhibit slow exchange kinetics most likely due to the crosslinking of OM via polyvalent cations.
5 Conclusions
The isotopic signatures of OM fractions from arable soils were related to contents of the clay and silt size particles and Caex, while forest soils were related to SOC/SSA
ra-tios. Thus, we infer different binding mechanisms predomi-nate in each land use type. For arable soils, the formation of OM(PY)-Ca-mineral associations was a relevant OM stabi-lization mechanism while the OM(PY) of forest soils was separated from layers of slower exchange not directly at-tached to mineral surfaces. This means there is a potential to build multiple OM layers on mineral particles in the arable
soil and thus the potential for carbon accumulation. Caution must be exercised when comparing the two land use types; for example, the soil depths were different between the sites, which could adversely affect decomposition conditions espe-cially when considering different soil horizons. However, we went through extensive measures to ensure similar soils be-tween the two land use types (i.e. paired plot design) and we did not observe differences in aeration or soil water status, therefore, we expect the conditions in the top 30 cm of soil for a given land use pair to be similar.
The δ13CPY andδ13CER values of the arable soils were
generally found to be depleted (except HC,δ13CER) as
com-pared to the respective forest soils. A greater number of mi-croorganisms or an increased level of microbial metabolic ac-tivity in the forest soils (Kaiser et al., 2010) could explain this pattern. Although, the carbon fixed by trees and deposited in the soil was likely carboxylated at an earlier date than the arable vegetation. This would result in forest OM having a more enriched isotopic signal due to the Suess effect (the de-pletion in atmospheric CO2over time as a function of an
in-crease in fossil fuel combustion). Future studies, with higher replications among soil types and assessing sites where land use change occurred at different time points will be necessary to elucidate these patterns.
Supplementary material related to this article is available online at:
http://www.biogeosciences.net/8/2895/2011/ bg-8-2895-2011-supplement.pdf.
Acknowledgement. We gratefully acknowledge Jeff Bird and three anonymous reviewers for their comments and input which improved our manuscript. We would also like to thank the editor Michael Bahn for his review and handling of the manuscript. We would like to thank Frau Remus of the ZALF Isotope Core Facility for sample preparation. M. Kaiser was financially supported by the Deutsche Forschungsgemeinschaft, Bonn (DFG) under grant KA 2652 (1-1 and 1-2).
Edited by: M. Bahn
References
Abdi, H.: Partial least Squares (PLS) Regression, in: Encyclopedia of Social Science Research MethodsLewis-Beck M., edited by: Bryman, A., Futing, T., Thousand Oaks, USA, 2003.
Bachmann, J., Guggenberger, G., Baumgartl, T., Ellerbrock, R. H., Urbanek, E., Goebel, M.-O., Kaiser, K., Horn, R., and Fischer, W. R.: Physical carbon-sequestration mechanisms under special consideration of soil wettability, J. Plant Nutr. Soil Sc., 171, 14– 26, doi:10.1002/jpln.200700054, 2008.
Baldock, J. A. and Nelson,P. N.: Soil organic matter, in: Handbook of Soil Sciences, edited by: Summer, M. E., CRC Press, Boca Raton, FL, USA, 1325–1382, 2000.
Balesdent, J. and Mariotti, A.: Measurement of soil organic matter turnover using 13-C natural abundance, in: Mass spectrometry of soils, edited by: Boutton, T. W. and Yamasaki, S., and Dekker, M., New York, 83–112, 1996
Bol, R., Eriksen, J., Smith, P., Garnett, M. H., Coleman, K., and Christensen, B. T.: The natural abundance of 13-C, 15-N, 34-S and 14-C in archived (1923–2000) plant and soil samples from the Askov long-term experiments on animal manure and mineral fertilizer, Rapid Commun. Mass Sp., 19, 3216–3226, doi:10.1002/rcm.2156, 2005.
Bol R., Poirier, N., Balesdent, J., and Gleixner, G.: Molecular turnover time of soil organic matter in particle-size fractions of an arable soil, Rapic Commun. Mass Sp., 23, 2551–2558, 2009. Bostr¨om, B., Comstedt, D., and Ekblad, A.: Isotope fractionation and 13C enrichment in soil profiles during the decomposition of soil organic matter, Oecologia, 153, 89–98, doi:10.1007/s00442-007-0700-8, 2007.
Bruun, S., Thomsen, I. K., Christensen, B. T., and Jensen, L. S.: In search of stable soil organic carbon fractions: a com-parison of methods applied to soils labelled with 14C for 40 days or 40 yr, Eur. J. Soil Sci., 59, 247–256, doi:10.1111/j.1365-2389.2007.00985.x, 2008.
Chenu, C., and Plante, A. F.: Clay-sized organo-mineral complexes in a cultivation chronosequence: revisiting the concept of the “primary organo-mineral complex”, Eur. J. Soil Sci., 57, 596– 607, doi:10.1111/j.1365-2389.2006.00834.x, 2006.
Clough, A. and Skjemstad, J. O.: Physical and chemical protection of soil organic carbon in three agricultural soils with different
contents of calcium carbonate, 5, CSIRO Publishing, Colling-wood, Australia, 2000.
Ekblad, A., Bostrom, B., Holm, A., and Comstedt, D.: Forest soil respiration rate and delta C-13 is regulated by recent above ground weather conditions, Oecologia, 143, 136–142, 2005. Ellerbrock, R. H. and Kaiser, M.: Stability and composition of
dif-ferent soluble soil organic matter fractions – evidence fromδ13C and FTIR signatures, Geoderma, 128, 28–37, 2005.
Geladi, P. and Kowalski, B. R.: Partial least-squares regression: a tutorial, Anal. Chim. Acta, 185, 1–17, 1986.
Groffman, P., Fisk, M., Driscoll, C., Likens, G., Fahey, T., Eagar, C., and Pardo, L.: Calcium Additions and Microbial Nitrogen Cycle Processes in a Northern Hardwood Forest, Ecosystems, 9, 1289–1305, doi:10.1007/s10021-006-0177-z, 2006.
Haile-Mariam, S., Collins, H. P., Wright, S., and Paul, E. A.: Frac-tionation and Long-Term Laboratory Incubation to Measure Soil Organic Matter Dynamics, Soil Sci. Soc. Am. J., 72, 370–378, doi:10.2136/sssaj2007.0126, 2008.
Herrmann, A. M., Ritz, K., Nunan, N., Clode, P. L., Pett-Ridge, J., Kilburn, M. R., Murphy, D. V., O’Donnel, A. G., and Stockdale, E. A.: Nano-scale secondary ion mass spectrometry – A new an-alytical tool in bioeochemistry and soil ecology: A review article, Soil Biol. Biogeo., 39, 1835–1850, 2007.
Huygens, D., Denef, K., Vandeweyer, R., Godoy, R., Van Cleemput, O., and Boeckx, P.: Do nitrogen isotope patterns reflect microbial colonization of soil organic matter fractions?, Biol. Fert. Soils, 44, 955–964, doi:10.1007/s00374-008-0280-8, 2008.
Kaiser, K. and Guggenberger, G.: Mineral surfaces and soil or-ganic matter, Eur. J. Soil Sci., 54, 219–236, doi:10.1046/j.1365-2389.2003.00544.x, 2003.
Kaiser, M., Ellerbrock, R. H., and Sommer, M.: Separation of Coarse Organic Particles from Bulk Surface Soil Samples by Electrostatic Attraction, Soil Sci. Soc. Am. J., 73, 2118–2130, doi:10.2136/sssaj2009.0046, 2009.
Kaiser, M., Wirth, S., Ellerbrock, R. H., and Sommer, M.: Micro-bial respiration activities related to sequentially separated, partic-ulate and water-soluble organic matter fractions from arable and forest topsoils, Soil Biol. Biochem., 42, 418–428, 2010. Kaiser, M., Walter, K., Ellerbrock, R. H., and Sommer, M.: Effects
of land use and mineral characteristics on the organic carbon content, and the amount and composition of Na-pyrophosphate-soluble organic matter, in subsurface soils, Eur. J. Soil Sci., 226– 236, doi:10.1111/j.1365-2389.2010.01340.x, 2011.
Keil, R. G., Tsamakis, E., Fuh, C. B., Giddings, J. C., Hedges, J. I.: Mineralogical and textural controls on the organic composi-tion of coastal marine sediments: hydrodynamic separacomposi-tion us-ing SPLITT-fractionation, Geochim. Cosmochim. Acta, 58, 879-893, 1994.
Kleber, M. and Johnson, M. G.: Advances in Understanding the Molecular Structure of Soil Organic Matter: Implications for In-teractions in the Environment, in: Advances in Agronomy, edited by: Donald, L. S., Academic Press, 77–142, 2010.
Kleber, M., Mikutta, R., Torn, M. S., and Jahn, R.: Poorly crys-talline mineral phases protect organic matter in acid subsoil hori-zons, European J. Soil Sci., 56, 717–725, doi:10.1111/j.1365-2389.2005.00706.x, 2005.
Biogeochemistry, 85, 9–24, doi:10.1007/s10533-007-9103-5, 2007.
Kleber, M., Nico, P. S., Plante, A., Filley, T., Kramer, M., Swanston, C., and Sollins, P.: Old and stable soil organic matter is not nec-essarily chemically recalcitrant: implications for modeling con-cepts and temperature sensitivity, Glob. Change Biol., 17, 1097– 1107, 2010.
Knicker, H.: Stabilization of N-compounds I soil and organic-matter-rich sediments – what is the difference?, Mar. Chem., 92, 167–195, 2004.
K¨ogel-Knabner, I., Guggenberger, G., Kleber, M., Kandeler, E., Kalbitz, K., Scheu, S., Eusterhues, K., and Leinweber, P.: Organo-mineral associations in temperate soils: Integrating bi-ology, mineralogy, and organic matter chemistry, J. Plant Nutr. Soil Sc., 171, 61–82, doi:10.1002/jpln.200700048, 2008. Lal, R.: Soil carbon sequestration to mitigate climate change,
Geo-derma, 123, 1–22, 2004.
Liao, J. D., Boutton, T. W., and Jastrow, J. D.: Organic matter turnover in soil physical fractions following woody plant inva-sion of grassland: Evidence from natural 13-C and 15-N, Soil Biol. Biochem., 38, 3197–3210, 2006.
Lobe, I., Bol, R., Ludwig, B., Du Preez, C. C., and Amelung, W.: Savanna-derived organic matter remaining in arable soils of the South African Highveld long-term mixed cropping: Evidence from 13C and 15N natural abundance, Soil Biol. Biochem., 37, 1898–1909, 2005.
Marin-Spiotta, E., Silver, W. L., Swanston, C. W., and Ostertag, R.: Soil organic matter dynamics during 80 yr of reforesta-tion of tropical pastures, Glob. Change Biol., 15, 1584–1597, doi:10.1111/j.1365-2486.2008.01805.x, 2009.
Masiello, C. A., Chadwick, O. A., Southon, J., Torn, M. S., and Harden, J. W.: Weathering controls on mechanisms of carbon storage in grassland soils, Glob. Biogeochem. Cy., 18, GB4023, doi:10.1029/2004gb002219, 2004.
Mikutta, R., Kleber, M., Kaiser, K., and Jahn, R.: Organic matter re-moval from soils using hydrogen peroxide, sodium hypochlorite, and disodium peroxodisulfate, Soil Sci. Soc. Am. J., 69, 120– 135, doi:10.2136/sssaj2005.0120, 2005.
Mikutta, R., Kleber, M., Torn, M., and Jahn, R.: Stabilization of Soil Organic Matter: Association with Minerals or Chemical Re-calcitrance?, Biogeochemistry, 77, 25–56, doi:10.1007/s10533-005-0712-6, 2006.
Moni, C., Rumpel, C., Virto, I., Chabbi, A., and Chenu, C.: Rela-tive importance of sorption versus aggregation for organic mat-ter storage in subsoil horizons of two contrasting soils, Eur. J. Soil Sci., 61, 958–969, doi:10.1111/j.1365-2389.2010.01307.x, 2010.
Oades, J.: The retention of organic matter in soils, Biogeochemistry, 5, 35–70, doi:10.1007/bf02180317, 1988.
Olk, D. C.: A Chemical Fractionation for Structure–Function Rela-tions of Soil Organic Matter in Nutrient Cycling, Soil Sci. Soc. Am. J., 70, 1013–1022, doi:10.2136/sssaj2005.0108, 2006. Siregar, A., Kleber, M., Mikutta, R., and Jahn, R.: Sodium
hypochlorite oxidation reduces soil organic matter concen-trations without affecting inorganic soil constituents, Eur. J. Soil Sci., 56, 481–490, doi:10.1111/j.1365-2389.2004.00680.x, 2005.
Six, J., Conant, R. T., Paul, E. A., and Paustian, K.: Sta-bilization mechanisms of soil organic matter: Implications
for C-saturation of soils, Plant and Soil, 241, 155–176, doi:10.1023/a:1016125726789, 2002.
Smith, P., Powlson, D., Glendining, M., and Smith, J. O.: Po-tential for carbon sequestration in European soils: preliminary estimates for five scenarios using results from long-term ex-periments, Glob. Change Biol., 3, 67–79, doi:10.1046/j.1365-2486.1997.00055.x, 1997.
Sollins, P., Kramer, M., Swanston, C., Lajtha, K., Filley, T., Auf-denkampe, A., Wagai, R., and Bowden, R.: Sequential density fractionation across soils of contrasting mineralogy: evidence for both microbial- and mineral-controlled soil organic matter sta-bilization, Biogeochemistry, 96, 209–231, doi:10.1007/s10533-009-9359-z, 2009.
Solomon, D., Fritzsche, F., Lehmann, J., Tekalign, M., and Zech, W.: Soil organic matter dynamics in the subhumid agroecosys-tems of the Ethiopian highlands: evidence from natural 13C abundance and particle-size fracrionation, Soil Sci. Soc. Am. J., 66, 969–978, doi:10.2136/sssaj2002.0969, 2002.
Subramaniam, K., Stepp, C., Pignatello, J. J., Smets, B., and Grasso, D.: Enhancement of polynuclear aromatic hydrocarbon desorption by complexing agents in weathered soil., Environ. Eng. Sci., 21, 515–523, 2001.
Swanston, C. W., Torn, M. S., Hanson, P. J., Southon, J. R., Garten, C. T., Hanlon, E. M., and Ganio, L.: Initial characterization of processes of soil carbon stabilization using forest stand-level ra-diocarbon enrichment, Geoderma, 128, 52–62, 2005.
Trumbore, S.: Radiocarbon and Soil Carbon Dy-namics, Annu. Rev. Earth Planet. Sci., 37, 47–66, doi:10.1146/annurev.earth.36.031207.124300, 2009.
von L¨utzow, M., K¨ogel-Knabner, I., Ekschmitt, K., Flessa, H., Guggenberger, G., Matzner, E., and Marschner, B.: SOM frac-tionation methods: Relevance to functional pools and to stabi-lization mechanisms, Soil Biol. and Biochem., 39, 2183–2207, 2007.
Wattel- Koekkoek, E. J. W., Buurman, P., Van Der Plicht, J., Wattel, E., and Van Breemen, N.: Mean residence time of soil organic matter associated with kaolinite and smectite, Eur. J. Soil Sci., 54, 269–278, doi:10.1046/j.1365-2389.2003.00512.x, 2003. Wick, A. F., Ingram, L. J., and Stahl, P. D.: Aggregate and organic
matter dynamics in reclaimed soils as indicated by stable carbon isotopes, Soil Biol. Biochem., 41, 201–209, 2009.
Wuddivira, M. N. and Camps-Roach, G.: Effects of organic matter and calcium on soil structural stability, Eur. J. Soil Sci., 58, 722– 727, doi:10.1111/j.1365-2389.2006.00861.x, 2007.
Yang, Y., Ratt´e, D., Smets, B. F., Pignatello, J. J., and Grasso, D.: Mobilization of soil organic matter by complexing agents and implications for polycyclic aromatic hydrocarbon desorp-tion, Chemosphere, 43, 1013–1021, 2001.
Zech, W., Senesi, N., Guggenberger, G., Kaiser, K., Lehmann, J., Miano, T. M., Miltner, A., Schroth, G.: Factors controlling humi-fication and mineralization of soil organic matter in the tropics, Geoderma, 79, 117-161, 1997.