Allelic Spectra of Risk SNPs Are Different for
Environment/Lifestyle Dependent versus
Independent Diseases
Ivan P. Gorlov*☯, Olga Y. Gorlova☯, Christopher I. Amos
The Geisel School of Medicine, Dartmouth College, Dartmouth-Hitchcock Medical Center, Lebanon, New Hampshire, United States of America
☯These authors contributed equally to this work. *ivan.p.gorlov@dartmouth.edu
Abstract
Genome-wide association studies (GWAS) have generated sufficient data to assess the role of selection in shaping allelic diversity of disease-associated SNPs. Negative selection against disease risk variants is expected to reduce their frequencies making them overrep-resented in the group of minor (<50%) alleles. Indeed, we found that the overall proportion of risk alleles was higher among alleles with frequency<50% (minor alleles) compared to that in the group of major alleles. We hypothesized that negative selection may have differ-ent effects on environmdiffer-ent (or lifestyle)-dependdiffer-ent versus environmdiffer-ent (or lifestyle)-inde-pendent diseases. We used an environment/lifestyle index (ELI) to assess influence of environmental/lifestyle factors on disease etiology. ELI was defined as the number of publi-cations mentioning“environment”or“lifestyle”AND disease per 1,000 disease-mentioning publications. We found that the frequency distributions of the risk alleles for the diseases with strong environmental/lifestyle components follow the distribution expected under a selectively neutral model, while frequency distributions of the risk alleles for the diseases with weak environmental/lifestyle influences is shifted to the lower values indicating effects of negative selection. We hypothesized that previously selectively neutral variants become risk alleles when environment changes. The hypothesis of ancestrally neutral, currently dis-advantageous risk-associated alleles predicts that the distribution of risk alleles for the envi-ronment/lifestyle dependent diseases will follow a neutral model since natural selection has not had enough time to influence allele frequencies. The results of our analysis suggest that prediction of SNP functionality based on the level of evolutionary conservation may not be useful for SNPs associated with environment/lifestyle dependent diseases.
Author Summary
We reviewed several thousand genome wide association studies that were conducted to identify genetic variants influencing risk of human diseases. We tested the hypothesis that single nucleotide polymorphisms (SNPs) that influence disease risk undergo positive or
OPEN ACCESS
Citation:Gorlov IP, Gorlova OY, Amos CI (2015) Allelic Spectra of Risk SNPs Are Different for Environment/Lifestyle Dependent versus Independent Diseases. PLoS Genet 11(7): e1005371. doi:10.1371/ journal.pgen.1005371
Editor:Greg Gibson, Georgia Institute of Technology, UNITED STATES
Received:March 24, 2015
Accepted:June 18, 2015
Published:July 22, 2015
Copyright:© 2015 Gorlov et al. This is an open access article distributed under the terms of the Creative Commons Attribution License, which permits unrestricted use, distribution, and reproduction in any medium, provided the original author and source are credited.
Data Availability Statement:This study used publicly available data from the Catalog of Published Genome-Wide Association Studieshttps://www. genome.gov/26525384
Funding:This work was supported by: National Institutes of Health U19 CA148127 and National Institutes of Health 5 P30 CA016672. The funders had no role in study design, data collection and analysis, decision to publish, or preparation of the manuscript.
negative selection more frequently than an average SNP in the human genome. We found no evidence for excess of positive selection on disease-associated SNPs. At the same time we found that alleles associated with a higher disease risk undergo negative selection. We also demonstrated that risk alleles for diseases with strong influence of environment/life-style factors (e.g. Type II diabetes) show little evidence of negative selection, while risk alleles for diseases with weak influence of environment/lifestyle factors (e.g. Pathological myopia) show clear signs of negative selection. The approach used in this study can be used to estimate the number of genetic variants in the human genome influencing risk of human diseases.
Introduction
Diseases play a central role in human evolution, influencing population frequencies of genetic polymorphisms directly or indirectly through hitchhiking or bottle neck effect [1–3]. Nonethe-less, the role of selection in the shaping of population frequencies of the genetic variants associ-ated with risk of common human diseases is poorly understood.
Environment/lifestyle diseases
Both environmental and genetic factors influence risk of common human diseases, however, the relative significance of genetic and environmental factors in disease etiology differs for dif-ferent diseases. A number of common human diseases including cardiovascular diseases and type 2 diabetes are believed to predominantly result from changes in lifestyle and environment [4,5] Having environment or lifestyle as a major risk factor does not rule out an influence of genetic polymorphisms. An assessment of the effects of selection on the risk alleles of the com-mon diseases stratified by the importance of the environmental/lifestyle component has never been conducted before.
Selection and disease associated SNPs
A number of methods to detect signatures of recent positive selection have been proposed, including Tajima’s D [6,7], selective sweep [8], tests based on fixation index used as a measure of population differentiation [9], haplotype analysis [10], tests based on the ratio of nonsynon-ymous and synonnonsynon-ymous substitutions [11], and others [12–15]. The aforementioned methods work well when adaptation is driven by a single polymorphic locus (monogenic model); how-ever, in the situation when adaptation is driven by multiple loci (polygenic model) selection may not produce the classical signature of selective sweep [16], see also [17] and [18]. Fixation of a beneficial mutation is also strongly affected by temporal variation in population size and selection pressure [19].
Some studies suggest that SNPs with the signature of recent positive selection tag regions associated with common human diseases [20]. Raj et al. 2013 [21] found that several loci linked to the risk of inflammatory diseases carry genomic signatures of recent positive selection. It also has been demonstrated that SNPs associated with the risk of type II diabetes carry signa-ture of recent positive selection [22]. Then again, other studies found no evidence of positive selection at loci linked to common human diseases [23,24].
and Pike [25] suggested that allelic spectra of SNPs associated with common diseases should be similar to the allelic spectra for the entire human genome (which basically follow neutral model). They built their hypothesis based on the fact that the number of disease loci for com-mon disease is usually high and each locus makes only a minor contribution to a disease. They argue that natural selection has been operating weakly and for a short time, suggesting that the majority of SNPs associated with common disease may be near-neutral.
We and others hypothesized that disease-associated SNPs experience negative selection [26–30]. Detection of negative selection is more challenging than detection of recent positive selection because it does not reshape genetic variation in selected region. The main indicator of negative selection is deviation of allelic frequencies from the distribution expected under the neutrality model towards lower values [28,31]. Lower minor allele frequency expected as a result of negative selection cannot be estimated for individual SNPs but only for SNP classes, e.g. nonsynonymous or disease risk-associated SNPs. Even though it has been shown that dis-ease associated SNPs tend to occur in evolutionary conserved regions [32] the effect of negative selection on disease risk associated SNPs is poorly understood.
Genome-wide association studies (GWAS)
Genome-wide association studies are widely used to identify SNPs associated with risk of com-mon diseases. Thousands GWASs have been conducted with the results reported in several databases. One of the most comprehensive databases is the catalogue of published GWASs (CPGWAS) [33] (http://www.genome.gov/gwastudies/). More than 7,000 SNPs linked to nearly 5,000 genes have been reported in CPGWAS making it a valuable resource to study the role of natural selection in the shaping of genetic variation of common human disease.
The goal of our study was to evaluate the effect of positive and negative selection on allelic spectra of SNPs associated with the risk of common human diseases and to assess how allelic spectra differ for environment/lifestyle dependent versus environment/lifestyle independent diseases.
Results and Discussion
The number of SNPs with a signature of recent positive selection on
commonly used genotyping platforms
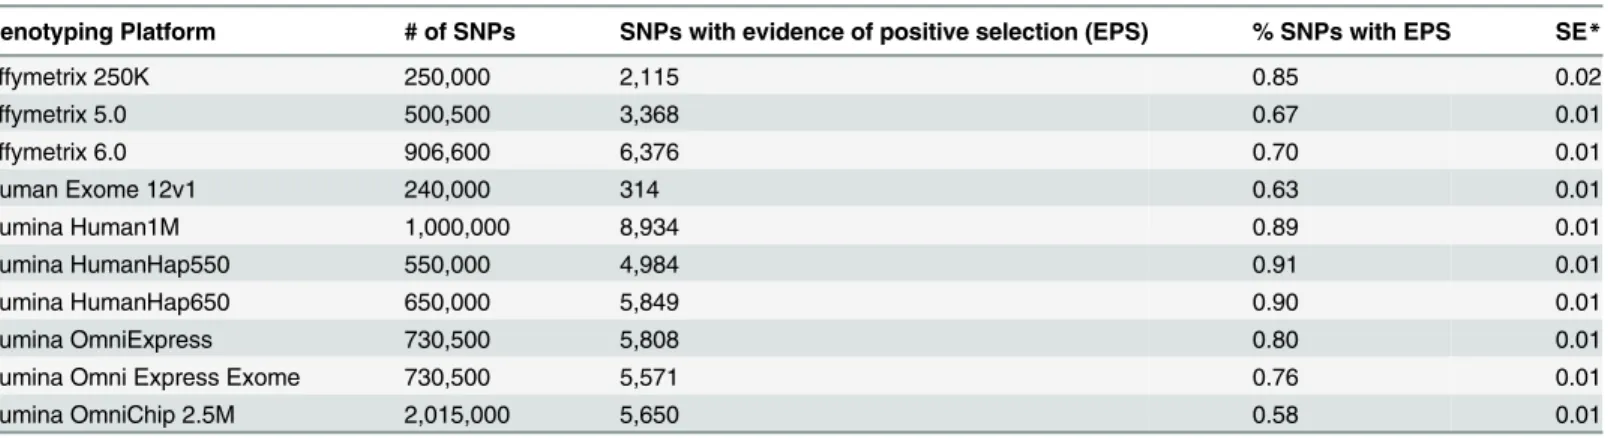
Fig 1shows the proportions of the SNPs with the signature of recent positive selection across commonly used genotyping platforms. The lowest proportion was on Illumina OmniChip 2.5M platform—0.58%, and the highest proportion was on Illumina Human Hap550 platform —0.91%. The average proportion of SNPs with the signature of recent positive selection across all genotyping platforms was essentially the same as the proportion of SNPs with the signature of recent positive selection among GWAS-detected disease associated SNPs reported in CPGWAS—0.75%±0.09% versus 0.76%±0.17% (x2= 0.09, df = 1, P = 0.95). A comparison of the proportion of SNPs with the signature of recent positive selection among CPGWAS-reported disease-associated SNPs with proportions of the SNPs on individual platforms dem-onstrated that it was significantly higher for Illumina 1M platform (P = 0.03) and lower for OmniChip 2.5M (P = 0.02). The differences, however, became statistically non-significant after multiple testing adjustments.Table 1shows details of the estimation of the proportions of SNPs with the signature of recent positive selection on the 10 most commonly used genotyping platforms.
platforms. This result suggests that recent positive selection does not increase (or decrease) the chance that a SNP will be reported as disease-risk associated. This also suggests that reported evidence of positive selection on disease risk associated SNPs [21,34,35] may largely result from simple random overlap between disease associated and positively selected SNPs.
Minor risk alleles (MiRA)
Minor Risk Alleles (MiRA) were defined as risk-associated alleles with frequency less than 50%. We used MiRA proportion as an estimator of the effect of negative selection on allelic
Fig 1. Proportions of SNPs with the signature of recent positive selection on the most commonly
used genotyping platforms.The red horizontal line shows the proportion of SNPs with signature of recent
positive selection among GWAS-detected SNPs associated with risk of common human diseases.
doi:10.1371/journal.pgen.1005371.g001
Table 1. Absolute number and the proportion of selected SNPs on the most popular genotyping platforms.
Genotyping Platform # of SNPs SNPs with evidence of positive selection (EPS) % SNPs with EPS SE*
Affymetrix 250K 250,000 2,115 0.85 0.02
Affymetrix 5.0 500,500 3,368 0.67 0.01
Affymetrix 6.0 906,600 6,376 0.70 0.01
Human Exome 12v1 240,000 314 0.63 0.01
Illumina Human1M 1,000,000 8,934 0.89 0.01
Illumina HumanHap550 550,000 4,984 0.91 0.01
Illumina HumanHap650 650,000 5,849 0.90 0.01
Illumina OmniExpress 730,500 5,808 0.80 0.01
Illumina Omni Express Exome 730,500 5,571 0.76 0.01
Illumina OmniChip 2.5M 2,015,000 5,650 0.58 0.01
*SE—Standard Error
frequencies. If the probability to be risk-associated or protective does not depend on allelic fre-quency, the expected MiRA proportion will be 0.5.Table 2shows MiRA proportions for the diseases with at least 20 CPGWAS reported risk associated SNPs. Analyses of Variance (ANOVA) show significant variation of the MiRA proportion among common diseases: F = 2.3, df = 24, P = 0.000001. The MiRA proportions vary from 0.45±0.1 for Graves' disease to 0.96±0.04 for chronic kidney disease.
There is a considerable heterogeneity between diseases by GWAS sample sizes. A larger sample size translates into a higher statistical power to detect SNPs with a low minor allele fre-quency (MAF). However it is unlikely that the sample size will influence the probability that a minor allele will be associated with risk rather than protection. Consistent with this expectation we found that larger studies were more likely to detect rare (MAF0.05) SNPs (Spearman rank order correlation = 0.14, N = 1,657, P = 0.00002). However, no association was found between the sample size and direction of the effect of minor alleles (MiRA) (Spearman rank order corre-lation = -0.04, N = 1,657, P = 0.56).
Environment/lifestyle index (ELI)
Text mining is a powerful tool to infer the relationships between diverse biological entities [36,37]. We used it to assess the role of environment/lifestyle factors in disease etiology. We cannot simply search for publications linking disease to environmental or lifestyle factors because we will find such publications for any human disease. A more objective measure of
Table 2. Proportions of minor risk alleles (MiRA) in GWAS studied diseases.
Disease MiRA # of SNPs SE
Crohn's disease 0.61 151 0.04
Rheumatoid arthritis 0.68 120 0.04
Inflammatory bowel disease 0.50 116 0.05
Breast cancer 0.64 85 0.05
Type 2 diabetes 0.51 79 0.06
Ulcerative colitis 0.56 77 0.06
Prostate cancer 0.63 71 0.06
Coronary heart disease 0.61 56 0.07
Obesity 0.55 55 0.07
Systemic lupus erythematosus 0.71 55 0.06
Schizophrenia 0.47 47 0.07
Age-related macular degeneration 0.52 42 0.08
Myopia (pathological) 0.72 51 0.07
Type 1 diabetes 0.55 38 0.08
Alzheimer's disease (late onset) 0.58 36 0.08
Parkinson's disease 0.55 33 0.09
Colorectal cancer 0.66 32 0.09
Celiac disease 0.59 32 0.09
Asthma 0.58 31 0.09
Psoriasis 0.61 28 0.09
Chronic lymphocytic leukemia 0.54 28 0.10
Chronic kidney disease 0.96 27 0.04
Primary biliary cirrhosis 0.63 27 0.09
Multiple sclerosis 0.60 25 0.10
Graves' disease 0.45 22 0.11
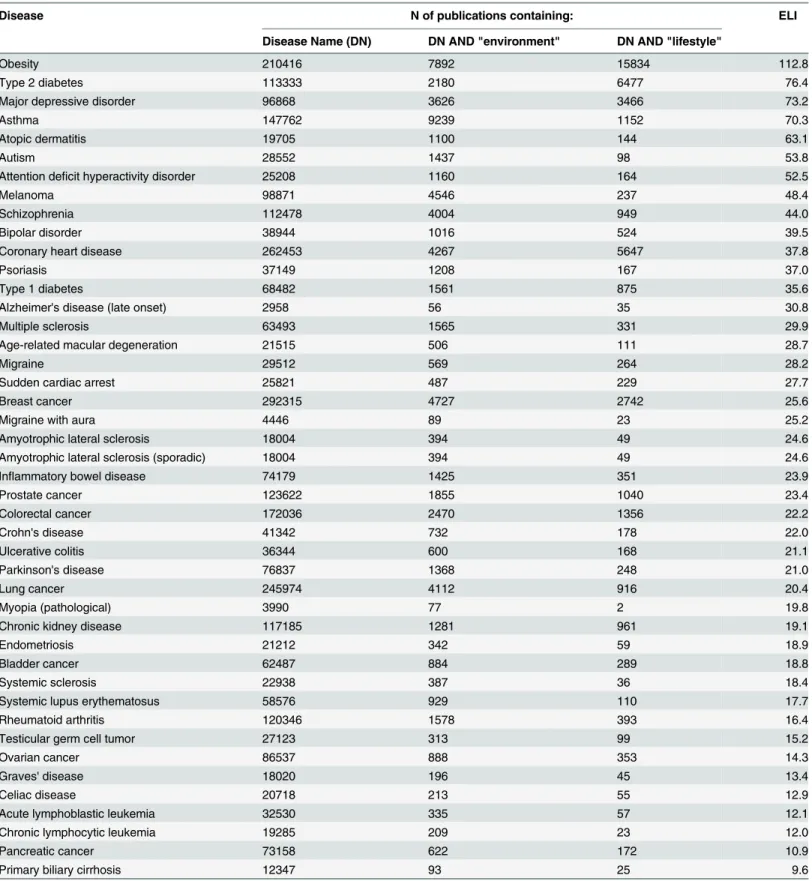
influences of environment/lifestyle factors on disease etiology is needed. It is reasonable to sug-gest that the proportion of papers simultaneously referring to a disease and environment/life-style factors will be higher for diseases with strong environment/lifeenvironment/life-style influences.Table 3
shows estimated environment/lifestyle indices (ELIs) for the diseases that were targeted by at least 3 independent GWASs. The highest ELIs were detected for obesity and type II diabetes, 112.8 and 76.4 correspondingly, and the lowest for pancreatic cancer and primary biliary cir-rhosis, 10.9 and 9.6 correspondingly.
To test stability of ELI-based ranking of human diseases we extended the ELI by including the additional term:“exposure”.S1 Tableshows disease ranking based on ELI and extended ELI. In the ranking based on the extended ELI, lung cancer moved from 29thposition to 9th fol-lowing obesity, asthma, atopic dermatitis, type 2 diabetes, major depressive disorder, mela-noma, autism, and attention deficit hyperactivity disorder. Overall disease ranking was similar for ELI and extended ELI (S1 Fig). Out of the top 10 ELI-defined environment/lifestyle depen-dent diseases all except“bipolar disorder”are also among the top 10 environment/lifestyle dependent diseases defined based on the extended ELI. The correlation coefficient between ELI and extended ELI was 0.92, N = 44, P = 1.6x10⁻¹⁷. Replacing ELI by extended ELI for disease ranking did not change our conclusions. Analysis of the extended ELI demonstrates that (i) the ELI-based approach for identification of environment/lifestyle dependent disease is not perfect and can rank some diseases (such as lung cancer) lower than we may think is accurate, and (ii) overall ELI based classification provides a sufficiently accurate and robust assessment of envi-ronmental and lifestyle related effects on disease risk to capture most known influences on dis-ease risks. Analysis of the human disdis-ease with extended ELI suggests that the proposed classification works effectively on the large collection of diseases used in this analysis.
ELI and risk allele frequencies
We found that risk allele frequencies were higher for environment/lifestyle dependent diseases: Spearman rank order correlation coefficient between risk allele frequencies and ELI was 0.1 (P = 0.0002). We further subdivided diseases in tertiles based on ELI and estimated MiRA pro-portions in each tertile (Fig 2). There was a significant variation among tertiles by the MiRA proportions: ANOVA-test F = 5.02, df = 2, P = 0.007. The proportion was highest in the first and lowest in the third tertile. The analysis indicates that the risk alleles for environment/life-style dependent diseases tend to be more common compared to the risk alleles for environ-ment/lifestyle independent diseases.
We additionally performed nonparametric Spearman rank order correlation analysis. Sig-nificant positive association between risk allele frequency and ELI was detected (Spearman R = 0.12, N = 1547, P = 4 x 10⁻⁶). This result supports the conclusion that risk alleles for
envi-ronment/lifestyle dependent diseases tend to have a higher frequency compared to the risk alleles for environment/lifestyle independent diseases.
Table 3. Environmental and lifestyle indexes (ELIs) for the GWAS-studied diseases.
Disease N of publications containing: ELI
Disease Name (DN) DN AND "environment" DN AND "lifestyle"
Obesity 210416 7892 15834 112.8
Type 2 diabetes 113333 2180 6477 76.4
Major depressive disorder 96868 3626 3466 73.2
Asthma 147762 9239 1152 70.3
Atopic dermatitis 19705 1100 144 63.1
Autism 28552 1437 98 53.8
Attention deficit hyperactivity disorder 25208 1160 164 52.5
Melanoma 98871 4546 237 48.4
Schizophrenia 112478 4004 949 44.0
Bipolar disorder 38944 1016 524 39.5
Coronary heart disease 262453 4267 5647 37.8
Psoriasis 37149 1208 167 37.0
Type 1 diabetes 68482 1561 875 35.6
Alzheimer's disease (late onset) 2958 56 35 30.8
Multiple sclerosis 63493 1565 331 29.9
Age-related macular degeneration 21515 506 111 28.7
Migraine 29512 569 264 28.2
Sudden cardiac arrest 25821 487 229 27.7
Breast cancer 292315 4727 2742 25.6
Migraine with aura 4446 89 23 25.2
Amyotrophic lateral sclerosis 18004 394 49 24.6
Amyotrophic lateral sclerosis (sporadic) 18004 394 49 24.6
Inflammatory bowel disease 74179 1425 351 23.9
Prostate cancer 123622 1855 1040 23.4
Colorectal cancer 172036 2470 1356 22.2
Crohn's disease 41342 732 178 22.0
Ulcerative colitis 36344 600 168 21.1
Parkinson's disease 76837 1368 248 21.0
Lung cancer 245974 4112 916 20.4
Myopia (pathological) 3990 77 2 19.8
Chronic kidney disease 117185 1281 961 19.1
Endometriosis 21212 342 59 18.9
Bladder cancer 62487 884 289 18.8
Systemic sclerosis 22938 387 36 18.4
Systemic lupus erythematosus 58576 929 110 17.7
Rheumatoid arthritis 120346 1578 393 16.4
Testicular germ cell tumor 27123 313 99 15.2
Ovarian cancer 86537 888 353 14.3
Graves' disease 18020 196 45 13.4
Celiac disease 20718 213 55 12.9
Acute lymphoblastic leukemia 32530 335 57 12.1
Chronic lymphocytic leukemia 19285 209 23 12.0
Pancreatic cancer 73158 622 172 10.9
Primary biliary cirrhosis 12347 93 25 9.6
environment/lifestyle dependent diseases were more symmetrical indicating a weak influence of negative selection (Fig 3c). The differences between environment/lifestyle dependent and independent diseases were more evident when we compared the proportions of risk alleles averaged across diseases (Fig 3d). The distribution of the risk alleles for environment/lifestyle independent diseases was shifted towards a predominance of rarer SNPs while the distribution of proportions of the risk alleles for environmental lifestyle dependent diseases was almost per-fectly symmetrical and bell-shaped.
Common human diseases may create conditions for positive selection for disease protective alleles, while risk associated alleles are expected to be slightly deleterious [26,27,30] and there-fore to be under pressure of negative selection. Based on these considerations we expected that GWAS detected disease-associated SNPs will show signals of positive and/or negative selection. We found, however, that the proportion of GWAS-detected SNPs with the signature of recent positive selection does not differ from the proportion of SNPs with the signature of recent posi-tive selection on genotyping platforms, suggesting that disease associated SNP have the same chances to be positively selected during the process of GWAS analysis as an average SNP in the human genome. On the other hand, our analysis supports the hypothesis that risk-associated alleles frequently undergo negative selection. We found that risk-associated alleles are more common among minor alleles. The overall distribution of the risk alleles is shifted to lower fre-quencies indicating an effect of negative selection against risk-associated variants. We further hypothesized that the effects of negative selection on allelic spectra may be different for envi-ronment/lifestyle dependent versus envienvi-ronment/lifestyle independent diseases. We found environment/lifestyle dependent diseases tend to have a higher frequency of the risk associated variants suggesting a weaker effect of negative selection.
It is widely accepted that the majority of genetic variants in human populations are neutral [38,39]. It is also known that selective value of the variants depends on the environment
Fig 2. The proportions of minor risk alleles (MiRA) in the first, second and third tertiles defined based on the environment/lifestyle index (ELI).
[40,41]. A neutral variant may become advantageous (or disadvantageous) when environment changes. For example, mutations controlling lactose tolerance were initially neutral and became advantageous about 5,000–8,000 BC, after domestication of cattle [42,43]. It is becom-ing more and more evident that many common human diseases are caused by changes in
0 0.1 0.2 0.3 0.4 0.5 ProporƟon of the ris k alleles Frequency group First tertile Second tertile Third tertile Expected distribution
a)
0 0.1 0.2 0.3 0.4 0.5 ProporƟon of the ris k alle le s Frequency groupType 2 diabetes Coronary heart disease Obesity Expected distribution
c)
0 0.1 0.2 0.3 0.4 0.5 ProporƟon of the ris k alleles Frequency group Rheumatoid arthritisSystemic lupus erythematosus Myopia (pathological) Expected distribution
b)
0 0.1 0.2 0.3 0.4 0.5 ProporƟon of the ris k alleles Frequency group Environment/lifestyle independent Environment/lifestyle dependent Expected distributiond)
Fig 3. Frequency binned distributions of the risk alleles for different common diseases.F—frequency of the risk-associated allele. Area under each
curve equals 1. Black line shows the distribution expected under the assumption that the probability of the allele to be risk associated is independent of its frequency. a) Proportions of the risk alleles in the 5 frequency categories for diseases stratified by the ELI tertiles. b) Proportions of the risk alleles for 3 individual diseases from the first tertile (environment/lifestyle independent diseases). c) Distributions of risk alleles for 3 individual diseases from the third ELI tertile (environment/lifestyle dependent diseases). d) Proportions of the risk alleles averaged for the 3 environment/lifestyle dependent (red line) and 3 environment/lifestyle independent (blue line) diseases.
environment and/or lifestyle [44–48]. Changes in environment or lifestyle may redefine func-tional significance of existing neutral SNPs. One can expect that the majority of risk associated variants for environment/lifestyle dependent diseases are recently recruited from the pool of selectively neutral variants. Whether those formerly neutral variants will be risk-associated or disease protective depends on how they influence biology. It is unlikely that direction of the effect (risk-associated or protective) of a recently neutral variant will depend on its frequency. Let’s assume, for example, that there is a SNP that slightly modulates the expression level of some gene and its effect is selectively neutral. In this case the frequency of the allele associated with a low expression level is not influenced by selection, so this variant can be minor (<50%) or major (>50%). Let’s assume that changes in environment or lifestyle made a low expression level of the gene associated with increased risk. In this scenario the distribution of the risk-asso-ciated alleles will initially follow the neutral model even though it is not selectively neutral any-more. It will take time (tens to hundreds generations, depending on the selective pressure) for the negative selection to reduce the frequency of the risk alleles.
Therefore, even though many formally neutral risk variants are (currently) deleterious, their allelic spectra will follow the neutral model for some time.Fig 4depicts the hypothesis of recently neutral, currently deleterious risk-associated variants. The figure shows a hypothetical example with individual selection coefficients (upper panel) and frequency distributions of the risk alleles (lower panel). According to the proposed model, changing environment reassigns selective values of existing SNPs which is indicated by different profile of selection coefficients (upper panel) before and after the change in the environment took place. Immediately after changes in the environment the frequency distribution of risk associated alleles is symmetrical. Negative selection against risk alleles reduces their frequencies, shifting the distribution to the left and making it asymmetrical.
Environmental diseases are defined as diseases whose incidence can be directly related to effects of environmental factors. Disease-causing environmental factors include but are not limited to stress, physical and mental abuse, diet, exposure to toxins, pathogens, radiation, and chemicals. Many common human diseases are considered to be environmental [49–51]. In the context of this study by environment/lifestyle factors we mean recent (less than several genera-tions away) changes in lifestyle and environment. Such changes redefine selective profiles on existing SNPs, but because they are recent, there is not sufficient time for selection to change allelic frequencies.
Based on the results of our analysis, risk-associated alleles can be roughly divided into two categories: evolutionarily old and evolutionarily young. Old alleles have a long history of being risk associated so natural selection has had enough time to influence their frequencies. Young risk alleles recently came from the pool of selectively neutral variants and because of that his-tory, selection has not had sufficient time to influence their frequencies. One can expect that alleles associated with the risk of environment/lifestyle dependent diseases will most often be young whereas the alleles associated with the risk of environment/lifestyle independent dis-eases will more often be evolutionarily old. The proportions of young and old alleles for a given disease can be roughly estimated by comparing the frequency distribution of risk variants with the distribution expected under the null, under which the probability to be risk associated is frequency independent. Currently the frequency distribution of risk variants can be reasonably estimated for a limited number of well-studied diseases only, but with the advance of GWASs this information will be available for more and more diseases.
spectra of the risk-associated variants follow the neutral model, one may predict the number of risk-associated variants in different frequency groups (under the neutral model we assume that the effect size is independent of allelic frequency) which can be used to estimate the sample size required for the detection of SNPs from a specified frequency range. The results of our analysis suggest that the nearly-neutral model is applicable to common disease variants resulting from recent changes in environment and/or life style which convert neutral variants into slightly del-eterious (risk associated) or advantageous (protective).
Materials and Methods
Disease-associated SNPs
SNPs associated with the risk of human diseases were retrieved from the Catalogue of Pub-lished Genome-Wide Association Studies (CPGWAS) (http://www.genome.gov/26525384/) [33]. The CPGWAS was accessed on December 15, 2014. SNPs with reported P-values of 510−8or lower were used in the analysis.
SNPs with a signature of recent positive selection
All tests for detecting the signature of recent positive selection are quantitative and a decision is made based on specified thresholds [12,52]. As a result, the lists of the SNPs with the signature of recent positive selection vary depending on the method and thresholds chosen. We used 24,060 SNPs with the signature of recent positive selection reported in the database of positive selection in human populations (dbPSHP)[53]. Those SNPs were identified by applying a set of stringent filters that are consistent across 6 most commonly used approaches to detect a sig-nature of recent positive selection: Tajima’s D, Integrated Haplotype Score, Extended Haplo-type Homozygosity, Cross-Population Composite Likelihood Ratio, Difference of Derived Allele Frequency, and Fixation Index [53].
Assessing effects of negative selection on allelic spectra
Both minor alleles (those with the frequency<50%) and major alleles (those with the fre-quency>50%) can be risk associated—risk alleles. The frequency distribution which includes frequencies of both minor and major alleles of the SNPs by definition will be symmetrical, since the absolute majority of the SNPs (more than 95%) are biallelic with one minor and one
Fig 4. Expected evolutionary dynamics of currently deleterious, recently neutral risk associated alleles.Upper panel shows the distribution of
selection coefficients: negative values imply negative and positive values positive selection. A change in the environment or life style leads to changes in selective values of existing variants making some of previously neutral variants deleterious and others advantageous. The lower panel shows frequency distributions of risk alleles immediately after changes in environment/life style and after the negative selection took place.
reciprocal major allele. If a minor allele has the same chance to be risk-associated as the recip-rocal major allele, the frequency distribution of the risk alleles should be symmetrical.
Note that overall distribution of SNP’s allele frequencies is symmetrical and U-shaped [54]. This is because proportion of rare SNPs in the human genome is higher than proportion of common SNPs. Distribution of the GWAS-detected disease-associated SNPs is bell-shaped because common SNPs are overrepresented on genotyping platforms and also because GWASs are underpowered to detect rare disease-associated SNPs.
Negative selection against associated variants will increase the proportion of the risk-associated variants among alleles with minor frequency. We used the proportion of the risk alleles with minor allele frequencies—minor risk alleles (MiRA) as an estimator of the effect of negative selection. Under the null hypothesis—rare (minor) alleles have the same chances to be risk associated as the reciprocal common (major) allele—MiRA proportion is expected to be 0.5. The stronger the negative selection against the risk-associated variant, the higher MiRA proportion will be.
We also assessed the distributions of the risk-associated alleles by their frequencies. Risk alleles were binned into 5 frequency (F) groups: 0<F<0.2, 0.2F<0.4, 0.4F<0.6, 0.6F<0.8, 0.8F<1. We chose 5 groups because it is optimal for the available sample sizes. Data on the population frequency of the risk alleles were from original GWASs. We used reported frequen-cies of the risk-associated alleles in controls.
We did not use ancestral/derived allele status in the analysis even though it has been shown to be relevant to selection and risk of common diseases [55,56]. The reason for this was that ancestral/derived status is not available for many SNPs, especially those located in intronic or intergenic regions. Using ancestral information in this analysis would have reduced the num-ber of SNPs we could evaluate and introduce a bias because SNPs would have been excluded from analysis based on the level of evolutionary conservation (ancestral/derived status infor-mation is only available for SNPs located in evolutionary conserved regions, which allows sequence alignment from multiple species [57]).
Environment/lifestyle index (ELI)
Genetic share of the disease risk can be assessed by disease heritability. Estimated disease heri-tability varies from less than 5% for stomach cancer [58] to almost 90% for type 1 diabetes [59]. Unfortunately estimates of the disease heritability are not reliable [60] and can be con-founded by shared environment [61,62].
We applied text mining to estimate relative influence of environmental and lifestyle factors on disease etiology. Environment/Lifestyle Index (ELI) was used as a measure of the influence of environmental and lifestyle factors on disease etiology. To estimate ELI we first searched PubMed for the disease name, e.g.“rheumatoid arthritis”, and identified papers with disease name in the abstract. Next we identified the number of papers mentioning together disease name and“environment”or“lifestyle”. ELI was computed as the number of the papers men-tioning disease name AND environment or lifestyle per 1,000 papers menmen-tioning disease name. As an example, there are 120,346 abstracts mentioning rheumatoid arthritis, 1,578 abstracts mentioning“rheumatoid arthritis”and“environment”, and 393 abstracts mentions “rheumatoid arthritis”and“lifestyle”which give ELI for rheumatoid arthritis: ELIRI= (1,578
+393)/120,3461000 = 16.4.
dynamics in disease prevalence. This was the reason that we used environment/lifestyle index rather than disease prevalence as a measure of disease dependence of environment/lifestyle.
Commonly used genotyping platforms
The list of 10 most commonly used genotyping platforms was obtained by reviewing platforms listed on CPGWAS database. For each platform we retrieved the list of SNPs using manufactur-ers’data and among them identified SNPs with the signature of recent positive selection from dbPSHP database [53].
Statistical analysis
Statistical analysis was done using STATA software (version 10, StataCorp LP, College Station, TX). We usedx2test to compare observed to expected proportions. We applied nonparametric statistical tests, e.g. Spearman rank test, for the datasets with significant deviation from normal distribution.
Supporting Information
S1 Table. Extended environment/lifestyle index. (DOCX)
S1 Fig. Environment/lifestyle index (ELI) versus extended environment/lifestyle index (EELI).
(DOCX)
Acknowledgments
We thank the three anonymous reviewers and the journal editors for providing constructive criticism and feedback that greatly improved the manuscript.
Author Contributions
Conceived and designed the experiments: IPG OYG CIA. Performed the experiments: IPG. Analyzed the data: IPG OYG. Wrote the paper: IPG OYG CIA.
References
1. Barnes E (2007) Diseases and Human Evolution: University of New Mexico Press.
2. Shastry BS (2002) SNP alleles in human disease and evolution. J Hum Genet 47: 561–566. PMID: 12436191
3. Wu H, Ma BG, Zhao JT, Zhang HY (2007) How similar are amino acid mutations in human genetic dis-eases and evolution. Biochem Biophys Res Commun 362: 233–237. PMID:17681277
4. Genuis SJ (2012) What's out there making us sick? J Environ Public Health 2012: 605137. doi:10. 1155/2012/605137PMID:22262979
5. Oschman JL (2011) Chronic disease: are we missing something? J Altern Complement Med 17: 283– 285. doi:10.1089/acm.2011.0101PMID:21438673
6. Fu YX, Li WH (1993) Statistical tests of neutrality of mutations. Genetics 133: 693–709. PMID: 8454210
7. Tajima F (1989) Statistical method for testing the neutral mutation hypothesis by DNA polymorphism. Genetics 123: 585–595. PMID:2513255
8. Kim Y, Nielsen R (2004) Linkage disequilibrium as a signature of selective sweeps. Genetics 167: 1513–1524. PMID:15280259
10. Depaulis F, Veuille M (1998) Neutrality tests based on the distribution of haplotypes under an infinite-site model. Mol Biol Evol 15: 1788–1790. PMID:9917213
11. Suzuki Y, Gojobori T (1999) A method for detecting positive selection at single amino acid sites. Mol Biol Evol 16: 1315–1328. PMID:10563013
12. Biswas S, Akey JM (2006) Genomic insights into positive selection. Trends Genet 22: 437–446. PMID: 16808986
13. Kelley JL, Swanson WJ (2008) Positive selection in the human genome: from genome scans to biologi-cal significance. Annu Rev Genomics Hum Genet 9: 143–160. doi:10.1146/annurev.genom.9.081307. 164411PMID:18505377
14. Nielsen R (2005) Molecular signatures of natural selection. Annu Rev Genet 39: 197–218. PMID: 16285858
15. Vitti JJ, Grossman SR, Sabeti PC (2013) Detecting natural selection in genomic data. Annu Rev Genet 47: 97–120. doi:10.1146/annurev-genet-111212-133526PMID:24274750
16. Pritchard JK, Pickrell JK, Coop G (2010) The genetics of human adaptation: hard sweeps, soft sweeps, and polygenic adaptation. Curr Biol 20: R208–215. doi:10.1016/j.cub.2009.11.055PMID:20178769 17. Hernandez RD, Kelley JL, Elyashiv E, Melton SC, Auton A, et al. (2011) Classic selective sweeps were
rare in recent human evolution. Science 331: 920–924. doi:10.1126/science.1198878PMID: 21330547
18. Messer PW, Petrov DA (2013) Population genomics of rapid adaptation by soft selective sweeps. Trends Ecol Evol 28: 659–669. doi:10.1016/j.tree.2013.08.003PMID:24075201
19. Uecker H, Hermisson J (2011) On the fixation process of a beneficial mutation in a variable environ-ment. Genetics 188: 915–930. doi:10.1534/genetics.110.124297PMID:21652524
20. Bamshad M, Wooding SP (2003) Signatures of natural selection in the human genome. Nat Rev Genet 4: 99–111. PMID:12560807
21. Raj T, Kuchroo M, Replogle JM, Raychaudhuri S, Stranger BE, et al. (2013) Common risk alleles for inflammatory diseases are targets of recent positive selection. Am J Hum Genet 92: 517–529. doi:10. 1016/j.ajhg.2013.03.001PMID:23522783
22. Pickrell JK, Coop G, Novembre J, Kudaravalli S, Li JZ, et al. (2009) Signals of recent positive selection in a worldwide sample of human populations. Genome Res 19: 826–837. doi:10.1101/gr.087577.108 PMID:19307593
23. Lohmueller KE, Mauney MM, Reich D, Braverman JM (2006) Variants associated with common dis-ease are not unusually differentiated in frequency across populations. Am J Hum Genet 78: 130–136. PMID:16385456
24. Myles S, Davison D, Barrett J, Stoneking M, Timpson N (2008) Worldwide population differentiation at disease-associated SNPs. BMC Med Genomics 1: 22. doi:10.1186/1755-8794-1-22PMID:18533027 25. Wang WY, Pike N (2004) The allelic spectra of common diseases may resemble the allelic spectrum of
the full genome. Med Hypotheses 63: 748–751. PMID:15325027
26. Gorlov IP, Gorlova OY, Frazier ML, Spitz MR, Amos CI (2011) Evolutionary evidence of the effect of rare variants on disease etiology. Clin Genet 79: 199–206. doi:10.1111/j.1399-0004.2010.01535.x PMID:20831747
27. Gorlov IP, Gorlova OY, Sunyaev SR, Spitz MR, Amos CI (2008) Shifting paradigm of association stud-ies: value of rare single-nucleotide polymorphisms. Am J Hum Genet 82: 100–112. doi:10.1016/j.ajhg. 2007.09.006PMID:18179889
28. Hughes AL, Packer B, Welch R, Bergen AW, Chanock SJ, et al. (2003) Widespread purifying selection at polymorphic sites in human protein-coding loci. Proc Natl Acad Sci U S A 100: 15754–15757. PMID: 14660790
29. Nakagome S, Mano S, Kozlowski L, Bujnicki JM, Shibata H, et al. (2012) Crohn's disease risk alleles on the NOD2 locus have been maintained by natural selection on standing variation. Mol Biol Evol 29: 1569–1585. doi:10.1093/molbev/mss006PMID:22319155
30. Reich DE, Lander ES (2001) On the allelic spectrum of human disease. Trends Genet 17: 502–510. PMID:11525833
31. Fumagalli M, Sironi M (2014) Human genome variability, natural selection and infectious diseases. Curr Opin Immunol 30C: 9–16.
33. Hindorff LA, Sethupathy P, Junkins HA, Ramos EM, Mehta JP, et al. (2009) Potential etiologic and func-tional implications of genome-wide association loci for human diseases and traits. Proc Natl Acad Sci U S A 106: 9362–9367. doi:10.1073/pnas.0903103106PMID:19474294
34. Luo XJ, Mattheisen M, Li M, Huang L, Rietschel M, et al. (2015) Systematic Integration of Brain eQTL and GWAS Identifies ZNF323 as a Novel Schizophrenia Risk Gene and Suggests Recent Positive Selection Based on Compensatory Advantage on Pulmonary Function. Schizophr Bull.
35. Ramos PS, Shaftman SR, Ward RC, Langefeld CD (2014) Genes associated with SLE are targets of recent positive selection. Autoimmune Dis 2014: 203435. doi:10.1155/2014/203435PMID:24587899 36. Luo Y, Riedlinger G, Szolovits P (2014) Text mining in cancer gene and pathway prioritization. Cancer
Inform 13: 69–79.
37. Pletscher-Frankild S, Palleja A, Tsafou K, Binder JX, Jensen LJ (2014) DISEASES: Text mining and data integration of disease-gene associations. Methods.
38. Orr N, Chanock S (2008) Common genetic variation and human disease. Adv Genet 62: 1–32. doi:10. 1016/S0065-2660(08)00601-9PMID:19010252
39. Peters DT, Musunuru K (2012) Functional evaluation of genetic variation in complex human traits. Hum Mol Genet 21: R18–23. PMID:22936690
40. Kimura M (1983) The neutral theory of molecular evolution. Cambridge [Cambridgeshire]; New York: Cambridge University Press. xv, 367 p. p.
41. Maynard Smith J (1993) The theory of evolution. Cambridge [England]; New York: Cambridge Univer-sity Press. xxii, 354 p. p.
42. Burger J, Kirchner M, Bramanti B, Haak W, Thomas MG (2007) Absence of the lactase-persistence-associated allele in early Neolithic Europeans. Proc Natl Acad Sci U S A 104: 3736–3741. PMID: 17360422
43. Tishkoff SA, Reed FA, Ranciaro A, Voight BF, Babbitt CC, et al. (2007) Convergent adaptation of human lactase persistence in Africa and Europe. Nat Genet 39: 31–40. PMID:17159977
44. Lam DW, LeRoith D (2012) The worldwide diabetes epidemic. Curr Opin Endocrinol Diabetes Obes 19: 93–96. PMID:22262000
45. Lopez-Jaramillo P, Casas JP, Bautista L, Serrano NC, Morillo CA (2001) An integrated proposal to explain the epidemic of cardiovascular disease in a developing country. From socioeconomic factors to free radicals. Cardiology 96: 1–6.
46. Proctor RN (2001) Tobacco and the global lung cancer epidemic. Nat Rev Cancer 1: 82–86. PMID: 11900255
47. Velasquez-Manoff M An Epidemic of Absence: A New Way of Understanding Allergies and Autoim-mune Diseases. New York: A Division of Simon &Schuster, Inc.
48. Velasquez-Manoff M (2012) An Epidemic of Absence: A New Way of Understanding Allergies and Autoimmune Disease. New York: A Division of Simon & Schuster, Inc.
49. Carlsten C, Georas SN (2014) Update in environmental and occupational lung diseases 2013. Am J Respir Crit Care Med 189: 1037–1043. doi:10.1164/rccm.201401-0108UPPMID:24787066 50. Lubrano C, Genovesi G, Specchia P, Costantini D, Mariani S, et al. (2013) Obesity and metabolic
comorbidities: environmental diseases? Oxid Med Cell Longev 2013: 640673. doi:10.1155/2013/ 640673PMID:23577225
51. Norman RE, Carpenter DO, Scott J, Brune MN, Sly PD (2013) Environmental exposures: an underre-cognized contribution to noncommunicable diseases. Rev Environ Health 28: 59–65. doi:10.1515/ reveh-2012-0033PMID:23612529
52. Tang K, Thornton KR, Stoneking M (2007) A new approach for using genome scans to detect recent positive selection in the human genome. PLoS Biol 5: e171. PMID:17579516
53. Li MJ, Wang LY, Xia Z, Wong MP, Sham PC, et al. (2014) dbPSHP: a database of recent positive selec-tion across human populaselec-tions. Nucleic Acids Res 42: D910–916. doi:10.1093/nar/gkt1052PMID: 24194603
54. Dickson SP, Wang K, Krantz I, Hakonarson H, Goldstein DB (2010) Rare variants create synthetic genome-wide associations. PLoS Biol 8: e1000294. doi:10.1371/journal.pbio.1000294PMID: 20126254
55. Gorlova OY, Ying J, Amos CI, Spitz MR, Peng B, et al. (2012) Derived SNP alleles are used more fre-quently than ancestral alleles as risk-associated variants in common human diseases. J Bioinform Comput Biol 10: 1241008. doi:10.1142/S0219720012410089PMID:22809343
57. Hacia JG, Fan JB, Ryder O, Jin L, Edgemon K, et al. (1999) Determination of ancestral alleles for human single-nucleotide polymorphisms using high-density oligonucleotide arrays. Nat Genet 22: 164–167. PMID:10369258
58. Czene K, Lichtenstein P, Hemminki K (2002) Environmental and heritable causes of cancer among 9.6 million individuals in the Swedish Family-Cancer Database. Int J Cancer 99: 260–266. PMID: 11979442
59. Hyttinen V, Kaprio J, Kinnunen L, Koskenvuo M, Tuomilehto J (2003) Genetic liability of type 1 diabetes and the onset age among 22,650 young Finnish twin pairs: a nationwide follow-up study. Diabetes 52: 1052–1055. PMID:12663480
60. Freitag CM (2007) The genetics of autistic disorders and its clinical relevance: a review of the literature. Mol Psychiatry 12: 2–22. PMID:17033636
61. Gifford F (1989) Complex genetic causation of human disease: critiques of and rationales for heritability and path analysis. Theor Med 10: 107–122. PMID:2675372