BGD
12, 17781–17816, 2015
Exportable production in the
Mauritanian upwelling
D. R. Clark et al.
Title Page
Abstract Introduction
Conclusions References
Tables Figures
◭ ◮
◭ ◮
Back Close
Full Screen / Esc
Printer-friendly Version Interactive Discussion
Discussion
P
a
per
|
Discussion
P
a
per
|
Discussion
P
a
per
|
Discussion
P
a
per
|
Biogeosciences Discuss., 12, 17781–17816, 2015 www.biogeosciences-discuss.net/12/17781/2015/ doi:10.5194/bgd-12-17781-2015
© Author(s) 2015. CC Attribution 3.0 License.
This discussion paper is/has been under review for the journal Biogeosciences (BG). Please refer to the corresponding final paper in BG if available.
The significance of nitrogen regeneration
for new production within a filament of
the Mauritanian upwelling system
D. R. Clark, C. E. Widdicombe, A. P. Rees, and E. M. S. Woodward
Plymouth Marine Laboratory, Prospect Place, West Hoe, Plymouth, PL1 3DH, UK
Received: 23 October 2015 – Accepted: 26 October 2015 – Published: 6 November 2015
Correspondence to: D. R. Clark (drcl@pml.ac.uk)
BGD
12, 17781–17816, 2015
Exportable production in the
Mauritanian upwelling
D. R. Clark et al.
Title Page
Abstract Introduction
Conclusions References
Tables Figures
◭ ◮
◭ ◮
Back Close
Full Screen / Esc
Printer-friendly Version Interactive Discussion
Discussion
P
a
per
|
Discussion
P
a
per
|
Discussion
P
a
per
|
Discussion
P
a
per
|
Abstract
The lagrangian progression of biogeochemical processes was followed in a filament of the Mauritanian upwelling system, North West Africa, during offshore advection. In-ert duel tracers sulphur hexafluoride and helium-3 labelled a freshly upwelled patch of water that was mapped for 8 days. Changes in biological, physical and chemical
5
characteristics were measured including phytoplankton productivity, nitrogen assimila-tion and regeneraassimila-tion. Freshly upwelled water contained high nutrient concentraassimila-tions (NO−3=9.0±0.1 µmol L−1; PO34−=0.7±0.1 µmol L
−1
; Si=2.7±0.1 µmol L−1) but was
depleted in N compared to Redfield stoichiometry (N : P=13.9 : 1). A maximum pri-mary productivity rate of 0.7 mol C m−2d−1was measured on the continental shelf,
as-10
sociated with N-assimilation rates of 43.8 nmol L−1h−1 for NO−3, 32.8 nmol L−1h−1 for NH+4 and a phytoplankton community dominated by diatoms and flagellates. Indica-tors of phytoplankton abundance and activity decreased as the labelled water mass transited the continental shelf slope into deeper water, possibly linked to the mixed layer depth exceeding the light penetration depth. By the end of the study, primary
15
productivity rates of 0.1 mol C m−2d−1 were measured, associated with N-assimilation rates of 3.9 nmol L−1h−1for NO−
3, 6.1 nmol L− 1
h−1for NH+
4 and lower nutrient
concen-trations (NO−3 =4.6±0.3 µmol L−1; PO34−=0.4±0.1 µmol L
−1
; Si=0.9±0.1 µmol L−1).
Nitrogen regeneration and assimilation took place simultaneously; NH+4 was regener-ated at 9.4–85.0 nmol L−1h−1; NH+4 was oxidised at 0.30–8.75 nmol L−1h−1; NO−2 was
20
oxidised at 25.55–81.11 nmol L−1h−1. Results highlight the importance of regenerated NH+4 in sustaining phytoplankton productivity and indicate that the upwelled NO−3 pool contained an increasing fraction of regenerated NO−3 as it advected offshore. By calcu-lating this fraction and incorporating it into anf ratio formulation we estimated that of the 12.38 Tg C of annual regional production, 4.73 Tg C was exportable.
25
BGD
12, 17781–17816, 2015
Exportable production in the
Mauritanian upwelling
D. R. Clark et al.
Title Page
Abstract Introduction
Conclusions References
Tables Figures
◭ ◮
◭ ◮
Back Close
Full Screen / Esc
Printer-friendly Version Interactive Discussion
Discussion
P
a
per
|
Discussion
P
a
per
|
Discussion
P
a
per
|
Discussion
P
a
per
|
1 Introduction
The combination of northeast trade winds and the Coriolis effect due to earth’s rota-tion drives the upwelling of deep nutrient-rich waters into the photic zone of coastal regions in eastern ocean boundaries. Upwelling supports characteristically enhanced biological production and valuable ecosystem services typified by fisheries (Pauly and
5
Christensen, 1995; Arístegui et al., 2009). The maturation and development of bio-logical communities within upwelled water masses as they advect offshore reflects a characteristic feature of eastern boundary upwelling ecosystems (EBUE); the spatial separation of nutrient sources and sinks. Gauging the extent of biological production ultimately exported from upwelling regions is an area of continuing investigation and
10
model development (Álvarez-Salgado et al., 2007; Arístegui et al., 2009).
The North West African upwelling system is possibly the least studied of the four global EBUE’s (California, Peru–Chile, Iberia/NW Africa, Benguela) and is potentially the most complex due to its topography and circulation (Mittelstaedt, 1991; Tomczak and Godfrey, 2003; Arístegui et al., 2006; Chavez and Messié, 2009; Meunier et al.,
15
2012). The Mauritanian region within this system is characterised by a relatively wide shelf area over which upwelled water influences biological productivity (Mittelstaedt, 1991), while extended filaments and island induced eddies are additional features (Arístegui et al., 2009). The system can be separated into two regimes; the region between 15 and 20◦N undergoes periodic upwelling which dominates during winter
20
and spring, whereas the region north of 20◦N is characterised by year round coastal upwelling with maximum intensity during summer and autumn (Mittelstaedt, 1991). The study region, located between 20–22◦N, lies at the confluence between the two source waters upwelled in this system (North Atlantic Central Water and South Atlantic Cen-tral Water; Mittelstaedt, 1991), which differ in their salinity, temperature and nutrient
25
BGD
12, 17781–17816, 2015
Exportable production in the
Mauritanian upwelling
D. R. Clark et al.
Title Page
Abstract Introduction
Conclusions References
Tables Figures
◭ ◮
◭ ◮
Back Close
Full Screen / Esc
Printer-friendly Version Interactive Discussion
Discussion
P
a
per
|
Discussion
P
a
per
|
Discussion
P
a
per
|
Discussion
P
a
per
|
The highly dynamic nature of upwelling systems challenges our ability to under-stand how biological activity develops as water masses advect offshore. Both eulerian (occupying a fixed location over time through which upwelled water passes) and la-grangian (occupying a water mass as it passes through space and time) strategies have been adopted. The eulerian approach was successfully applied in a study of the
5
Northern Benguela by Postel et al. (2014); a challenge facing this approach is the risk that stations do not sample successive changes in upwelled water due to the dynamic meandering nature of advective transport. Drifting buoys have been used in previous la-grangian studies of upwelling regions (Joint et al., 2001; Wilkerson and Dugdale, 1987) although buoy tracks diverge over time (D’Asaro, 2004) leading to uncertainty about the
10
location of upwelled water masses. To address some of these issues, the inert gases sulphur hexafluoride (SF6) and helium-3 (
3
He) were used to label a water body within a recently upwelled filament. In combination with drifting buoys and mapping exercises, the progression of this labelled water mass and its associated biological activity was followed in lagrangian mode during offshore advection. Our objective was to investigate
15
phytoplankton productivity, microbial nitrogen cycling and to estimate exportable new production.
The assimilation of nitrogen by phytoplankton was introduced as a means of esti-mating “new” and “exportable” production (f ratio; Dugdale and Goering, 1967; Eppley and Peterson, 1979), based on the assumption that NO−
3 regeneration and
assimila-20
tion processes were spatially distinct, being associated with the aphotic and photic zones respectively. Consequently, the physical introduction of NO−3 to the photic zone was deemed capable of supporting an increase in phytoplankton productivity. All other forms of nitrogen were deemed to be regenerated (e.g. NH+4), having previously been subject to microbial activity and capable only of sustaining rather than enhancing
phyto-25
plankton growth. According to this concept, upwelling regions, which characteristically introduced deep nutrient rich waters to the photic zone, were associated with highf ra-tios (i.e.>0.7) reflecting the high proportion of total N-assimilation supported by NO−3. By contrast, strong stratification supressed nutrient inputs to the photic zone of
BGD
12, 17781–17816, 2015
Exportable production in the
Mauritanian upwelling
D. R. Clark et al.
Title Page
Abstract Introduction
Conclusions References
Tables Figures
◭ ◮
◭ ◮
Back Close
Full Screen / Esc
Printer-friendly Version Interactive Discussion
Discussion
P
a
per
|
Discussion
P
a
per
|
Discussion
P
a
per
|
Discussion
P
a
per
|
otrophic gyres and biological competition for limited nutrient resources maintained very low NO−3 concentrations and f ratios (i.e. <0.1). Investigators have offered tractable means of addressing limitations associated with this concept since its introduction, such as the influence of isotope dilution due to nitrogen regeneration (Glibert et al., 1982; Kanda et al., 1987). However, the assumption that NO−3 is not regenerated within
5
the photic zone is now known to be inaccurate (Ward, 2008). This last point perhaps presents the greatest challenge to the utility of the new production paradigm. While the simultaneous assimilation and regeneration of NO−3 can be measured (Fernández et al., 2005, 2009; Benavides et al., 2014; Clark et al., 2014) and potentially accounted for (Fernández and Raimbault, 2007), the fraction of previously regenerated NO−3
can-10
not be estimated readily (Martin and Pondaven, 2006). Consequently, the fraction of photic zone NO−3 that is actually representative of “new” NO−3 is uncertain. Upwelling areas are an exception; seawater upwelled in the Mauritanian upwelling system may be regarded as genuinely “new” to the photic zone, consistent with the original concept. Here we aimed to address the significance of nitrification for new production estimates
15
in the Mauritanian Upwelling system.
2 Materials and methods
The study was undertaken on board the RRS Discovery (D338; 15 April to 27 May 2009) as a UK contribution to the international Surface Ocean Lower Atmo-sphere Study (SOLAS) project. Remotely sensed sea surface temperature and
chloro-20
phylladata was used to identify a region of active upwelling. Surveys of water column physical structure were conducted in order to select the position for drifter buoy de-ployment. SF6/3He was deployed in a patch (hereafter referred to as P1) at a depth
of 5 m around the drifter (Nightingale et al., 2000). Daily surveys for SF6/ 3
He using on-board GC detection ensured that seawater sampling was centred upon the labelled
25
BGD
12, 17781–17816, 2015
Exportable production in the
Mauritanian upwelling
D. R. Clark et al.
Title Page
Abstract Introduction
Conclusions References
Tables Figures
◭ ◮
◭ ◮
Back Close
Full Screen / Esc
Printer-friendly Version Interactive Discussion
Discussion
P
a
per
|
Discussion
P
a
per
|
Discussion
P
a
per
|
Discussion
P
a
per
|
could no longer be detected reliably. Chemical, physical and biological characteristics of the water mass were measured during the lagrangian study.
Seawater samples were collected from CTD rosette-mounted Niskin bottles which sampled routinely at a depth equivalent to 55 % of surface photosynthetically active radiation (sPAR). Where water column depth permitted, samples were collected less
5
frequently at 1 % sPAR. The assimilation and regeneration of DIN was investigated using15N amended seawater during deck incubations (Clark et al., 2014). Simultane-ously, size fractionated primary productivity was measured in depth profiles using deck incubations with 14C (Tilstone et al., 2009). For all deck incubations, neutral density filters simulated sPAR according to Joint Global Ocean Flux Study protocols
(Intergov-10
ernmental Oceanographic Commission, 1994) and temperature control was achieved by flushing boxes with seawater from the ships sea-surface supply collected at≈5 m.
2.1 Nitrogen regeneration investigations
A 24-position stainless steel rosette system was used to collect seawater from specific depths using 20 L Niskin bottles. Water columns were characterised during casts using
15
additional instrumentation attached to the rosette, which included Seabird 9 Plus con-ductivity, temperature, depth (CTD) units, a Seabird SBE 43 dissolved oxygen sensor and a Chelsea MKIII Aquatracka fluorometer. Seawater was collected during pre-dawn casts (approximately 04:00 GMT) at depths equivalent to specific sPAR values, which were derived from the previous days light attenuation profiles. All glassware used for
20
the manipulation of seawater was cleaned with 10 % HCL (reagent grade, 37 %) be-tween CTD sampling iterations and rinsed thoroughly with Milli-Q high purity water within sampling iterations. Chemicals and solvents were analytical and High Perfor-mance Liquid Chromatography (HPLC) grade respectively, supplied by Sigma-Aldrich (UK) unless otherwise stated. Stable isotope salts (15NH4Cl, Na
15
NO3, Na 15
NO2) were
25
supplied by CK gas products Ltd (UK).
A 20 L volume of seawater from each sampling depth was collected in a blacked-out Nalgene container and used for assimilation and regeneration process studies, which
BGD
12, 17781–17816, 2015
Exportable production in the
Mauritanian upwelling
D. R. Clark et al.
Title Page
Abstract Introduction
Conclusions References
Tables Figures
◭ ◮
◭ ◮
Back Close
Full Screen / Esc
Printer-friendly Version Interactive Discussion
Discussion
P
a
per
|
Discussion
P
a
per
|
Discussion
P
a
per
|
Discussion
P
a
per
|
ran in parallel, though for differing durations. Seawater used for these incubations was not pre-filtered (i.e. to remove particles greater than a specific size). As an overview, 6 L of this seawater was used for nitrogen assimilation studies while 12 L was used for nitrogen regeneration studies.
NH+4 regeneration rate was determined by amending a 4 L volume of seawater in
5
a blacked out container with15NH+4 at<10 % of the ambient concentration. This vol-ume was thoroughly mixed and left to stand for 20 min in order to ensure homogene-ity. Amended seawater was used to fill a 2.2 L incubation bottle, which was placed in a deck incubator at simulated light and temperature for approximately 8 h. The re-maining amended seawater was filtered through GF/F glass fibre filters and triplicate
10
100 mL volumes were set aside for the determination of pre-incubation NH+4 concentra-tion and isotopic enrichment by synthesising indophenol as described below. Following the deck incubation, bottle contents were filtered through GF/F filters and the filtrate was distributed between 3×100 mL volumes for the determination of post-incubation
NH+4 concentration and isotopic enrichment by synthesising indophenol.
15
An identical procedure was used for NH+4 and NO−2 oxidation incubations in which separate 4 L volumes of seawater were amended with15NO−2 and 15NO−3 respectively at<10 % of the ambient concentration. The concentration and isotopic enrichment of NO−2 was determined by synthesising sudan-1 in sample volumes of 100 mL, as de-scribed below. The concentration and isotopic enrichment of NO−3 was determined by
20
first reducing NO−3 to NO−2 using a high capacity cadmium column, and then synthesis-ing sudan-1 in volumes of 25–50 mL varysynthesis-ing with ambient concentration.
Indophenol was synthesised in samples by adding the first reagent (4.7 g phenol and 0.32 g sodium nitroprusside in 200 mL Milli Q water) in the proportion of 1 mL per 100 mL of sample volume, mixing the sample and leaving for 5 min. The second reagent
25
BGD
12, 17781–17816, 2015
Exportable production in the
Mauritanian upwelling
D. R. Clark et al.
Title Page
Abstract Introduction
Conclusions References
Tables Figures
◭ ◮
◭ ◮
Back Close
Full Screen / Esc
Printer-friendly Version Interactive Discussion
Discussion
P
a
per
|
Discussion
P
a
per
|
Discussion
P
a
per
|
Discussion
P
a
per
|
of aniline sulphate in 200 mL 3 M HCl) to samples in the proportion 0.5 mL per 100 mL sample volume. Samples were mixed and left for 5 min to homogenise after which sam-ple pH was verified to be≈2.0. Reagent 2 (24 g NaOH and 0.416 g 2-napthol in 200 mL
Milli Q) was added in the proportion 0.5 mL per 100 mL sample volume. Samples were again mixed, left for 5 min before sample pH was verified to be approximately 8.0.
5
Sudan-1, the development of which was complete after 30 min of incubation at room temperature, was collected by SPE.
Deuterated internal standards were added to samples immediately prior to SPE col-lection. Deuterated indophenol and deuterated sudan-1 were synthesised according to methods described previously (Clark et al., 2006, 2007) and purified by HPLC.
Stan-10
dard solutions in methanol were prepared (100 ng µL−1
) and the concentration verified against analytical standard solutions (Sigma-Aldrich). Appropriate volumes of deuter-ated internal standards (i.e. comparable to sample size) were added to samples follow-ing acidification by citric acid and prior to SPE collection.
Indophenol and sudan-1 were collected by SPE using 6 mL per 500 mg C18
car-15
tridges (Biotage, UK) which were prepared for sample collection by first rinsing with 5 mL methanol, followed by 5 mL Milli Q water and 5 mL 0.22 µm filtered seawater. Prior to sample collection seawater samples were acidified with 1 M citric acid to a pH of 5.5, before collection by SPE under low vacuum (120 mmHg) at a flow rate of approximately 1 mL min−1 without drying. Samples were then rinsed with 5 mL 0.22 µm filtered
sea-20
water and 5 mL Milli Q water before being air dried under high vacuum (360 mmHg). Samples were stored frozen until further processing at the land based laboratory.
At the land based laboratory, samples were brought to room temperature and pre-pared for HPLC purification and Gas Chromatography Mass Spectrometry (GCMS) analysis in the following way. Indophenol samples were eluted from SPE cartridges in
25
2 mL methanol. Samples were placed in a bench-top centrifuge for 2 min at 20 000×g
to remove particulate material derived from the SPE column. A 500 µL sub-sample was used for HPLC purification and GCMS analysis and the remaining 1.5 mL was stored at
−20◦C for any subsequent repetition of the analysis. 500 µL sub-samples were
BGD
12, 17781–17816, 2015
Exportable production in the
Mauritanian upwelling
D. R. Clark et al.
Title Page
Abstract Introduction
Conclusions References
Tables Figures
◭ ◮
◭ ◮
Back Close
Full Screen / Esc
Printer-friendly Version Interactive Discussion
Discussion
P
a
per
|
Discussion
P
a
per
|
Discussion
P
a
per
|
Discussion
P
a
per
|
orated under oxygen-free nitrogen (OFN) to 200 µL for HPLC, during which it was es-sential that samples were not reduced to dryness. 175 µL of the 200 µL samples were purified by HPLC using the preparative system, mobile phases and profile described in Clark et al. (2006) in combination with a Gemini-NX 5u C18 110A 250×4.6 mm
col-umn (Phenomenex, UK) with sample peak collection at a retention time of 38–40 min.
5
Collected sample fractions were blown dry under OFN at room temperature. Dried samples were stored for >24 h over anhydrous silica gel at room temperature prior to GCMS analysis. Samples were derivitised in 50 µL of 2.5 % Sylon HT in n-hexane and incubated at 50◦C for 4 h. Samples were analysed by GCMS using the system, ramping profiles and extracted ions described in Clark et al. (2006). Internal standards
10
were used to quantify sample NH+4 concentration, and when combined with sample enrichment, the rate of NH+4 regeneration was determined by applying the Blackburn– Caperon model (Blackburn, 1979; Caperon et al., 1979).
SPE columns loaded with sudan-1 samples were brought to room temperature and processed for HPLC purification and GCMS analysis in the following way. Sudan-1
15
samples were eluted from SPE cartridges in 2 mL of ethyl acetate. 100–300 µL sub-samples were used for further processing while the remaining sub-samples were stored at
−20◦C and available for subsequent repeated analysis. 100–300 µL sub-samples were
blown dry under OFN, re-dissolved in 200 µL methanol and centrifuged in a bench-top unit at 20 000×g for 2 min to remove particulate material derived from the SPE
20
packing. Samples were transferred to GC vials and purified by HPLC. The HPLC sys-tem described in Clark et al. (2007) was used in combination with the Gemini column identified above and the mobile phase profile described in Clark et al. (2014). Sample fractions, which were collected at retention time 25.5–27.5 min, were dried using a Zy-mark Turbovap evaporation unit at 50◦C using OFN. Dried samples were transferred to
25
GC vials and stored over anhydrous silica gel for 24 h prior to derivitisation in a 50 µL volume of 2.5 % MTBSTFA in ethyl acetate at 70◦C for 2 h. The GCMS unit, ramping profile and extracted ions described in Clark et al. (2007) were used to derive sample NO−
BGD
12, 17781–17816, 2015
Exportable production in the
Mauritanian upwelling
D. R. Clark et al.
Title Page
Abstract Introduction
Conclusions References
Tables Figures
◭ ◮
◭ ◮
Back Close
Full Screen / Esc
Printer-friendly Version Interactive Discussion
Discussion
P
a
per
|
Discussion
P
a
per
|
Discussion
P
a
per
|
Discussion
P
a
per
|
was derived by re-arranging the mixing model of Sweeney et al. (1978) as described in Clark et al. (2007) and by applying the Blackburn–Caperon model (Blackburn, 1979; Caperon et al., 1979).
2.2 Nitrogen assimilation measurements and thef ratio
Using 6 L of seawater, nitrogen assimilation rates were derived using15N techniques.
5
Triplicate 660 mL volumes of seawater were separately amended with 15NH+4 and
15
NO−3 at an enrichment of<10 % of the ambient concentration. Bottles were placed in deck incubators in conditions of simulated in-situ light and temperature for an av-erage of 6 h. A volume of un-amended seawater was filtered through GF/F and used to derive the15N natural abundance in particulate matter. Deck incubations were
ter-10
minated by filtration onto GF/F filters, which were frozen at−20◦C until isotope ratio
mass spectrometry analysis was undertaken at the land based laboratory. The rates of nitrogen assimilation (ρNH+4,ρNO−3) were determined using the equations of Dugdale and Goering (1967), corrected for nitrogen regeneration using the equations of Kanda et al. (1987).
15
N-assimilation data (not corrected for isotope dilution) was used to derive f ratio values by the original formulation as;
f ratio= ρNO −
3
ρNO−
3+ρNH
+
4
Thef ratio was re-calculated using N-assimilation rate data corrected for isotope dilu-tion (fc ratio). An additional formulation (fregenratio) calculated the f ratio by including
20
a consideration of previously regenerated NO−3 withinP1, represented as the fraction
of the total NO−
3 pool remaining as new NO
−
3 (RNO3);
fregen ratio=
(ρNO−3qR
NO3)
((ρNO−
3
qR
NO3)+ρNH+4)
BGD
12, 17781–17816, 2015
Exportable production in the
Mauritanian upwelling
D. R. Clark et al.
Title Page
Abstract Introduction
Conclusions References
Tables Figures
◭ ◮
◭ ◮
Back Close
Full Screen / Esc
Printer-friendly Version Interactive Discussion
Discussion
P
a
per
|
Discussion
P
a
per
|
Discussion
P
a
per
|
Discussion
P
a
per
|
The term RNO
3 was calculated using the following procedure and assumptions; it was assumed that RNO3 was conserved (i.e. no mixing took place); that NO−3 assimilation
was restricted to a 12 h light phase; that phytoplankton did not differentiate between “new” and “regenerated” NO−
3; that the measured rate of NO
−
2 oxidation (which
regen-erates NO−3) was sustained for each 24 h iteration. As an indication of the utility of using
5
NO−3 assimilation and regeneration processes to reflect NO−3 pool turnover, a variance of up to±25 % in calculated compared to measured NO−3 pool concentration was
mea-sured on a daily basis. However, over the duration of the study (T−1–T7) this difference
was−0.2 %, indicating that changes in ambient NO−3 concentration were adequately
described by considering only these processes within the constraints stated.
10
UsingT−1as an example, the ambient pool was assumed to have a RNO3value of 1,
indicating that it was composed only of “new” NO−3. The amount of NO−3 regenerated in this 24 h period was calculated. The value of RNO
3 after this 24 h period was calculated by dividing the ambient pool concentration (all new NO−3 for this first time point) by the sum of ambient and regenerated NO−
3 to give a value of 0.94. For the next 24 h period
15
(T0), the concentration of “new” NO−3 was calculated by multiplying theT0ambient NO−3
concentration by theT−1RNO3 value. The RNO3value at the end of this 24 h period was
calculated by dividing the concentration of new NO−
3 by the sum of ambient and newly
regenerated (i.e. withinT0) NO−3 to provide a value of 0.81. This process was repeated
for the study period.
20
2.3 Primary productivity measurements
Phytoplankton productivity was measured using the14C method (Tilstone et al., 2009). Samples were collected pre-dawn from 5 depths (97, 55, 33, 14, 1 % sPAR). Trip-licate 75 mL subsamples were amended with between 185 and 740 kBq (5–20 µCi) NaH14CO3and incubated on-deck for 24 h at simulated sPAR depth. Incubations were
BGD
12, 17781–17816, 2015
Exportable production in the
Mauritanian upwelling
D. R. Clark et al.
Title Page
Abstract Introduction
Conclusions References
Tables Figures
◭ ◮
◭ ◮
Back Close
Full Screen / Esc
Printer-friendly Version Interactive Discussion
Discussion
P
a
per
|
Discussion
P
a
per
|
Discussion
P
a
per
|
Discussion
P
a
per
|
terminated by sequential filtration through 2 and 0.2 µm polycarbonate filters.14C dis-integration was measured on-board using a TriCarb liquid scintillation counter.
2.4 Chlorophyll concentration
Chlorophyll a samples were collected simultaneously with seawater used for primary productivity measurements; 250 mL subsamples were collected from 5 depths (97,
5
55, 33, 14, 1 % sPAR) from pre-dawn CTD casts and immediately filtered sequentially through a 2 and 0.2 µm polycarbonate filters. Filters were soaked in 10 mL 90 % ace-tone for 12 h and extracts analysed fluorometrically using a Trilogy Turner fluorometer calibrated against pure chlorophyllastandards (Sigma).
2.5 Microscopy 10
Seawater samples were collected from 5 depths (97, 55, 33, 14, 1 % sPAR) during pre-dawn CTD casts. Samples were immediately fixed in acid-Lugol’s iodine solution (2 % final concentration). Where possible cells were identified to species-level accord-ing to the published literature and assigned to three functional groups (diatoms (cen-tric & pennate), dinoflagellates, flagellates). Cells were enumerated and expressed as
15
cells mL−1.
2.6 Inorganic nutrients
Seawater samples were collected from a range of depths during pre-dawn CTD casts into cleaned, acid-washed, and “aged” high density polyethylene sample bottles, us-ing clean handlus-ing and analysis procedures. Samples were analyzed immediately.
Ni-20
trate, nitrite, ammonium, phosphate and silicate were measured colorimetrically with a 5-channel segmented flow Bran and Luebbe AAIII autoanalyzer, using methods de-scribed previously (Woodward and Rees, 2001).
BGD
12, 17781–17816, 2015
Exportable production in the
Mauritanian upwelling
D. R. Clark et al.
Title Page
Abstract Introduction
Conclusions References
Tables Figures
◭ ◮
◭ ◮
Back Close
Full Screen / Esc
Printer-friendly Version Interactive Discussion
Discussion
P
a
per
|
Discussion
P
a
per
|
Discussion
P
a
per
|
Discussion
P
a
per
|
3 Results and discussion
The inert duel tracers SF6and 3
He (Nightingale et al., 2000) in combination with drifter buoys were used in this study so that filament progression and biological community development could be followed in lagrangian mode as the water mass advected off -shore (Fig. 1). The loss of tracers to the atmosphere, their dilution due to mixing with
5
unlabelled water and the detection limit of GC analysis constrained patch monitoring duration. A detailed description of filament dynamics forming off Cap Blanc, during this study is presented in Meunier et al. (2012). Both North and South Atlantic Central Water (NACW and SACW respectively) is upwelled in this region and the contribution to filaments from each source can be distinguished; SACW generally contains higher
10
nutrient concentrations and has higher temperature with lower oxygen and salinity. Op-timum parameter analysis (Rees et al., 2011) demonstrated that the filament studied was dominated by NACW (50–80 %). P1 was identified using a combination of
near-real time remotely sensed data and water column profiling. Following identification, observational measurements were undertaken and SF6/
3
He tracers were deployed at
15
a depth of 5 m in a square spiral (1.0 km×0.8 km) around a central drifting buoy. Tracers
were detected throughout the upper mixed layer depth of 50 m within 1 day of deploy-ment. Extensive mapping exercises were conducted to describe P1’s progression as
the water mass advected offshore in a south-westerly then westerly direction. Mapping enabled the patch centre to be located for daily observational measurements. During
20
this study, P1 remained tightly constrained for the first 3 days until the patch left the
continental shelf area and entered the upper slope and shelf break regions. During this latter stage enhanced vertical mixing due to increased water column depth combined with horizontal sheer associated with patch proximity to the northern edge of the fila-ment lead toP1elongation and dispersion. Eight days of lagrangian study was achieved
25
(hereafter referred to asT0 toT7; pre-patch observations are referred to as T−1), with
BGD
12, 17781–17816, 2015
Exportable production in the
Mauritanian upwelling
D. R. Clark et al.
Title Page
Abstract Introduction
Conclusions References
Tables Figures
◭ ◮
◭ ◮
Back Close
Full Screen / Esc
Printer-friendly Version Interactive Discussion
Discussion
P
a
per
|
Discussion
P
a
per
|
Discussion
P
a
per
|
Discussion
P
a
per
|
3.1 Description of the physical and chemical regime
Selected chemical, biological and physical characteristics of the water column are pre-sented in Figs. 2, 3 and 4. As P1 advected offshore its temperature increased from
≈16.4◦C onT−1to>17.6 ◦C byT7. Profiles of water column temperature demonstrated
changes in vertical structure as the mixed layer depth increased from approximately
5
50 m (T−1–T2) to 100 m coinciding with the continental shelf to shelf break transition
(T3, Loucaides et al., 2012). Nutrient concentrations in P1 were greatest during the
first day of lagrangian study and then progressively decreased (with the exception of NO−2). On average, NO−3 concentration decreased from 9.0±0.1 to 4.6±0.3 µmol L−1,
Si concentration decreased from 2.7±0.1 to 0.9±0.1 µmol L−1 and PO34−
concentra-10
tion decreased from 0.7±0.1 to 0.4±0.1 µmol L−1. The greatest decrease in nutrient
concentrations occurred on the continental shelf. Following advection over the shelf break, these nutrient concentrations continued to decrease albeit at a lower rate. By contrast, NO−2 concentration remained relatively stable for the duration of the study at 0.31±0.05 µmol L−1while a simple increasing or decrease trend in NH+4 concentration
15
was not evident; an average value of 0.8±0.23 µmol L−1was measured.
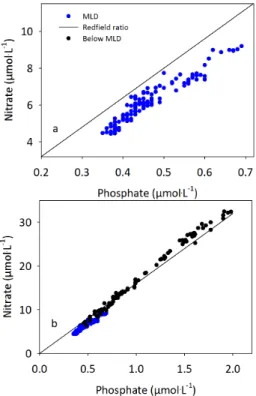
Nutrient stoichiometry of the upwelled P1 water mass indicated nitrogen deficiency
(Fig. 3); regression provided a N : P value of 13.9 : 1 compared to a value of 17.7 : 1 be-low the mixed layer (incorporating depths up to 1400 m). N : P ratios of 7.2–12.3 were reported in the Benguela upwelling system by Gregor and Monteiro (2013). These
20
authors identified denitrification and sulphate reduction as anoxic benthic processes leading to this deficiency, supported by Flohr et al. (2014) who suggested that the Namibian shelf’s mud belt is a region of continuous N loss and P efflux to the pelagic environment. In the Mauritanian upwelling system, interactions between upwelled wa-ters and sub-oxic conditions within the pelagic environment have been suggested in
25
modelling studies (Glessmer et al., 2009) and supported by biogeochemical evidence (Rees et al., 2011). Pelagic nitrification associated with oxygen minimum zones leads to a loss of N from this system in the form of N2O (Rees et al., 2011) and will have
BGD
12, 17781–17816, 2015
Exportable production in the
Mauritanian upwelling
D. R. Clark et al.
Title Page
Abstract Introduction
Conclusions References
Tables Figures
◭ ◮
◭ ◮
Back Close
Full Screen / Esc
Printer-friendly Version Interactive Discussion
Discussion
P
a
per
|
Discussion
P
a
per
|
Discussion
P
a
per
|
Discussion
P
a
per
|
contributed to the relative N-deficiency reported here. An average P1 phosphate
ex-cess (P*) of 72±18 nmol L−1indicated thatP1exported phosphate to the adjacent
olig-otrophic gyre of the North Atlantic. The magnitude of this export was less than the value of<300 nmol L−1reported for phosphate advection to the south Atlantic gyre by the Benguela upwelling system (Flohr et al., 2014). A P* decline towards zero would
5
be anticipated with offshore advection in support of N2fixation (Deutsch et al., 2007).
Analysis demonstrated that nutrient drawdown duringP1 progression was driven by
biological processes (Loucaides et al., 2012); factors such as horizontal and vertical mixing with low nutrient water masses derived from outside of the upwelled filament were unlikely to have made a significant contribution. However, an entrainment event
10
associated with increased mixed layer depth lead to a small but measurable recovery in nutrient concentrations duringT3–T4.
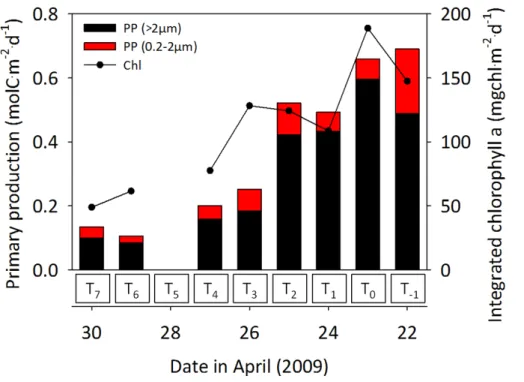
Nutrient drawdown supported high rates of primary production. Rates were mea-sured within the range 0.1–0.7 mol C m−2d−1 which exceeded that measured in other upwelling areas; values of 0.02–0.21 mol C m−2d−1 were reported for the Iberian
up-15
welling (Joint et al., 2001; Álvarez-Salgado et al., 2002; Arístegui et al., 2006), 0.01– 0.46 mol C m−2d−1 were reported for the Peruvian upwelling (Fernández et al., 2009), an average of 0.23 mol C m−2d−1 was reported for the Southern Benguela (Shannon and Field, 1985) and 0.07 mol C m−2d−1was reported for Californian Upwelling Ecosys-tems (Santoro et al., 2010). Results demonstrated that on average 80 % of this
produc-20
tivity was associated with the>2 µm size fraction.
In terms of distribution, the highest rates of primary productivity were associated with the continental shelf region, with rates decreasing as P1 advected over the shelf
break. This distribution was characteristic of the coastal northwest African region, with high biological productivity associated with the region of continental shelf influenced by
25
BGD
12, 17781–17816, 2015
Exportable production in the
Mauritanian upwelling
D. R. Clark et al.
Title Page
Abstract Introduction
Conclusions References
Tables Figures
◭ ◮
◭ ◮
Back Close
Full Screen / Esc
Printer-friendly Version Interactive Discussion
Discussion
P
a
per
|
Discussion
P
a
per
|
Discussion
P
a
per
|
Discussion
P
a
per
|
3.2 Phytoplankton composition and N-assimilation
Freshly upwelled water is extremely low in chlorophyll content and productivity, and would characteristically contain a NO−3 concentration in the range 9–15 µmol L−1 for this region (Arístegui et al., 2009, noting that P1’s composition of NACW and SACW
would place freshly upwelled water towards the upper end of this range). Consequently,
5
productivity had become established and decreased NO−3 by up to 6 µmol L−1prior to this study which followed the removal of a further 4 µmol L−1 of NO−
3. During P1
pro-gression, clear transitions in phytoplankton abundance, N-biomass and N-assimilation activity took place (Fig. 5). The highest abundance of all phytoplankton was measured during the first 3 days of lagrangian study (T0–T2). Although flagellates were
numeri-10
cally dominant, diatoms dominated carbon biomass (data not shown). Cell abundance decreased beyondT2although specific phytoplankton classes represented a consistent
proportion of total abundance suggesting that selective removal was not an important factor; for the duration of this study, diatoms represented 12.7±5.7 %, dinoflagellates
represented 0.10±0.02 %, flagellates represented 87.2±5.7 % of total cell abundance.
15
The trend of progressively diminishing phytoplankton abundance was reflected in the concentration of PON which decreased by 75 % within 8 days.
During this study, NH+4 assimilation was measured within the range 6.1– 32.8 nmol L−1h−1, while NO−3 assimilation was measured within the range 3.9– 43.8 nmol L−1h−1. There are relatively few studies of N-assimilation in the NW African
20
region against which to draw comparisons; NO−3 assimilation measured within the photic zone was reported in the range <0.2–31 nmol L−1h−1 (Varela et al., 2005; Dugdale et al., 1990) while NH+4 assimilation was reported in the range <0.2– 1.0 nmol L−1h−1 (Varela et al., 2005). The range in NO−3 assimilation was comparable with previous studies while NH+4 assimilation had a more prominent role in P1 than
25
previously reported. This is perhaps the most striking observation; that rates of NH+4 and NO−3 assimilation were broadly similar, despite the difference in N-source
BGD
12, 17781–17816, 2015
Exportable production in the
Mauritanian upwelling
D. R. Clark et al.
Title Page
Abstract Introduction
Conclusions References
Tables Figures
◭ ◮
◭ ◮
Back Close
Full Screen / Esc
Printer-friendly Version Interactive Discussion
Discussion
P
a
per
|
Discussion
P
a
per
|
Discussion
P
a
per
|
Discussion
P
a
per
|
ability. The average P1 NH+4 and NO−3 concentrations were 0.80±0.23 µmol L
−1
and 6.22±1.20 µmol L−1 respectively, differing by almost one order of magnitude. Results
underscore the importance of regenerated nitrogen in supporting phytoplankton nitro-gen requirements even from the early stages of upwelling and imply that this form of inorganic nitrogen was rapidly recycled. The significance of N regeneration in upwelling
5
regions has previously been highlighted for the Iberian, the Northern Benguela and Chilean upwelling systems (Clark et al., 2011; Fernandez and Farías, 2012; Benavides et al., 2014).
Within the conveyor belt scheme describing productivity cycles in upwelling systems (Wilkerson and Dugdale, 2008), the increase of phytoplankton growth in response to
10
favourable light and nutrient conditions (shift-up phase) is followed by a shift-down phase driven by factors such as sedimentation and grazing. Cycles last between five and seven days. The trend of progressively diminishing indicators of phytoplankton abundance and activity in combination with a calculated residence time within the photic zone of 3 days for upwelled water prior toT0 (Meunier et al., 2012; Loucaides
15
et al., 2012) suggested that the peak and shift-down stages of phytoplankton produc-tivity were investigated here. Contributory factors (excluding sedimentation and grazing for which we have no data) to the shift-down phase are discussed below.
In previous studies of upwelling regimes, inorganic nutrient availability has been iden-tified as a limiting resource driving changes in community structure and productivity
20
(Wilkerson and Dugdale, 2008). Nutrient limitation of larger cells, which dominated productivity in the present study, may have been a contributory factor. For example, the average N : Si ratio for the duration of P1 (4.49±0.78) indicated potential silicate
limitation of diatom growth (Brzezinski, 1985; Gilpin et al., 2004). However, relatively high nutrient concentrations were detected by the studies end and a shift in
commu-25
BGD
12, 17781–17816, 2015
Exportable production in the
Mauritanian upwelling
D. R. Clark et al.
Title Page
Abstract Introduction
Conclusions References
Tables Figures
◭ ◮
◭ ◮
Back Close
Full Screen / Esc
Printer-friendly Version Interactive Discussion
Discussion
P
a
per
|
Discussion
P
a
per
|
Discussion
P
a
per
|
Discussion
P
a
per
|
Light may be considered as a limiting resource; profiles of light intensity and optical depth diminish during the prolific growth of phytoplankton in surface waters; average daily light exposure for cells will also diminish during water column structure transi-tions as observed beyondT2where MLD exceeded the 1 % sPAR depth. Under these
circumstances, light limitation would be expressed as a preferential use of NH+4 over
5
NO−3 due to the differential energetic demands (Clark et al., 2002; Flynn et al., 2002). This was not observed duringT−1–T2. However, NH+4 assimilation rate consistently
ex-ceeded NO−3 assimilation beyondT3(the point at which MLD exceeded the 1 % sPAR
depth), potentially supporting this mechanism to describe a characteristic feature of N-assimilation by phytoplankton in upwelled water (Dickson and Wheeler, 1995; Kudela
10
et al., 1997) and contributing to the progressive decrease in indicators of phytoplankton activity and biomass.
3.3 The regeneration of inorganic nitrogen
Evidence presented here has demonstrated that the regeneration of inorganic nitrogen sustained phytoplankton productivity during P1 development. Nutrient regeneration is
15
a product of heterotrophic DOM degradation by microplankton (bacteria, flagellates, cil-iates), following its release from phytoplankton due to grazing or lysis. Alternative routes of NH+4 regeneration in upwelling systems such as the activity of zooplankton may rep-resent a minor contribution (Bode et al., 2004; Bronk and Steinberg, 2008; Fernández-Urruzola et al., 2014). During the present study, NH+4 was regenerated at rates within
20
the range 9.4–85.0 nmol L−1h−1 (Fig. 6). We are unaware of previous studies for the Mauritanian system with which to compare this data. For the Benguela system Probyn (1987, 1990) reported comparable rates within the range 0–125 nmol L−1h−1while Be-navides et al. (2014) reported rates in the range 90–130 nmol L−1h−1. For the less pro-ductive Iberian upwelling system rates of 0.09–2.52 nmol L−1
h−1
have been reported
25
(Clark et al., 2011). The highest rate of NH+4 regeneration was measured at T0,
co-inciding with the highest ambient ammonium concentration, elevated phytoplankton
BGD
12, 17781–17816, 2015
Exportable production in the
Mauritanian upwelling
D. R. Clark et al.
Title Page
Abstract Introduction
Conclusions References
Tables Figures
◭ ◮
◭ ◮
Back Close
Full Screen / Esc
Printer-friendly Version Interactive Discussion
Discussion
P
a
per
|
Discussion
P
a
per
|
Discussion
P
a
per
|
Discussion
P
a
per
|
abundance and productivity although a clear trend duringP1 progression was not
ap-parent given the limited data available (specifically the lack of data forT5−7;T5 due to challenging weather conditions andT6−7 due to sample loss). An NH+4 pool turnover
of 1.2±0.7 d−1 due to regeneration and a ratio of 1.7±1.1 for NH+4 regeneration to
assimilation rate demonstrated the rapidity of NH+4 recycling that was sufficient to meet
5
phytoplankton requirements.
An additional sink for regenerated NH+4 is the nitrification process. The sequential oxidation of NH+4 to NO−2 and NO−3 is known not to be restricted to aphotic depths (Clark et al., 2008, 2014) and has been reported in other upwelling systems (Clark et al., 2011; Fernandez and Farías, 2012; Benavides et al., 2014). On average, 20±
10
10 % of regenerated NH+4 entered the nitrification pathway. Rates of NH+4 and NO−2 oxidation were 0.30–8.75 and 25.55–81.11 nmol L−1h−1 respectively, resulting in an average turnover of 0.3±0.2 and 0.2±0.1 d−1for NO−2 and NO−3 respectively. We are
unaware of previous nitrification rate measurements for the Mauritanian system and as a general observation such measurements are rare for upwelling systems. For the
15
Benguela system, NO−
3regeneration rates of 0.6–15.5 nmol L
−1h−1have been reported (Füssel et al., 2011; Benavides et al., 2014). In the Iberian system, Clark et al. (2011) reported rates of 0.06–3.74 and 0.04–24.76 nmol L−1h−1 for NH+4 and NO−2 oxidation respectively.
The average coupling ratio (NH+4 : NO−2 oxidation rate) was 0.11±0.07, indicating that
20
these processes were substantively uncoupled; NO−2 oxidation rate exceeded NH+4 oxi-dation rate by several fold as previously reported (Lipschultz et al., 1990; Beman et al., 2010, 2013; Clark et al., 2011, 2014; Füssel et al., 2011; Fernandez and Farías, 2012). The extent of decoupling would imply that NO−2 oxidation was unsustainable, as NO−2 would be removed within 1 day at the prevailing NO−2 oxidation rates. However, a NO−2
25
concentration of≈0.3 µmol L−1persisted in the photic zone for the duration of the study
indicating an approximate balance between NO−2 production and consumption pro-cesses. Füssel et al. (2011) suggested that in suboxic environments NO−
BGD
12, 17781–17816, 2015
Exportable production in the
Mauritanian upwelling
D. R. Clark et al.
Title Page
Abstract Introduction
Conclusions References
Tables Figures
◭ ◮
◭ ◮
Back Close
Full Screen / Esc
Printer-friendly Version Interactive Discussion
Discussion
P
a
per
|
Discussion
P
a
per
|
Discussion
P
a
per
|
Discussion
P
a
per
|
via NO−3 reduction (the first stage of denitrification) could, in combination with NH+4 ox-idation, support the observed rates of NO−
2 oxidation. For the present study pelagic
oxygen concentrations exceeded 200 µmnol L−1 (results not shown) suggesting that denitrification was unlikely to be a significant NO−2 source. These observations could however be reconciled by a mechanism in which particle bound nitrifying organisms
5
existed in close physical and chemical association. Though not demonstrated in up-welling systems, diverse sources of evidence support this association (Ward, 2008). Via this mechanism the microbially mediated degradation of particulate organic matter would regenerate NH+4 directly supporting NH+4 oxidation; resultant NO−2 would support NO−
2 oxidation and regenerated NO−3 would be released from particles. In contrast,
10
neither NH+4 nor NO−2 would be released from particles to an extent that reflected the stoichiometric rate relationships (potentially contributing to the persistent budgetary “NH+4 deficit” previously identified in the Iberian upwelling study of Clark et al., 2011). If such a mechanism were to operate, specific tracer methods would underestimate N-regeneration rates (specifically NH+4 regeneration and oxidation rates) in ecosystems
15
characteristically enriched in newly formed marine particles. If this were the case, the extent of decoupling would imply that the substantial majority of nitrification withinP1
was associated with particles. It is unlikely that the micro-environment of marine par-ticles reflects that of bulk water, offering a rationale for our inability to establish robust relationships between environmental factors and nitrification rates beyond light
inhibi-20
tion, which has limited model development (Bouskill et al., 2011; Füssel et al., 2011; Smith et al., 2014a). Additionally, should such a mechanism operate, particle bound nitrifying organisms would be alleviated to an extent from direct competition with phy-toplankton for NH+4 (Smith et al., 2014b).
3.4 F ratio formulations 25
The present study demonstrated that nitrification was measurable from the inception of
P1 implying that the fraction of regenerated NO−3 progressively increased within days
BGD
12, 17781–17816, 2015
Exportable production in the
Mauritanian upwelling
D. R. Clark et al.
Title Page
Abstract Introduction
Conclusions References
Tables Figures
◭ ◮
◭ ◮
Back Close
Full Screen / Esc
Printer-friendly Version Interactive Discussion
Discussion
P
a
per
|
Discussion
P
a
per
|
Discussion
P
a
per
|
Discussion
P
a
per
|
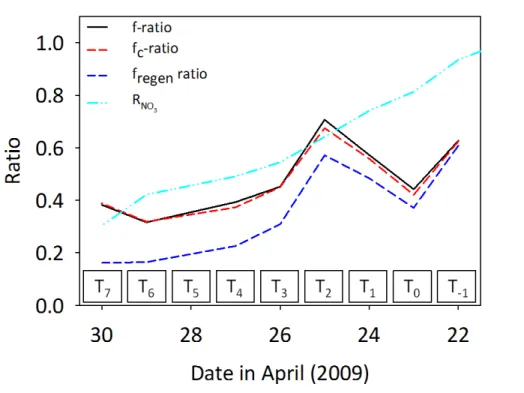
of freshly upwelled water reaching the photic zone.f ratio formulations forP1 are
pre-sented in Fig. 7 using simultaneously measured rates of N-assimilation and regenera-tion. Using the original formulation, the highestf ratio values were derived during the first 3 days of lagrangian study, generally decreasing asP1advected offshore.
Correct-ingf ratio values for isotope dilution (fc ratio) made only minor differences. However,
5
accounting for the fraction of regenerated NO−3 (in addition to isotope dilution;fregen
ra-tio) lead to a cumulative decrease in values relative to the original formulation. Results implied that within≈6 days, the fraction of regenerated NO−3 was greater than 50 %
and that the transition from “new” to a “regenerated” NO−3 pool occurred rapidly (i.e. the order of days, not weeks). Given the evidence for nitrification in other upwelling
10
systems (Ward, 2005; Fernández et al., 2009; Clark et al., 2011; Benavides et al., 2014), it is likely that NO−3 based exportable production from such systems has been over-estimated historically.
3.5 Calculating the carbon export ofP1
Carbon export supported by new production was estimated using the approach of
Epp-15
ley and Peterson (1979) as the product off ratio and primary production. We compared the original formulation (f ratio) to alternative formulations;fc ratios (corrected for iso-tope dilution) andfregenratio (corrected for isotope dilution and regenerated NO−3).
Rees et al. (2011) estimated that the time taken for P1 to mature from
newly-upwelled to open ocean conditions was approximately 14 days, which we confirmed
20
by extrapolation of integrated primary production rates along an exponential gradient (PP=801.72e−0.253 Time,r2=0.93). Rates decreased from 0.69 mol C m−2d−1(T−1) to
approximately 0.02 mol C m−2d−1on day 14, comparable to rates reported for the olig-otrophic north east Atlantic (Tilstone et al., 2009). The mean area ofP1was estimated
from surface sea temperature images at 1.29×10⁴km2 while upwelling activity
char-25
produc-BGD
12, 17781–17816, 2015
Exportable production in the
Mauritanian upwelling
D. R. Clark et al.
Title Page
Abstract Introduction
Conclusions References
Tables Figures
◭ ◮
◭ ◮
Back Close
Full Screen / Esc
Printer-friendly Version Interactive Discussion
Discussion
P
a
per
|
Discussion
P
a
per
|
Discussion
P
a
per
|
Discussion
P
a
per
|
tion measured during P1 over 12 months. By integrating primary production over the
14 day period between maximum upwelling and open-ocean conditions and extrapolat-ing to the mean filament area we estimated annual primary production of 12.38 Tg C. The fraction of annual productivity available for export derived using the f ratio was 6.19 Tg C (50 %); using the fc ratio was 6.01 Tg C (49 %); using the fregen ratio was
5
4.73 Tg C (38 %). Comparisons with previous estimations are complicated by diff er-ences in filament location, geographical area, activity, and integration depth, rang-ing from 1.12–2.62 Tg C y−1 (Helmke et al., 2005) to 3.1 Tg C y−1 (Álvarez-Salgado et al., 2007), which are of similar order to our fregen ratio estimates. Within the
con-straints of our assumptions, results suggest that both isotope dilution and the fraction
10
of previously regenerated NO−
3 can be important sources of error for N-based
estima-tions of C-export.
4 Conclusions
For open ocean systems, the limitation to the new production paradigm that NO−
3 is
not necessarily “new” is now well established; to this we add that even within upwelling
15
regions where genuinely new NO−3 is supplied to the photic zone, the fraction of regen-erated NO−
3 increases rapidly. Since the instantaneous ratio of new to regenerated NO−3
cannot readily be derived this adds uncertainty tof ratio values. Upwelling zones are unquestionably highly productive. However, our data indicate that nitrification in these waters is significant and impacts uponf ratio derived estimations of new production
20
and carbon export.
Acknowledgements. We thank Carol Robinson (chief scientist), Ricardo Torres and
Phil Nightingale for cruise leadership and SF6mapping, and the officers and crew of the RRS Discovery cruise D338. We also thank Lisa Al-Moosawi for isotope ratio mass-spectrometry analysis. This study was supported by NERC grant NE/C517176/1 (UK-SOLAS) and by 25
Theme 2 of NERC Oceans 2025.
BGD
12, 17781–17816, 2015
Exportable production in the
Mauritanian upwelling
D. R. Clark et al.
Title Page
Abstract Introduction
Conclusions References
Tables Figures
◭ ◮
◭ ◮
Back Close
Full Screen / Esc
Printer-friendly Version Interactive Discussion
Discussion
P
a
per
|
Discussion
P
a
per
|
Discussion
P
a
per
|
Discussion
P
a
per
|
References
Álvarez-Salgado, X. A., Beloso, S., Joint, I., Nogueira, E., Chou, L., Perez, F. F., Groom, S., Cabanas, J. M., Rees, A. P., and Elskens, M.: New production of the NW Iberian shelf during the upwelling season over the period 1982–1999, Deep-Sea Res. Pt. I, 49, 1725–1739, doi:10.1016/S0967-0637(02)00094-8, 2002.
5
Álvarez-Salgado, X. A., Arístegui, J., Barton, E. D., and Hansell, D. A.: Contribution of up-welling filaments to offshore carbon export in the subtropical Northeast Atlantic Ocean, Lim-nol. Oceanogr., 52, 1287–1292, doi:10.4319/lo.2007.52.3.12872007, 2007.
Arístegui, J., Álvarez-Salgado, X. A., Barton, E. D., Figueiras, F. G., Hernández-León, S., Roy, C., and Santos, A. M. P.: Oceanography and fisheries of the Canary Current Iberian 10
region of the Eastern North Atlantic, in: The global coastal ocean: Interdisciplinary regional studies and syntheses, edited by: Robinson, A., and Bronk, K. H., Harvard University Press, Cambridge, USA, 877–931, 2006.
Arístegui, J., Barton, E. D., Álvarez-Salgado, X. A., Santos, M. P., Figueiras, F. G., Ki-fani, S., Hernández-León, S., Mason, E., Machú, E., and Demarcq, H.: Sub-regional 15
ecosystem variability in the Canary Current upwelling, Prog. Oceanogr., 83, 33–43, 2009, doi:10.1016/j.pocean.2009.07.031, 2009.
Beman, J. M., Sachdeva, R., and Fuhrman, J. A.: Population ecology of nitrifying Ar-chaea and bacteria in the Southern California Bight, Environ. Microbiol., 12, 1282–1292, doi:10.1111/j.1462-2920.2010.02172.x, 2010.
20
Beman, J. M., Shih, J. L., and Popp, B. N.: Nitrite oxidation in the upper water column and oxygen minimum zone of the eastern tropical North Pacific Ocean, Int. Soc. Micro. Ecol., 7, 2192–2205, doi:10.1038/ismej.2013.96, 2013.
Benavides, M., Santana-Falcón Y., Wasmund, N., and Arístegui, J.: Microbial uptake and re-generation of inorganic nitrogen offthe coastal Namibian upwelling system, J. Marine Syst., 25
140, 123–129, doi:10.1016/j.jmarsys.2014.05.002, 2014.
Blackburn, T. H.: Method for measuring rates of NH+4 turnover in anoxic marine sediments, using15N-NH+4 dilution technique, Appl. Environ. Microb., 37, 760–765, 1979.
Bronk, D. A. and Steinberg, D. K.: Nitrogen Regeneration, in: Nitrogen in the Marine Environ-ment, edited by: Capone, D., Bronk, D. A., Mulholland, M. R., and Carpenter, E. J., Elsevier 30
BGD
12, 17781–17816, 2015
Exportable production in the
Mauritanian upwelling
D. R. Clark et al.
Title Page
Abstract Introduction
Conclusions References
Tables Figures
◭ ◮
◭ ◮
Back Close
Full Screen / Esc
Printer-friendly Version Interactive Discussion
Discussion
P
a
per
|
Discussion
P
a
per
|
Discussion
P
a
per
|
Discussion
P
a
per
|
Brzezinski, M. A.: The Si-C-N ratio of marine diatoms – interspecific variability and the effect of some environmental variables, J. Phycol., 21, 347–357, doi:10.1111/j.0022-3646.1985.00347.x, 1985.
Bode, A., Barquero, S., Gonzalez, N., Alvarez-Ossorio, M. T., and Varela, M.: Contribution of heterotrophic plankton to nitrogen regeneration in the upwelling ecosystem of A Coruña (NW 5
Spain), J. Plankton Res., 26, 11–28, doi:10.1093/plankt/fbh003, 2004.
Bouskill, N. J., Eveillard, D., Chien, D., Jayakumar, A., and Ward, B. B.: Environmental factors determining ammonia-oxidizing organism distribution and diversity in marine environments, Environ. Microbiol, 14, 714–729, doi:10.1111/j.1462-2920.2011.02623.x, 2011.
Caperon, J., Schell, D., Hirota, J., and Laws, E.: Ammonium excretion rates in Kaneohe 10
Bay, Hawaii, measured by a 15N isotope dilution technique, Mar. Biol., 54, 33–40, doi:10.1007/BF00387049, 1979.
Chavez, F. and Messié, M.: A comparison of Eastern Boundary Upwelling Ecosystems, Prog. Oceanogr., 83, 80–96, doi:10.1016/jpocean.2009.07.32, 2009.
Clark, D. R., Flynn, K. J., and Owens, N. J. P.: The large capacity for dark nitrate-assimilation 15
in diatoms may overcome nitrate limitation of growth, New Phytol., doi:10.1046/j.1469-8137.2002.00435.x, 155, 101–108, 2002.
Clark, D. R., Fileman, T. W., and Joint, I.: Determination of ammonium regeneration rates in the oligotrophic ocean by gas chromatography/mass spectrometry, Mar. Chem., 98, 121–130, doi:10.1016/j.marchem.2005.08.006, 2006.
20
Clark, D. R., Rees, A. P., and Joint, I.: A method for the determination of nitrification rates in oligotrophic marine seawater by gas chromatography/mass spectrometry, Mar. Chem., 103, 84–96, doi:10.1016/j.marchem.2006.06.005, 2007.
Clark, D. R., Rees, A. P., and Joint, I.: Ammonium regeneration and nitrification rates in the oligotrophic Atlantic Ocean: implications for new production estimates, Limnol. Oceanogr., 25
53, 52–62, doi:10.4319/lo.2008.53.1.0052, 2008.
Clark, D. R., Miller, P. I., Woodward, E. M. S., and Rees, A. P.: Inorganic nitrogen assimilation and regeneration in the coastal upwelling region of the Iberian Peninsula, Limnol. Oceanogr., 56, 1689–1702, doi:10.4319/lo.2011.56.5.1689, 2011.
Clark, D. R., Brown, I. J., Rees, A. P., Somerfield, P. J., and Miller, P. I.: The influence of ocean 30
acidification on nitrogen regeneration and nitrous oxide production in the northwest European shelf sea, Biogeosciences, 11, 4985–5005, doi:10.5194/bg-11-4985-2014, 2014.
BGD
12, 17781–17816, 2015
Exportable production in the
Mauritanian upwelling
D. R. Clark et al.
Title Page
Abstract Introduction
Conclusions References
Tables Figures
◭ ◮
◭ ◮
Back Close
Full Screen / Esc
Printer-friendly Version Interactive Discussion
Discussion
P
a
per
|
Discussion
P
a
per
|
Discussion
P
a
per
|
Discussion
P
a
per
|
D’Asaro, E. A.: Lagrangian trajectories on the Oregon shelf during upwelling, Cont. Shelf Res., 24, 1421–1436, doi:10.1016/j.csr.2004.06.003, 2004.
Dickson, M. L. and Wheeler, P. A.: Nitrate uptake rates in a coastal upwelling regime – A com-parison of PN-specific, absolute and chl a-specific rates, Limnol. Oceanogr., 40, 533–543, doi:10.4319/lo.1995.40.3.0533, 1995.
5
Deutsch, C., Sarmiento, J. L., Sigman, D. M., Gruber, N., and Dunne, J. P.: Spatial coupling of nitrogen inputs and losses in the ocean, Nature, 445, 163–167, doi:10.1038/nature05392, 2007.
Dugdale, R. C. and Goering, J. J.: Uptake of new and regenerated forms of nitrogen in primary productivity, Limnol. Oceanogr., 12, 196–206, doi:10.4319/lo.1967.12.2.0196, 1967.
10
Dugdale, R. C., Wilkerson, F. P., and Morel, A.: Realization of new production in coastal up-welling areas: a means to compare relative performance, Limnol. Oceanogr., 35, 822–829, doi:10.4319/lo.1990.35.4.0822, 1990.
Eppley, R. W. and Peterson, B. J.: Particulate organic matter flux and planktonic new production in the deep ocean, Nature, 282, 677–680, doi:10.1038/282677a0, 1979.
15
Fernandez, C. and Farías, L.: Assimilation and regeneration of inorganic nitrogen in a coastal upwelling system: ammonium and nitrate utilisation, Mar. Ecol.-Prog. Ser., 451, 1–14, doi:10.3354/meps09683, 2012.
Fernández, C., Raimbault, P., Garcia, N., and Rimmelin, P.: An estimation of annual new pro-duction and carbon fluxes in the northeast Atlantic Ocean during, 2001, J. Geophys. Res., 20
110, C07S13, doi:10.1029/2004JC002616, 2005.
Fernández, C., Farías, L., and Alcaman, M. E.: Primary production and nitrogen regeneration processes in surface waters of the Peruvian upwelling system, Prog. Oceanogr., 83, 159– 168, doi:10.1016/j.pocean.2009.07.010, 2009.
Fernández, I. C. and Raimbault, P.: Nitrogen regeneration in the NE Atlantic Ocean and its 25
impact on seasonal new, regenerated and export production, Mar. Ecol.-Prog. Ser., 337, 79–92, doi:10.3354/meps337079, 2007.
Fernández-Urruzola, I., Osma, N., Packard, T. T., Gómez, M., and Postel, L.: Distribution of zoo-plankton biomass and potential metabolic activities across the northern Benguela upwelling system, J. Marine Syst., 140, 138–149, doi:10.1016/j.jmarsys.2014.05.009, 2014.
30