BGD
7, 8663–8697, 2010Sources of short-lived bromocarbons
S. Raimund et al.
Title Page
Abstract Introduction
Conclusions References
Tables Figures
◭ ◮
◭ ◮
Back Close
Full Screen / Esc
Printer-friendly Version
Interactive Discussion
Discussion
P
a
per
|
Dis
cussion
P
a
per
|
Discussion
P
a
per
|
Discussio
n
P
a
per
|
Biogeosciences Discuss., 7, 8663–8697, 2010 www.biogeosciences-discuss.net/7/8663/2010/ doi:10.5194/bgd-7-8663-2010
© Author(s) 2010. CC Attribution 3.0 License.
Biogeosciences Discussions
This discussion paper is/has been under review for the journal Biogeosciences (BG). Please refer to the corresponding final paper in BG if available.
Sources of short-lived bromocarbons in
the Iberian upwelling system
S. Raimund1, B. Quack2, Y. Bozec1, M. Vernet1, V. Rossi3, V. Garc¸on3, Y. Morel4, and P. Morin1
1
CNRS-UPMC Univ Paris 06, UMR 7144, Adaptation et Diversit ´e en Milieu Marin, Equipe Chimie Marine, Station Biologique de Roscoff, 29682 Roscoff, France
2
Leibniz Institute of Marine Sciences, IFM-GEOMAR, Kiel, Germany
3
Laboratoire d’Etudes en Geophysique et Oceanographie Spatiales, CNRS, Toulouse, France
4
Service Hydrographique et Oc ´eanographique de la Marine, (SHOM), Toulouse, France Received: 5 November 2010 – Accepted: 22 November 2010 – Published: 30 November 2010 Correspondence to: S. Raimund (raimund@sb-roscoff.fr)
BGD
7, 8663–8697, 2010Sources of short-lived bromocarbons
S. Raimund et al.
Title Page
Abstract Introduction
Conclusions References
Tables Figures
◭ ◮
◭ ◮
Back Close
Full Screen / Esc
Printer-friendly Version
Interactive Discussion
Discussion
P
a
per
|
Dis
cussion
P
a
per
|
Discussion
P
a
per
|
Discussio
n
P
a
per
|
Abstract
Seawater concentrations of the four brominated trace gases dibromomethane (CH2Br2), bromodichloromethane (CHBrCl2), dibromochloromethane (CHBr2Cl) and bromoform (CHBr3) were measured at different depths of the water column in the Iberian upwelling off Portugal during summer 2007. Bromocarbon concentrations 5
showed elevated values in recently upwelled and aged upwelled waters (mean val-ues of 30 pmol L−1for CHBr
3), while values in the open ocean were significantly lower (7.4 pmol L−1
for CHBr3). Correlations with biological variables and marker pigments indicated that phytoplankton could be identified as a weak bromocarbon source in the open ocean. In upwelled water masses along the coast, halocarbons were not corre-10
lated to Chl-a, indicating an external source, overlapping the possible internal produc-tion by phytoplankton. We showed that the tidal frequency had a significant influence on halocarbon concentrations in the upwelling and we linked those findings to a strong intertidal coastal source, as well as to a transport of those halocarbon enriched coastal waters by westward surface upwelling currents. Coastal sources and transport can be 15
accounted for maximum values of up to 185.1 pmol L−1CHBr
3in the upwelling.
Comparison with other productive marine areas revealed that the Iberian upwelling had stronger halocarbon sources than the phytoplankton dominated sources in the Mauritanian upwelling. However, the concentrations off the Iberian Peninsula were still much lower than those of coastal macroalgal influenced waters or those of polar 20
regions dominated by cold water adapted diatoms.
1 Introduction
Oceans deliver short lived bromocarbons such as dibromomethane (CH2Br2), bro-modichloromethane (CHBrCl2), dibromochloromethane (CHBr2Cl) and bromoform (CHBr3) via exchange processes from the marine boundary layer to the atmo-25
BGD
7, 8663–8697, 2010Sources of short-lived bromocarbons
S. Raimund et al.
Title Page
Abstract Introduction
Conclusions References
Tables Figures
◭ ◮
◭ ◮
Back Close
Full Screen / Esc
Printer-friendly Version
Interactive Discussion
Discussion
P
a
per
|
Dis
cussion
P
a
per
|
Discussion
P
a
per
|
Discussio
n
P
a
per
|
concentrations and affects both tropospheric and stratospheric chemistry and has im-plications on the climate (Law and Sturges, 2006). In the troposphere, bromine in-fluences the NO/NO2 cycle, stimulates the catalytic ozone depletion cycles and influ-ences the lifetimes of other trace gases (Read et al., 2008; von Glasow et al., 2004). Rapid deep convection can transport bromocarbons to the lower stratosphere and may 5
contribute to 20–60% of stratospheric bromine and consequently contribute to ozone depletion there (Salawitch et al., 2005). Macroalgae and phytoplankton are the main sources for oceanic bromocarbons (Manley et al., 1992; Moore et al., 1996; Carpen-ter and Liss, 2000; Butler et al., 2007) and cause – depending on algae growth and species composition – high spatial and temporal variances (Carpenter et al., 2005) of 10
the global halocarbon distribution. An important biological production pathway of poly-halogenated alkanes involves the catalysis by haloperoxidases (Leblanc et al., 2006) – an enzyme found both in macroalgae and phytoplankton – but the biological purpose of these reactions still remains unclear. Besides natural sources, anthropogenic dis-charge contribute as a significant additional halocarbon source in some coastal areas 15
(Quack and Wallace, 2003). Although a wide range of marine regions were investi-gated for aqueous bromocarbons, only a few studies focused on the highly productive and phytoplankton dominated upwelling regions. In laboratory experiments (Moore et al., 1996) and field campaigns (Hughes et al., 2009) haloperoxidases containing phy-toplankton species were accounted for elevated halocarbon concentrations. Hence it 20
was assumed that upwelling regions were important ecosystems for the global bro-mocarbon production. In this work we present seawater concentrations of CH2Br2, CHBrCl2, CHBr2Cl and CHBr3 studied during late summer 2007 along the coast off
BGD
7, 8663–8697, 2010Sources of short-lived bromocarbons
S. Raimund et al.
Title Page
Abstract Introduction
Conclusions References
Tables Figures
◭ ◮
◭ ◮
Back Close
Full Screen / Esc
Printer-friendly Version
Interactive Discussion
Discussion
P
a
per
|
Dis
cussion
P
a
per
|
Discussion
P
a
per
|
Discussio
n
P
a
per
|
2 Methods
2.1 Sampling and study area
During summer 2007 (11 August to 14 September), we investigated halocarbon dis-tributions in the Iberian peninsula upwelling system along the coast off Portugal on-board the French research vesselPourquoi pas? during the MOUTON (Mod ´elisation 5
oc ´eanique d’un th ´e ˆatre d’op ´erations navales) campaign. Samples were taken at 69 CTD stations along three different transects. Additional samples were taken during four daily cycles at four fixed stations (Fig. 1) with a 12-bottle CTD rosette (10-L-Niskin bottles). At each station, up to five samples were collected in the water column: sur-face, upper thermocline, maximum of chlorophyll, lower thermocline and bottom depth. 10
Samples were taken to determine bromocarbon concentrations, pigment composition and nutrientconcentrations. Meteorological conditions and bio-physical data from this cruise are discussed in details by Rossi et al. (2010a).
The study area extended from 39.1 to 42.8◦N and 8.9 to 11.1◦W within the Iberian
peninsula upwelling system, which is the northern extent of the wind driven Canary 15
upwelling (eastern boundary upwelling systems). The Iberian peninsula upwelling sys-tem ranges from about 36◦N to about 46◦N and from the Iberian coast to roughly
24◦W (Perez et al., 2001). During summer north/northwesterly tradewinds create a
southward flow, which generates an offshore Ekman transport. The Ekman transport is responsible for the upwellingof cold and nutrient enriched waters from 100–300 m 20
depth to the surface along the coastline (Smyth et al., 2001). Upwelling events are usually strongest in the north of the Iberian peninsula upwelling system (offCap Finis-terre) and are often related to westward flowing advection. These so called filaments are bands of cold and fresher waters which can reach as far as 100 km westward (Coelho et al., 2002).
BGD
7, 8663–8697, 2010Sources of short-lived bromocarbons
S. Raimund et al.
Title Page
Abstract Introduction
Conclusions References
Tables Figures
◭ ◮
◭ ◮
Back Close
Full Screen / Esc
Printer-friendly Version
Interactive Discussion
Discussion
P
a
per
|
Dis
cussion
P
a
per
|
Discussion
P
a
per
|
Discussio
n
P
a
per
|
2.2 Environmental variables
Environmental variables were recorded in the water column by a CTD rosette, as well simultaneously in the air by meteorological sensors of the vessel. Oxygen values were calibrated by independent sampling from discrete samples analyzed by Winkler titration. Pigments were analysed with the HPLC technique described by Wright et 5
al. (1991), using a HPLC system (THERMO spectrasystem) equipped with a C18 (CLI) inverse column. One liter of sample was filtered at 200 MPa onto a 25 mm GF/F filter. Filters were stored at−196◦C in liquid nitrogen. Extraction of pigments was conducted
with cold methanol (−20◦C) for 12 h. Pigments identification and quantification was
done by comparing retention times and peak areas and adsorption spectra obtained 10
using certified standard solutions from DHI Group, Denmark.
Samples for nutrient analysis were taken in 125 ml polyethylene bottles, pre-treated with hydrochloric acid and deionised water, and finally rinsed with the sea water before sampling. Samples were stored at−20◦C in darkness until the analysis was carried
out. A semi-automated system (Bran & Luebbe, Autoanalyser II) was used to deter-15
mine silicic acid (Si(OH)4, nitrate (NO−
3) and phosphate( PO 3−
4 ).
2.3 Analysis of volatiles
Bromocarbons were analysed using a purge-and-trap technique and GC-ECD (Chrompack CP 9000) modified after Pruvost et al. (1999). The purge-and-trap-loop was altered and Valco valves were replaced by highly saltwater resistant Swagelok 20
models. Sampling devices were modified according to Bulsiewicz et al. (1998). These new sampling devices (30 ml) were highly gastight and enable a straightforward con-nection to the Niskin bottle and to the purge-and-trap-loop respectively via Swagelok miniature quick connectors. The connector between the Niskin-bottle and sampling device comprises a filter element with 15 µm pore size, to remove larger particles. 25
Samples were stored in the dark at 4◦C and finally analyzed within four hours after
BGD
7, 8663–8697, 2010Sources of short-lived bromocarbons
S. Raimund et al.
Title Page
Abstract Introduction
Conclusions References
Tables Figures
◭ ◮
◭ ◮
Back Close
Full Screen / Esc
Printer-friendly Version
Interactive Discussion
Discussion
P
a
per
|
Dis
cussion
P
a
per
|
Discussion
P
a
per
|
Discussio
n
P
a
per
|
flow of 90 ml min−1. Purging took place at ambient temperature in a purge chamber,
which contained a glass frit (Pyrex 4). The gas flow was dried downstream using a con-denser (held at 2◦C) and a magnesium perchlorate trap. Volatiles were concentrated
in a stainless steel capillary tube (150 cm) at−78◦C and subsequently injected into a
gas chromatographic column by thermodesorption (100◦C, backflush). Separation of
5
the compounds was performed using a capillary column (fused silica megabore DB-624, 75 m, 0.53 mm id, 3 mm film thickness, J & W Scientific, flow: 6 ml min−1ultra pure
nitrogen) and a temperature program (10 min at 70◦C, rising for 8 min to 150◦C and
stable for 7 min at 150◦C). Quantification of volatiles was performed by external liquid
standards (AccuStandard and Carlo Erba). Liquid standards were diluted in seawater 10
and treated like a normal sample.
2.4 Statistics
Cluster analysis (k-means algorithm) of the data set revealed that SST forms three distinct clusters, which were used to separate the water masses. We defined the re-cently upwelled water mass with sampling stations showing a SST between 13.5◦C
15
and 15.2◦C. These stations were close to the coast of the Iberian Peninsula. The
aged upwelled water mass corresponds to stations with a SST between 15.5◦C and
17.7◦C. Those stations were located either close to the coast line or in the filament.
The open ocean water mass featured a SST ranging between 18.1◦C and 20.8◦C. All
these stations were located far offthe Iberian coast. The three SST clusters were con-20
BGD
7, 8663–8697, 2010Sources of short-lived bromocarbons
S. Raimund et al.
Title Page
Abstract Introduction
Conclusions References
Tables Figures
◭ ◮
◭ ◮
Back Close
Full Screen / Esc
Printer-friendly Version
Interactive Discussion
Discussion
P
a
per
|
Dis
cussion
P
a
per
|
Discussion
P
a
per
|
Discussio
n
P
a
per
|
3 Results
3.1 Upwelling during the campaign
The distribution of halocarbons in the Iberian peninsula upwelling system was one of the research topics of the MOUTON campaign in 2007. Water samples were taken in the upper 200 m of the water column along a north-to-south transect within the up-5
welling and along gradients from the coast to the open ocean. The sampling strat-egy was designed in due consideration of multidisciplinary interests, studying spatial and temporal variability of biological, physical and geochemical processes in the area. On board, satellite images were obtained for sea surface temperature (SST) and
Chl-a concentration from the Moderate Resolution Imaging Spectroradiometer (MODIS 10
aboard the NASAAqua satellite). Those images were used for adjustment of the sam-pling strategy. In general, both Chl-aconcentration- and SST-images indicated a pro-ceeding upwelling and phytoplankton bloom with high daily variability along the coast offPortugal during all the campaign.
In order to describe the dynamics in the Iberian upwelling, we present the SST and 15
Chl-adistributions, from satellite images taken on 19 August (Fig. 2). The SST-image shows clear upwelling in the studied area (Fig. 2a). Distinctive upwelling took place along the Iberian Peninsula from Cap Finisterre to 37◦N with a larger intensity between
40◦N and 42◦N. A clear temperature gradient was visible from the open ocean (>18◦C)
towards the coast (<15◦C). Pronounced cold water filaments occurred at 38◦N, 40◦N
20
and 42◦N, which showed significant temperature gradients with the surrounding water
masses. These mesoscale structures (typical lifetime of a week) are created by ad-vection processes and transport nutrient enriched cold water masses at the surface from the Iberian coast towards the open ocean. The Chl-a satellite images indicated elevated phytoplankton biomass along the Iberian Peninsula (Fig. 2b). Concentrations 25
were highest near the coastline (above 2 mg m−3) and two orders of magnitude lower in
BGD
7, 8663–8697, 2010Sources of short-lived bromocarbons
S. Raimund et al.
Title Page
Abstract Introduction
Conclusions References
Tables Figures
◭ ◮
◭ ◮
Back Close
Full Screen / Esc
Printer-friendly Version
Interactive Discussion
Discussion
P
a
per
|
Dis
cussion
P
a
per
|
Discussion
P
a
per
|
Discussio
n
P
a
per
|
although wind velocity decreased (less than 10 m s−1) and sea surface temperatures
increased by several degrees along the coast.
The campaign started with a north-to-south track (Fig. 1), which followed the 100 m bottom depth isoline and was located within a zone of intense upwelling (14 to 17 Au-gust). This track was chosen to investigate the halocarbon concentrations dynamics 5
within the maximum of phytoplankton density. A second transect (west-to-east track, Fig. 1) was performed along the 40◦N latitude from the open ocean towards the
up-welling (24 to 25 August). This track was chosen to investigate differences between coastal influenced upwelled waters and nutrient depleted open ocean waters. A dis-tinct and newly developed offshore filament at 40.3◦N with low SST values and high
10
phytoplankton content was sampled from 6 to 9 September. Additionally, surface and depth samples were taken continuously at four stations (ST 1–4) during 30 h each: sta-tion 1 (40◦
N, 9.1◦
W; 18 to 19 August) and station 2 (41◦
N, 9◦
W; 20 to 21 August) were located in recently upwelled water masses. Station 4 (40.3◦N, 9.2◦W; 4 to 5
Septem-ber) was chosen to investigate aged upwelled water masses. Station 3 (41◦N, 10.5◦W;
15
22 to 23 August) was a reference point in the open ocean.
3.2 Spatial distribution
Dibromomethane (CH2Br2), bromodichloromethane (CHBrCl2), dibro-mochloromethane (CHBr2Cl) and bromoform (CHBr3) showed a very patchy dis-tribution in the studied area (Fig. 3). Distribution patterns of the four measured 20
brominated compounds were similar. Generally, concentrations were higher along the coast and lower in the open ocean as well as in the phytoplankton enriched cold water filaments. The highest coastal values were found between 41◦N and 42◦N and
around 39.5◦N. In these areas, surface concentrations were significantly elevated as
compared to adjacent sampling stations and reached up to 185.1 pmol L−1
for CHBr3, 25
60.4 pmol L−1for CH
2Br2, 17.5 pmol L− 1
for CHBr2Cl and 6.8 pmol L− 1
BGD
7, 8663–8697, 2010Sources of short-lived bromocarbons
S. Raimund et al.
Title Page
Abstract Introduction
Conclusions References
Tables Figures
◭ ◮
◭ ◮
Back Close
Full Screen / Esc
Printer-friendly Version
Interactive Discussion
Discussion
P
a
per
|
Dis
cussion
P
a
per
|
Discussion
P
a
per
|
Discussio
n
P
a
per
|
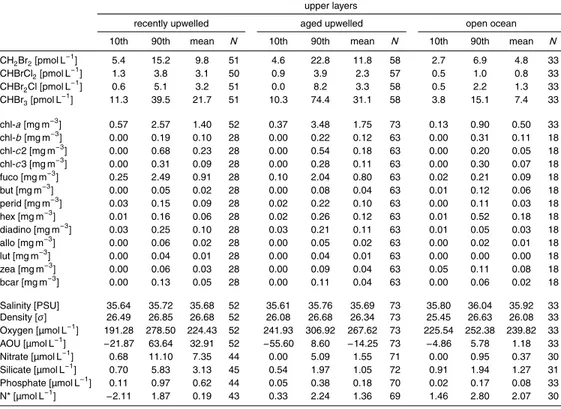
Cluster analysis of the data set revealed that SST forms three distinct clusters, which were used to classify different water masses (see methods). In order to evaluate pro-cesses in the biological active upper water layers, the clustered data set was additional divided into two groups (upper layers: surface to maximum of chlorophyll; lower lay-ers: below maximum of chlorophyll). Integrated values are presented in Table 1 for 5
bromocarbons and complementary variables. Salinity showed slightly lower values of about 35.7 in the upwelling (both recent and aged upwelling) and elevated values in the open ocean (35.9). In addition,nutrients showed a clear decreasing concentration gradient, from the recently upwelled water masses to aged upwelled water masses to open ocean water masses. As a result of the amplified nutrient supply, both upwelled 10
water masses feature higher pigment concentrations. For example, values for the di-atom marker fucoxanthin were one order of magnitude higher in recently and aged upwelled waters as compared to values in open ocean waters. The spatial distribu-tion of halocarbons in the biological active upper layers was characterized by a clear concentration gradient between both upwelled and open ocean water masses. Mean 15
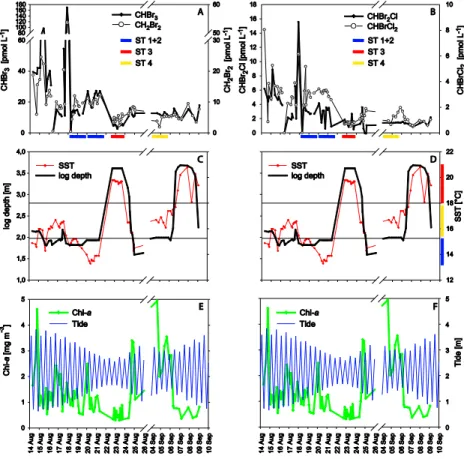
values were about 2 to 4.6 times lower in the open ocean as compared to upwelled wa-ters. The high variability of halocarbon concentrations during the campaign becomes obvious in Fig. 4, showing mean values of the upper water layers for bromocarbons, SST, bottom depth (reflecting roughly the distance to the coast), Chl-a concentration and tidal amplitude. Bromocarbon concentrations were highest during the first week of 20
the cruise, with significant elevated concentrations on the 15 to 17 August. The sam-pling site on the 15 August was located in the upwelling and influenced by the river plume discharge of the Minho and Douro, while the sampling site of the 17 August was in an active upwelling zone north of Lisbon. High bromocarbon concentrations were measured in recently and aged upwelled water masses, which are discernible by 25
BGD
7, 8663–8697, 2010Sources of short-lived bromocarbons
S. Raimund et al.
Title Page
Abstract Introduction
Conclusions References
Tables Figures
◭ ◮
◭ ◮
Back Close
Full Screen / Esc
Printer-friendly Version
Interactive Discussion
Discussion
P
a
per
|
Dis
cussion
P
a
per
|
Discussion
P
a
per
|
Discussio
n
P
a
per
|
especially when evaluating the long duration sampling stations 1–4, where measure-ments were conducted during a daily cycle. The temporal variability will be discussed in more details with statistical tools in Sect. 4.3.
3.3 Vertical distribution of brominated halocarbons and environmental
parameters
5
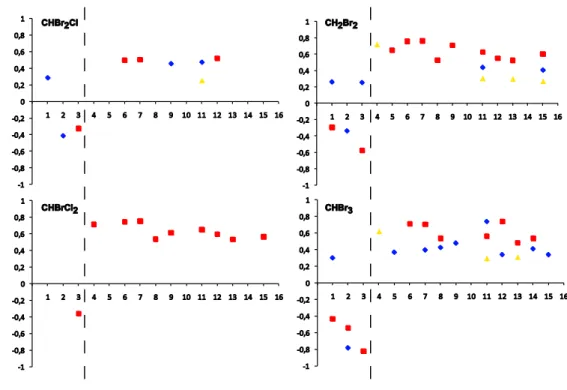
Concentrations of bromocarbons were generally elevated in the upper water layers (Ta-ble 1). Depth profiles of three representative stations – obtained during daily cycles – support this finding and provide a more detailed vertical resolution (Fig. 5). The vari-ables Chl-a, N* and AOU are presented to evaluate whether phytoplankton could be a source of bromocarbons: Chl-a, as a general marker for the occurrence of phytoplank-10
ton, the apparent oxygen utilisation (AOU), which is influenced by biological oxygen production (photosynthesis) or consumption (respiration), and the quasi-conservative tracer N* (introduced by Gruber and Sarmiento, 1997), which is a linear combination of nitrate and phosphate. Since stratification has consequences on chemical and bi-ological properties of the water column, density (σ) is the critical parameter for the 15
evaluation of the vertical distribution of these parameters.
At station 2 (in the recently upwelled water mass), density revealed an intense mix-ing in the first 15 m without a clear pycnocline (Fig. 5b). Chl-a values were higher in the upper 25 m (1.4 mg m−3
; Fig. 4a), followed by a moderate concentration gradi-ent towards lowest Chl-a values below 43 m. AOU values were negatively correlated 20
to Chl-a, with lowest values in the upper 25 m and high values in deep samples. N* displayed the same pattern as the AOU with a minimum in the upper 25 m (nitrate loss) followed by a clear gradient towards maximum values (nitrate production) below 43 m. The high Chl-avalues, low AOU and low N* values observed in the upper 25 m were indicative of oxygen production and nitrate uptake likely due to dominant pho-25
BGD
7, 8663–8697, 2010Sources of short-lived bromocarbons
S. Raimund et al.
Title Page
Abstract Introduction
Conclusions References
Tables Figures
◭ ◮
◭ ◮
Back Close
Full Screen / Esc
Printer-friendly Version
Interactive Discussion
Discussion
P
a
per
|
Dis
cussion
P
a
per
|
Discussion
P
a
per
|
Discussio
n
P
a
per
|
low levels with depth. Among the four bromocarbons CH2Br2 and CHBr3 showed a clear maximum at the depth of the Chl-amaximum. Daily variances of CHBr2Cl were high in comparison to the low concentration gradient between upper layer samples and lower layer samples.
At station 4 (in the aged upwelled water mass), the water column was stratified with 5
a marked gradient from the surface to 33 m depth (Fig. 5f). The highest total Chl-a
values for the Iberian upwelling were found in aged upwelled water masses (Fig. 4). At station 4, the highest Chl-avalues were recorded at 20 m, together with low N* values (nitrate loss) and negative AOU values (photosynthetic oxygen production). Although we found the highest bromocarbon concentrations in the aged upwelled water masses, 10
those values were restricted to only few sampling sites (Fig. 3). At station 4, bromo-carbon values were lower that average upwelling concentrations (Table 1), but showed a typical gradient with low values in the deeper levels. For instance, the highest CHBr3 concentrations at 20 m (12.4 pmol L−1
) were about three times higher than at 90 m but only the half of average upwelling concentrations (integrated in the upper layers). 15
At station 3 (in the open ocean), the water column was clearly stratified and showed a deep Chl-a maximum at 74 m (Fig. 5i–j). The pycnocline coincided with the highest phytoplankton density and activity (Chl-a maximum, N* minimum, low AOU; Fig. 5i–j). Bromocarbons concentrations were low compared to typical upwelling concentrations (Table 1). CHBr3 concentrations were highest at the Chl-a maximum (5.7 pmol L−
1 ) at 20
74 m. The highest concentrations of CH2Br2(5.3 pmol L− 1
) and CHBrCl2(0.9 pmol L− 1
BGD
7, 8663–8697, 2010Sources of short-lived bromocarbons
S. Raimund et al.
Title Page
Abstract Introduction
Conclusions References
Tables Figures
◭ ◮
◭ ◮
Back Close
Full Screen / Esc
Printer-friendly Version
Interactive Discussion
Discussion
P
a
per
|
Dis
cussion
P
a
per
|
Discussion
P
a
per
|
Discussio
n
P
a
per
|
4 Discussion
4.1 Evaluating the source strength
In this study, bromocarbons concentrations reported for the first time in the Iberian up-welling were low compared to other productive marine areas (Table 2). To the best of our knowledge only three studies focused on upwelling regions. Class and Ballschmiter 5
(1988) measured bromocarbons in air and water samples near the West African coast (6–30◦N, 16◦W). Quack et al. (2007) studied the oceanic distribution of CH
2Br2 and CHBr3 in the water column in the same area (17–20.5◦N, 16–19◦W). While CH2Br2 values were similar, reported CHBr3values were significantly lower in the latter study. A more recent work by Carpenter et al. (2009) presented sea surface concentrations 10
for the same compounds, which were in close agreement with those from Quack et al. (2007). Both investigations agreed that bromocarbon concentrations were elevated in the upwelling, as compared to open ocean concentrations but lower than concen-trations known from macroalgae influenced coastal regions. In agreement with results from the Mauritanian upwelling by Quack et al. (2007) and Carpenter et al. (2009), 15
our results exhibit a marked gradient of bromocarbon concentrations from the up-welling towards the open ocean. Integrated values of CHBr3 for the entire upwelling (30 pmol L−1) were one order of magnitude lower than for other productive coastal
ar-eas (e.g. Jones et al., 2009; Bravo-Linares and Mudge, 2009) and hence do not support the fact that upwelling regions are pronounced “hot spots” for halocarbon formation, as 20
previously assumed (Quack et al., 2004). However, sources for the Iberian upwelling seem to be higher than those for the Mauritanian upwelling since CH2Br2and CHBr3 values were significantly lower the offMauritania coast.
The low bromocarbon concentrations measured in several upwelling areas ques-tioned the putitative role of phytoplankton as an important halocarbon source and were 25
BGD
7, 8663–8697, 2010Sources of short-lived bromocarbons
S. Raimund et al.
Title Page
Abstract Introduction
Conclusions References
Tables Figures
◭ ◮
◭ ◮
Back Close
Full Screen / Esc
Printer-friendly Version
Interactive Discussion
Discussion
P
a
per
|
Dis
cussion
P
a
per
|
Discussion
P
a
per
|
Discussio
n
P
a
per
|
Klick and Abrahamsson, 1992; Moore and Tokarczyk, 1993). For example, CHBr3 values reported by Carpenter et al. (2007) for phytoplankton rich Antarctic surface wa-ters were about twice as much as in the Iberian upwelling. The discrepancy between expected and observed concentrations in upwelling areas investigated so far is likely due to the fact that halocarbon production is highly species specific (e.g. Moore et 5
al., 1996). Several authors showed that phytoplankton species from distant phyla are effective halocarbon sources and that within the same genus, species showed surpris-ing low performance in halocarbon production (Sturges et al., 1992; Tokarczyk and Moore, 1994; Moore et al., 1996). Hill and Manley (2009) implicated halocarbon pro-duction with temperature adaptation of phytoplankton species: polar diatom species 10
showed generally high bromoperoxidase activity, while most of the temperate and trop-ical species showed only little or no bromoperoxidase activity. Hence, phytoplankton composition in the investigated upwelling regions must have been unfavourable for a high bromocarbon production. It must be considered that differences in the published halocarbon concentrations in several areas may also be partly due to temporal vari-15
ability of the source strength. Several studies showed that seasonality of halocarbon production can be explained by enhanced tissue decay during midsummer (Goodwin et al., 1997a; Klick, 1992), stimulated halocarbon formation under high light condition by macroalgae (e.g. Carpenter et al., 2005; Nightingale et al., 1995; Pedersen et al., 1996) or phytoplankton blooms (e.g. Hughes et al., 2009). Thus, the above comparison 20
of different studies only roughly enables to identify tendencies of local source strengths.
4.2 Evidence for halocarbon production by phytoplankton
Although bromocarbon concentrations were comparatively low and thus the putitative role of phytoplanktonic production less important, we found evidences for a weak phy-toplanktonic source in our studied area. Spatial (Figs. 2 and 3) and vertical distribution 25
BGD
7, 8663–8697, 2010Sources of short-lived bromocarbons
S. Raimund et al.
Title Page
Abstract Introduction
Conclusions References
Tables Figures
◭ ◮
◭ ◮
Back Close
Full Screen / Esc
Printer-friendly Version
Interactive Discussion
Discussion
P
a
per
|
Dis
cussion
P
a
per
|
Discussion
P
a
per
|
Discussio
n
P
a
per
|
clustered according to the water masses. Significant Pearson r correlations (p <0.05) with environmental variables were plotted for each bromocarbon. Additionally to the biological markers N* (variable 1) and AOU (variable 2), we used light transmission (variable 3) as a rough approximation for phytoplankton density, since elevated phy-toplankton densities induce a decrease in light transmission. Finally, correlations to 5
marker pigments (variables 4–16) were used to identify phytoplankton groups for the production of halocarbons.
The most obvious observation is that correlations from bromocarbons with environ-mental variables were the strongest in the open ocean. The absence of clear corre-lations in recently upwelled and aged upwelled waters, together with elevated bromo-10
carbon concentrations in these water masses, indicates a strong non-phytoplanktonic source, which possibly masked the halocarbon production by phytoplankton in these water masses. Consequently, phytoplankton had highest relevance as a bromocarbon source in the open ocean.
Negative correlations from CHBr3to the biological markers N* and AOU (variables 1 15
and 2) revealed that elevated bromocarbon concentrations were related to nitrate up-take and biological oxygen production, both typical for the occurrence of phytoplankton. Negative correlations to light transmission (variable 3) were also found for all bromocar-bons in the open ocean. Assuming high phytoplankton densities caused a decreased light transmission, negative correlations to light transmission support the idea of a phy-20
toplankton source. The diversity of correlated pigments emphasize the involvement of different phytoplankton groups in the formation of bromocarbons. Correlations were highest to fucoxanthin (marker for diatoms; variable 8), Chl-b(marker for green algae and for prochlorophytes; variable 5) as well as Chl-c3 and 19’-hexanoyloxyfucoxanthin (marker for prymnesiophytes; variables 7 and 11). Hence those plankton groups might 25
have played a key role in the biological production.
BGD
7, 8663–8697, 2010Sources of short-lived bromocarbons
S. Raimund et al.
Title Page
Abstract Introduction
Conclusions References
Tables Figures
◭ ◮
◭ ◮
Back Close
Full Screen / Esc
Printer-friendly Version
Interactive Discussion
Discussion
P
a
per
|
Dis
cussion
P
a
per
|
Discussion
P
a
per
|
Discussio
n
P
a
per
|
to be preferable for CHBr3 and CH2Br2. Nucleophilic substitution of CHBr3 by chlo-rine ions could explain parts of the CHBr2Cl and CHBrCl2 production (Class and Ballschmiter, 1988). However it must be considered that halogen exchange reactions are extremely slow with an estimated CHBr3half-life time of 1.3 to 18.5 years (see ref-erences in Carpenter and Liss, 2000). Hence there will be a significant time delay be-5
tween elevated CHBr3concentrations and chemical CHBr2Cl and CHBrCl2production. Alternatively, the decay of organic matter, including the involvement of heterotrophic bacteria, would be an additional source for those bromocarbons. However, since AOU did not show positive correlations in any water mass the decay of organic matter must have been a relatively less important bromocarbon source.
10
4.3 Evidences for a near shore source
According to the results of the correlation analysis, phytoplankton dominated the pro-duction of brominated compounds in the open ocean. In the recently and aged up-welled waters however, phytoplankton production have been masked by strong non-phytoplanktonic or external sources. Such sources could be free floating macroalgae 15
(Moore and Tokarczyk, 1993), decay of organic matter (Klick, 1992), or the transport of halocarbon enriched coastal waters to the open ocean (Carpenter and Liss, 2000; Chuck et al., 2005). Sources in coastal water are related to macroalgae (e.g. Nightin-gale et al., 1995) and, to a lower degree, to anthropogenic sources as discharge from power plants (Quack and Wallace, 2003).
20
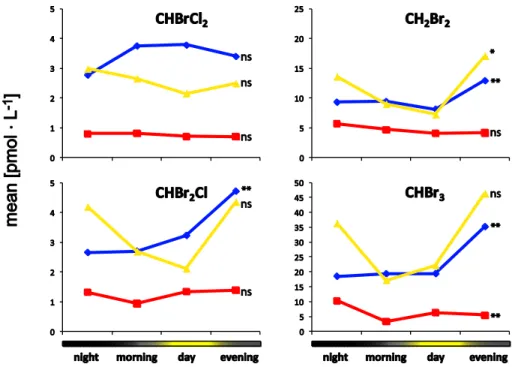
A potential coastal source might explain the temporal dynamics of bromocarbon con-centrations (Fig. 4). Hence we analysed the factors daytime and tide, which are known to have effects on coastal halocarbon concentrations (e.g. Carpenter et al., 1999). Analyses of variances (ANOVA) were computed for all samples taken from the bio-logical active upper layers. For the ANOVA, the data set was arranged by the three 25
BGD
7, 8663–8697, 2010Sources of short-lived bromocarbons
S. Raimund et al.
Title Page
Abstract Introduction
Conclusions References
Tables Figures
◭ ◮
◭ ◮
Back Close
Full Screen / Esc
Printer-friendly Version
Interactive Discussion
Discussion
P
a
per
|
Dis
cussion
P
a
per
|
Discussion
P
a
per
|
Discussio
n
P
a
per
|
day is characterized by two high and two low water periods (semi-diurnal tide) along the Iberian coast. The temporal sequence of low and high tides are synchronized with the tidal amplitude: during the cruise, two spring tides with a maximum tidal ampli-tude occurred at 14 August and 31 August. At this period, the low tide passed around morning and afternoon. Then the low tide shifted constantly until the next neap tides 5
(lowest tidal amplitude at 22 August and 5 September, respectively). At neap tide, the low tide passed around noon and midnight. Thus possible tidal and temporal effects on halocarbon concentration can complement or oppose one another.
The temporal division of the dataset followed the natural daily cycle and was clus-tered in four groups: night, morning, day and evening. Night and day were defined 10
as two hours before sunrise and sunset, respectively. Morning and evening were de-fined as intermediates between day and night. During the campaign the day period lasted about 6.5 h, the night period about 9.5 h and morning and evening exactly 4 h in each case. The day time showed significant effects on most brominated halocar-bon concentrations in recently upwelled water masses (Fig. 7). CH2Br2, CHBr2Cl and 15
CHBr3concentrations were significantly higher in the evening, as compared to the rest of the day (factor 1.5 to 1.8 at p-values below 0.055). In aged upwelled waters vari-ances of bromocarbon concentrations were statistically not significant. In open ocean waters, diurnal variations of CH2Br2, CHBr2Cl and CHBrCl2 were also low and only CHBr3 concentrations were significantly elevated during night (factor 2 at p=0.05). 20
Diurnal variations of halocarbon concentrations can be explained by elevated photon flux densities during midday, which boost the rate of photosynthesis and consequently enzymatic halocarbon production (Goodwin et al., 1997b). Such effects were shown for macroalgae (Ekdahl et al., 1998; Nightingale et al., 1995; Laturnus et al., 1998) and microalgae (Abrahamsson et al., 2004). The elevated midday concentrations in those 25
BGD
7, 8663–8697, 2010Sources of short-lived bromocarbons
S. Raimund et al.
Title Page
Abstract Introduction
Conclusions References
Tables Figures
◭ ◮
◭ ◮
Back Close
Full Screen / Esc
Printer-friendly Version
Interactive Discussion
Discussion
P
a
per
|
Dis
cussion
P
a
per
|
Discussion
P
a
per
|
Discussio
n
P
a
per
|
achieved by coordinating sampling time with a tide table, provided by SHOM (Service Hydrographique et Oc ´eanographique de la Marine, Brest, France) for different loca-tions along the Iberian coast. Hence the sampling time at sea reflected the tidal period at the coast. The influence of tide was evident for CH2Br2, CHBr2Cl and CHBr3 in recently upwelled waters, visible in aged upwelled waters, and not significant in the 5
open ocean (Fig. 8). In recently upwelled waters, concentrations of CH2Br2, CHBr2Cl and CHBr3 were significantly elevated at outgoing tide (factor 1.6–1.9 at p <0.01). In aged upwelled waters, tidal variations of these three compounds were higher with maxima at outgoing tide (2.2 to 2.3-fold elevated) but with a weaker significance level (0.05> p >0.1). Variances of CHBrCl2 were statistically not significant in all water 10
masses.
Our findings of general elevated bromocarbon concentrations at outgoing tide are in contrast to other studies, which previously investigated the effect of tide on halocarbon concentrations in air (Jones et al., 2009; Peters et al., 2005) and water (Nightingale et al., 1995; Carpenter et al., 2000) samples. In these studies, coastal air and wa-15
ter concentrations increased with lower water levels and showed minima at high water levels. As mentioned above our elevated concentrations found in the evening for sev-eral brominated compounds were in contrast to commonly found midday maximum. The discrepancies between our observations and previous studies reflect a possible coastal source associated with lateral transport of halocarbon enriched waters towards 20
the upwelling.
The tidal and temporal effects on halocarbon concentrations in the upwelling can be explained by tidal mixing and upwelling currents. Tidal currents might elevate halocar-bons concentrations at outgoing mid-tide. However those tidal residual currents are expected to be very low and variable at a dozen of km from the coast, the sampling 25
BGD
7, 8663–8697, 2010Sources of short-lived bromocarbons
S. Raimund et al.
Title Page
Abstract Introduction
Conclusions References
Tables Figures
◭ ◮
◭ ◮
Back Close
Full Screen / Esc
Printer-friendly Version
Interactive Discussion
Discussion
P
a
per
|
Dis
cussion
P
a
per
|
Discussion
P
a
per
|
Discussio
n
P
a
per
|
concentrations in freshly produced halocarbons. Then, the low tide associated with the westward surface upwelling currents (Rossi et al., 2010b) create an offshore transport of these bromocarbon enriched coastal waters. It induces elevated bromocarbon con-centrations far from the coastline several hours after the low tide. The surface offshore velocities were ranging roughly from 0.1 to 0.2 m s−1 for the first leg (strong upwelling
5
favourable winds), giving a transport of 10 to 20 km (from the coast to the sampling sites) within 24 h. Hence high measured concentrations in the coastal upwelling might be related to an intertidal production during the previous tidal cycle, followed by an offshore transport.
Despite the general advection processes, bromocarbons were highly patchy dis-10
tributed along the Iberian coast (Fig. 3). Causal for these dynamics can be different coastal sources (macroalgae, river discharge) with a high variability of either the source strength or the water transport towards the upwelling. The complex shelf topography of the Iberian upwelling System creates small scale instabilities, which may interfere with the transport caused by tidal mixing and upwelling currents. Along the north-15
south transect, cyclonic eddies alternate with anticyclonic eddies (Rossi et al., 2010a). The small scale instabilities created highly variable patterns of cross-shore and along shore currents with effects on biological, physical and geochemical variables. Addi-tionally it can be assumed that the source strength fluctuates along the Iberian coast, which may explain some particularly elevated bromocarbon concentrations between 20
41◦
N and 42◦
N and around 39.5◦
N. Lower salinities at those samples from the area indicate the presence of the Western Iberian Buoyant Plume (Peliz et al., 2002), which is characterized by important freshwater discharge from the rivers Minho and Douro. Hence anthropogenic discharge in the catchment area of the rivers could account for the unusual elevated bromocarbon concentrations. Alternatively macroalgae can be 25
BGD
7, 8663–8697, 2010Sources of short-lived bromocarbons
S. Raimund et al.
Title Page
Abstract Introduction
Conclusions References
Tables Figures
◭ ◮
◭ ◮
Back Close
Full Screen / Esc
Printer-friendly Version
Interactive Discussion
Discussion
P
a
per
|
Dis
cussion
P
a
per
|
Discussion
P
a
per
|
Discussio
n
P
a
per
|
have positive implications on coastal macroalgae growth rates and consequently halo-carbon production.
5 Conclusions
Our investigation of the Iberian peninsula upwelling revealed that CH2Br2, CHBrCl2, CHBr2Cl and CHBr3 concentrations were elevated in the upwelling compared to the 5
open ocean. A complex feature of along-shore and cross-shore currents and diff er-ences in source strength caused the strong patchiness of bromocarbon distribution in the studied area. Contrary to our assumption of a strong phytoplanktonic source within the upwelling, measured bromocarbon concentrations were low compared to macroal-gae influenced coastal areas. Although the Iberian upwelling is thus not a pronounced 10
“hot spot” for halocarbon formation, a weak phytoplanktonic source in the open ocean offPortugal was evident. For the upwelling along the coast however, the phytoplank-ton production was masked by strong coastal sources, including natural production by macroalgae and anthropogenic sources. The coastal sources showed a dependence on daytime and tide, a typical feature for halocarbon production in intertidal macroalgae 15
beds.
We suggest that further studies should be conducted in the inner shelf between the shore line and the upwelling in order to localize important sources and assess the westwards transport of halocarbon enriched coastal waters. This type of study would complete our investigation of the middle and outer shelf of the Iberian upwelling and 20
would provide a comprehensive understanding of halocarbon sources in this highly heterogeneous system.
Acknowledgements. The authors thank Joelle Tassel (SHOM) for pigments measurements, Dani `ele Thouron (LEGOS) for nutrients analysis as well as Eric Mac ´e (SBR) and Thierry Car-iou (SBR) for technical assistance. We are gratefull to the SHOM for making possible our
25
BGD
7, 8663–8697, 2010Sources of short-lived bromocarbons
S. Raimund et al.
Title Page
Abstract Introduction
Conclusions References
Tables Figures
◭ ◮
◭ ◮
Back Close
Full Screen / Esc
Printer-friendly Version
Interactive Discussion
Discussion
P
a
per
|
Dis
cussion
P
a
per
|
Discussion
P
a
per
|
Discussio
n
P
a
per
|
References
Abrahamsson, K., Loren, A., Wulff, A., and Wangberg, S. A.: Air-sea exchange of halocarbons: The influence of diurnal and regional variations and distribution of pigments, Deep-Sea Res. Pt Ii, 51, 2789–2805, doi:10.1016/j.dsr2.2004.09.005, 2004.
Bravo-Linares, C. M. and Mudge, S. M.: Temporal trends and identification of the sources
5
of volatile organic compounds in coastal seawater, J. Environ. Monitor, 11, 628–641, doi:10.1039/B814260m, 2009.
Bulsiewicz, K., Rose, H., Klatt, O., Putzka, A., and Roether, W.: A capillary-column chromato-graphic system for efficient chlorofluorocarbon measurement in ocean waters, J. Geophys. Res.-Oceans, 103, 15959–15970, 1998.
10
Butler, J. H., King, D. B., Lobert, J. M., Montzka, S. A., Yvon-Lewis, S. A., Hall, B. D., Warwick, N. J., Mondeel, D. J., Aydin, M., and Elkins, J. W.: Oceanic distribu-tions and emissions of short-lived halocarbons, Global Biogeochem. Cycles, 21, Gb1023, doi:10.1029/2006gb002732, 2007.
Carpenter, L. J. and Liss, P. S.: On temperate sources of bromoform and other reactive organic
15
bromine gases, J. Geophys. Res.-Atmos., 105, 20539–20547, 2000.
Carpenter, L. J., Sturges, W. T., Penkett, S. A., Liss, P. S., Alicke, B., Hebestreit, K., and Platt, U.: Short-lived alkyl iodides and bromides at mace head, ireland: Links to biogenic sources and halogen oxide production, J. Geophys. Res.-Atmos., 104, 1679–1689, 1999.
Carpenter, L. J., Malin, G., Liss, P. S., and Kupper, F. C.: Novel biogenic iodine-containing
20
trihalomethanes and other short-lived halocarbons in the coastal east atlantic, Global Bio-geochem. Cycles, 14, 1191–1204, 2000.
Carpenter, L. J., Wevill, D. J., O’Doherty, S., Spain, G., and Simmonds, P. G.: Atmospheric bromoform at Mace Head, Ireland: seasonality and evidence for a peatland source, Atmos. Chem. Phys., 5, 2927–2934, doi:10.5194/acp-5-2927-2005, 2005.
25
Carpenter, L. J., Wevill, D. J., Palmer, C. J., and Michels, J.: Depth profiles of volatile iodine and bromine-containing halocarbons in coastal antarctic waters, Mar. Chem., 103, 227–236, doi:10.1016/j.marchem.2006.08.003, 2007.
Carpenter, L. J., Jones, C. E., Dunk, R. M., Hornsby, K. E., and Woeltjen, J.: Air-sea fluxes of biogenic bromine from the tropical and North Atlantic Ocean, Atmos. Chem. Phys., 9,
30
1805–1816, doi:10.5194/acp-9-1805-2009, 2009.
BGD
7, 8663–8697, 2010Sources of short-lived bromocarbons
S. Raimund et al.
Title Page
Abstract Introduction
Conclusions References
Tables Figures
◭ ◮
◭ ◮
Back Close
Full Screen / Esc
Printer-friendly Version
Interactive Discussion
Discussion
P
a
per
|
Dis
cussion
P
a
per
|
Discussion
P
a
per
|
Discussio
n
P
a
per
|
of biogenic halocarbons in the open ocean, J. Geophys. Res.-Oceans, 110, C10022, doi:10.1029/2004jc002741, 2005.
Class, T. H. and Ballschmiter, K.: Chemistry of organic traces in air .8. Sources and distribution of bromochloromethanes and bromochloromethanes in marine air and surfacewater of the atlantic-ocean, J. Atmos. Chem., 6, 35–46, 1988.
5
Coelho, H. S., Neves, R. J. J., White, M., Leitao, P. C., and Santos, A. J.: A model for ocean circulation on the iberian coast, J Mar. Syst., 32, 153–179, Pii S0924-7963(02)00032-5, 2002.
Ekdahl, A., Pedersen, M., and Abrahamsson, K.: A study of the diurnal variation of biogenic volatile halocarbons, Mar. Chem., 63, 1–8, 1998.
10
Goodwin, K. D., Lidstrom, M. E., and Oremland, R. S.: Marine bacterial degradation of bromi-nated methanes, Environ. Sci. Technol., 31, 3188–3192, 1997a.
Goodwin, K. D., North, W. J., and Lidstrom, M. E.: Production of bromoform and dibro-momethane by giant kelp: Factors affecting release and comparison to anthropogenic bromine sources, Limnol. Oceanogr., 42, 1725–1734, 1997b.
15
Gruber, N. and Sarmiento, J. L.: Global patterns of marine nitrogen fixation and denitrification, Global Biogeochem. Cycles, 11, 235–266, 1997.
Hill, V. L. and Manley, S. L.: Release of reactive bromine and iodine from diatoms and its possible role in halogen transfer in polar and tropical oceans, Limnol. Oceanogr., 54, 812– 822, 2009.
20
Hughes, C., Chuck, A. L., Rossetti, H., Mann, P. J., Turner, S. M., Clarke, A., Chance, R., and Liss, P. S.: Seasonal cycle of seawater bromoform and dibromomethane concentrations in a coastal bay on the western antarctic peninsula, Global Biogeochem. Cycles, 23, Gb2024, doi:10.1029/2008gb003268, 2009.
Jones, C. E., Hornsby, K. E., Dunk, R. M., Leigh, R. J., and Carpenter, L. J.: Coastal
measure-25
ments of short-lived reactive iodocarbons and bromocarbons at Roscoff, Brittany during the RHaMBLe campaign, Atmos. Chem. Phys., 9, 8757–8769, doi:10.5194/acp-9-8757-2009, 2009.
Klick, S.: Seasonal-variations of biogenic and anthropogenic halocarbons in seawater from a coastal site, Limnol. Oceanogr., 37, 1579–1585, 1992.
30
Klick, S. and Abrahamsson, K.: Biogenic volatile iodated hydrocarbons in the ocean, J. Geo-phys. Res.-Oceans, 97, 12683–12687, 1992.
BGD
7, 8663–8697, 2010Sources of short-lived bromocarbons
S. Raimund et al.
Title Page
Abstract Introduction
Conclusions References
Tables Figures
◭ ◮
◭ ◮
Back Close
Full Screen / Esc
Printer-friendly Version
Interactive Discussion
Discussion
P
a
per
|
Dis
cussion
P
a
per
|
Discussion
P
a
per
|
Discussio
n
P
a
per
|
1991.
Laturnus, F., Wiencke, C., and Adams, F. C.: Influence of light conditions on the release of volatile halocarbons by antarctic macroalgae, Mar. Environ. Res., 45, 285–294, 1998. Law, C. S. and Sturges, W. T.: Halogenated very short-lived substances, in: World
meteorolog-ical organization global ozone research and monitoring project, report no. 50, 2006.
5
Leblanc, C., Colin, C., Cosse, A., Delage, L., La Barre, S., Morin, P., Fievet, B., Voiseux, C., Am-broise, Y., Verhaeghe, E., Amouroux, D., Donard, O., Tessier, E., and Potin, P.: Iodine trans-fers in the coastal marine environment: The key role of brown algae and of their vanadium-dependent haloperoxidases, Biochimie, 88, 1773–1785, doi:10.1016/j.biochi.2006.09.001, 2006.
10
Manley, S. L.: Phytogenesis of halomethanes: A product of selection or a metabolic accident?, Biogeochemistry, 60, 163–180, 2002.
Manley, S. L., Goodwin, K., and North, W. J.: Laboratory production of bromoform, methylene bromide, and methyl-iodide by macroalgae and distribution in nearshore southern california waters, Limnol. Oceanogr., 37, 1652–1659, 1992.
15
Marta-Almeida, M. and Dubert, J.: The structure of tides in the western iberian region, Cont. Shelf Res., 26, 385–400, doi:10.1016/j.csr.2005.11.011, 2006.
Moore, R. M. and Tokarczyk, R.: Volatile biogenic halocarbons in the northwest atlantic, Global Biogeochem. Cycles, 7, 195–210, 1993.
Moore, R. M., Webb, M., Tokarczyk, R., and Wever, R.: Bromoperoxidase and iodoperoxidase
20
enzymes and production of halogenated methanes in marine diatom cultures, J. Geophys. Res.-Oceans, 101, 20899–20908, 1996.
Nightingale, P. D., Malin, G., and Liss, P. S.: Production of chloroform and other low-molecular-weight halocarbons by some species of macroalgae, Limnol. Oceanogr., 40, 680–689, 1995. Pedersen, M., Collen, J., Abrahamsson, K., and Ekdahl, A.: Production of halocarbons from
25
seaweeds: An oxidative stress reaction?, Sci. Mar., 60, 257–263, 1996.
Peliz, A., Rosa, T. L., Santos, A. M. P., and Pissarra, J. L.: Fronts, jets, and counter-flows in the western iberian upwelling system, J. Mar. Syst., 35, 61–77, Pii S0924-7963(02)00076-3, 2002.
Perez, F. F., Castro, C. G., Alvarez-Salgado, X. A., and Rios, A. F.: Coupling between the iberian
30
basin - scale circulation and the portugal boundary current system: A chemical study, Deep-Sea Res. Pt I, 48, 1519–1533, 2001.
BGD
7, 8663–8697, 2010Sources of short-lived bromocarbons
S. Raimund et al.
Title Page
Abstract Introduction
Conclusions References
Tables Figures
◭ ◮
◭ ◮
Back Close
Full Screen / Esc
Printer-friendly Version
Interactive Discussion
Discussion
P
a
per
|
Dis
cussion
P
a
per
|
Discussion
P
a
per
|
Discussio
n
P
a
per
|
Winterlik, J., and Platt, U.: Reactive and organic halogen species in three different European coastal environments, Atmos. Chem. Phys., 5, 3357–3375, doi:10.5194/acp-5-3357-2005, 2005.
Pruvost, J., Connan, O., Marty, Y., and Le Corre, P.: A sampling device for collection and analysis of volatile halocarbons in coastal and oceanic waters, Analyst, 124, 1389–1394,
5
1999.
Quack, B. and Wallace, D. W. R.: Air-sea flux of bromoform: Controls, rates, and implications, Global Biogeochem. Cycles, 17, 1023, doi:10.1029/2002gb001890, 2003.
Quack, B., Atlas, E., Petrick, G., Stroud, V., Schauffler, S., and Wallace, D. W. R.: Oceanic bromoform sources for the tropical atmosphere, Geophys. Res. Lett., 31, L23s05,
10
doi:10.1029/2004gl020597, 2004.
Quack, B., Peeken, I., Petrick, G., and Nachtigall, K.: Oceanic distribution and sources of bromoform and dibromomethane in the mauritanian upwelling, J. Geophys. Res.-Oceans, 112, C10006, doi:10.1029/2006jc003803, 2007.
Read, K. A., Mahajan, A. S., Carpenter, L. J., Evans, M. J., Faria, B. V. E., Heard, D. E., Hopkins,
15
J. R., Lee, J. D., Moller, S. J., Lewis, A. C., Mendes, L., McQuaid, J. B., Oetjen, H., Saiz-Lopez, A., Pilling, M. J., and Plane, J. M. C.: Extensive halogen-mediated ozone destruction over the tropical atlantic ocean, Nature, 453, 1232–1235, doi:10.1038/Nature07035, 2008. Relvas, P., Barton, E. D., Dubert, J., Oliveira, P. B., Peliz, A., da Silva, J. C. B., and Santos, A.
M. P.: Physical oceanography of the western iberia ecosystem: Latest views and challenges,
20
Prog. Oceanogr., 74, 149–173, doi:10.1016/j.pocean.2007.04.021, 2007.
Rossi, V., Garc¸on, V., Tassel, J., Romagnan, J. B., Stemmann, L., Jourdin, F., Morin, P., and Morel, Y.: A mesoscale survey of the northern and central Iberian Peninsula Upwelling Sys-tem: spatial variability and bio-physical interactions, Prog. Oceanogr., submitted, 2010a. Rossi, V., Morel, Y., and Garcon, V.: Effect of the wind on the shelf dynamics:
Forma-25
tion of a secondary upwelling along the continental margin, Ocean Model, 31, 51–79, doi:10.1016/j.ocemod.2009.10.002, 2010b.
Salawitch, R. J., Weisenstein, D. K., Kovalenko, L. J., Sioris, C. E., Wennberg, P. O., Chance, K., Ko, M. K. W., and McLinden, C. A.: Sensitivity of ozone to bromine in the lower stratosphere, Geophys. Res. Lett., 32, L05811, doi:10.1029/2004gl021504, 2005.
30
BGD
7, 8663–8697, 2010Sources of short-lived bromocarbons
S. Raimund et al.
Title Page
Abstract Introduction
Conclusions References
Tables Figures
◭ ◮
◭ ◮
Back Close
Full Screen / Esc
Printer-friendly Version
Interactive Discussion
Discussion
P
a
per
|
Dis
cussion
P
a
per
|
Discussion
P
a
per
|
Discussio
n
P
a
per
|
Sturges, W. T., Cota, G. F., and Buckley, P. T.: Bromoform emission from arctic ice algae, Nature, 358, 660–662, 1992.
Tokarczyk, R. and Moore, R. M.: Production of volatile organohalogens by phytoplankton cul-tures, Geophys. Res. Lett., 21, 285–288, 1994.
von Glasow, R., von Kuhlmann, R., Lawrence, M. G., Platt, U., and Crutzen, P. J.: Impact
5
of reactive bromine chemistry in the troposphere, Atmos. Chem. Phys., 4, 2481–2497, doi:10.5194/acp-4-2481-2004, 2004.
Wright, S. W., Jeffrey, S. W., Mantoura, R. F. C., Llewellyn, C. A., Bjornland, T., Repeta, D., and Welschmeyer, N.: Improved hplc method for the analysis of chlorophylls and carotenoids from marine-phytoplankton, Mar. Ecol.-Prog. Ser., 77, 183–196, 1991.
BGD
7, 8663–8697, 2010Sources of short-lived bromocarbons
S. Raimund et al.
Title Page
Abstract Introduction
Conclusions References
Tables Figures
◭ ◮
◭ ◮
Back Close
Full Screen / Esc
Printer-friendly Version
Interactive Discussion
Discussion
P
a
per
|
Dis
cussion
P
a
per
|
Discussion
P
a
per
|
Discussio
n
P
a
per
|
Table 1.The range (10th and 90th percentiles) and mean of bromocarbon concentrations and
selected physical, chemical and biological variables in the Iberian Upwelling. Data grouped by sampling depth (upper layers: surface to maximum of chlorophyll; lower layers: below maximum of chlorophyll) and water mass with indicated temperature anomalies (difference between SST of a water mass and all samples).
upper layers
recently upwelled aged upwelled open ocean
10th 90th mean N 10th 90th mean N 10th 90th mean N
CH2Br2[pmol L−1] 5.4 15.2 9.8 51 4.6 22.8 11.8 58 2.7 6.9 4.8 33
CHBrCl2[pmol L−1] 1.3 3.8 3.1 50 0.9 3.9 2.3 57 0.5 1.0 0.8 33
CHBr2Cl [pmol L−1] 0.6 5.1 3.2 51 0.0 8.2 3.3 58 0.5 2.2 1.3 33
CHBr3[pmol L−1] 11.3 39.5 21.7 51 10.3 74.4 31.1 58 3.8 15.1 7.4 33
chl-a[mg m−3] 0.57 2.57 1.40 52 0.37 3.48 1.75 73 0.13 0.90 0.50 33
chl-b[mg m−3] 0.00 0.19 0.10 28 0.00 0.22 0.12 63 0.00 0.31 0.11 18
chl-c2 [mg m−3] 0.00 0.68 0.23 28 0.00 0.54 0.18 63 0.00 0.20 0.05 18
chl-c3 [mg m−3] 0.00 0.31 0.09 28 0.00 0.28 0.11 63 0.00 0.30 0.07 18
fuco [mg m−3] 0.25 2.49 0.91 28 0.10 2.04 0.80 63 0.02 0.21 0.09 18
but [mg m−3] 0.00 0.05 0.02 28 0.00 0.08 0.04 63 0.01 0.12 0.06 18
perid [mg m−3] 0.03 0.15 0.09 28 0.02 0.22 0.10 63 0.00 0.11 0.03 18
hex [mg m−3] 0.01 0.16 0.06 28 0.02 0.26 0.12 63 0.01 0.52 0.18 18
diadino [mg m−3] 0.03 0.25 0.10 28 0.03 0.21 0.11 63 0.01 0.05 0.03 18
allo [mg m−3] 0.00 0.06 0.02 28 0.00 0.05 0.02 63 0.00 0.02 0.01 18
lut [mg m−3] 0.00 0.04 0.01 28 0.00 0.04 0.01 63 0.00 0.00 0.00 18
zea [mg m−3] 0.00 0.06 0.03 28 0.00 0.09 0.04 63 0.05 0.11 0.08 18
bcar [mg m−3] 0.00 0.13 0.05 28 0.00 0.11 0.04 63 0.00 0.06 0.02 18
Salinity [PSU] 35.64 35.72 35.68 52 35.61 35.76 35.69 73 35.80 36.04 35.92 33
Density [σ] 26.49 26.85 26.68 52 26.08 26.68 26.34 73 25.45 26.63 26.08 33
Oxygen [µmol L−1] 191.28 278.50 224.43 52 241.93 306.92 267.62 73 225.54 252.38 239.82 33
AOU [µmol L−1]
−21.87 63.64 32.91 52 −55.60 8.60 −14.25 73 −4.86 5.78 1.18 33
Nitrate [µmol L−1] 0.68 11.10 7.35 44 0.00 5.09 1.55 71 0.00 0.95 0.37 30
Silicate [µmol L−1] 0.70 5.83 3.13 45 0.54 1.97 1.05 72 0.91 1.94 1.27 31
Phosphate [µmol L−1] 0.11 0.97 0.62 44 0.05 0.38 0.18 70 0.02 0.17 0.08 33
BGD
7, 8663–8697, 2010Sources of short-lived bromocarbons
S. Raimund et al.
Title Page
Abstract Introduction
Conclusions References
Tables Figures
◭ ◮
◭ ◮
Back Close
Full Screen / Esc
Printer-friendly Version
Interactive Discussion
Discussion
P
a
per
|
Dis
cussion
P
a
per
|
Discussion
P
a
per
|
Discussio
n
P
a
per
|
Table 1.Continued.
lower layers
recently upwelled aged upwelled open ocean
10th 90th mean N 10th 90th mean N 10th 90th mean N
CH2Br2[pmol L−1] 4.8 10.8 7.8 30 2.6 10.6 6.6 34 2.8 6.4 4.2 16
CHBrCl2[pmol L−1] 1.8 4.1 3.0 31 0.9 3.6 2.3 34 0.5 1.0 0.8 16
CHBr2Cl [pmol L−1] 0.5 4.0 2.8 31 0.0 3.3 1.8 34 0.4 1.6 1.1 16
CHBr3[pmol L−1] 6.0 15.1 11.9 31 3.3 17.3 9.5 34 2.1 5.1 3.5 16
chl-a[mg m−3] 0.13 0.48 0.28 32 0.08 0.83 0.39 45 0.05 0.20 0.08 16
chl-b[mg m−3] 0.00 0.12 0.03 8 0.00 0.09 0.04 24 0
chl-c2 [mg m−3] 0.03 0.17 0.07 8 0.00 0.10 0.03 24 0
chl-c3 [mg m−3] 0.02 0.08 0.04 8 0.00 0.12 0.04 24 0
fuco [mg m−3] 0.13 0.72 0.33 8 0.05 0.55 0.23 24 0
but [mg m−3] 0.00 0.02 0.01 8 0.00 0.03 0.01 24 0
perid [mg m−3] 0.00 0.09 0.03 8 0.00 0.07 0.03 24 0
hex [mg m−3] 0.00 0.02 0.01 8 0.00 0.06 0.03 24 0
diadino [mg m−3] 0.01 0.07 0.03 8 0.00 0.04 0.03 24 0
allo [mg m−3] 0.00 0.06 0.01 8 0.00 0.01 0.00 24 0
lut [mg m−3] 0.00 0.02 0.00 8 0.00 0.03 0.01 24 0
zea [mg m−3] 0.00 0.04 0.01 8 0.00 0.03 0.01 24 0
bcar [mg m−3] 0.00 0.05 0.01 8 0.00 0.04 0.01 24 0
Salinity [PSU] 35.67 35.82 35.76 32 35.70 35.82 35.77 45 35.72 35.80 35.76 16
Density [σ] 26.92 27.05 26.99 32 26.80 27.05 26.94 45 26.90 27.05 27.01 16
Oxygen [µmol L−1] 154.62 217.53 183.58 32 163.91 228.17 199.83 45 221.03 236.60 230.23 16
AOU [µmol L−1] 52.26 107.21 80.14 32 1.31 98.91 54.90 45 24.65 43.11 33.73 16
Nitrate [µmol L−1] 8.49 14.96 12.50 27 6.47 13.52 9.74 44 4.80 10.20 8.08 16
Silicate [µmol L−1] 3.24 8.07 5.82 27 1.93 7.32 4.29 43 1.97 5.02 3.25 16
Phosphate [µmol L−1] 0.60 1.03 0.86 27 0.45 0.92 0.68 43 0.31 0.71 0.53 16
N* [µmol L−1] −0.13 2.95 1.57 27 0.69 2.79 1.67 43 1.95 2.96 2.52 16
BGD
7, 8663–8697, 2010Sources of short-lived bromocarbons
S. Raimund et al.
Title Page
Abstract Introduction
Conclusions References
Tables Figures
◭ ◮
◭ ◮
Back Close
Full Screen / Esc
Printer-friendly Version
Interactive Discussion
Discussion
P
a
per
|
Dis
cussion
P
a
per
|
Discussion
P
a
per
|
Discussio
n
P
a
per
|
Table 2.Comparison of marine concentrations in different regions. Mean values in pmol L−1.
African coastal upwelling Mauritanian upwelling African coastal upwelling North east Atlantic Iberian Upwelling English Channel Irish Sea Antarctic waters
25◦N 17–20.5◦N 16–35◦N 53–59◦N 39–43◦N 50◦N 53◦N 70–72◦S
16◦W 16–19◦W 14–24◦W 7–13◦W 9–11◦W 4◦W 4◦W 9–11◦W
(03/1985) (04–05/2005) (05–06/2007) (06–07/2006) (08–09/2007) (2006) (2004–2005) (12/2003) Class and Ballschmiter (1988) Quack et al. (2007) Carpenter et al. (2009) this work Jones et al. (2009) Bravo-Linares and Mudge (2009) Carpenter et al. (2007)
CH2Br2 5.77 a
4.9a
3.4c
1.1e
11.8h
11.8k
5.45g
5.8b
3d
1.9f
7.4i
22l
1.4e 15.6g
CHBrCl2 6.1
a
3.0h
5.06g
2.9i
CHBr2Cl 9.6 a
3.7h
17.3g
2.6i
CHBr3 23.74
a
10.7a
11.5c
3.4e
30.0h
217.4k
214.23g
56.7g
9b
14.4d
6.7f
11.6i
343.2l
3.5e
68.3g
adepth 0–12 m;bdepth 14–50 m;c upwelling;dCanary;eopen ocean;f shelf and far coast;gcoastal;hupwelling,
![Fig. 5. Depth profiles of chlorophyll-a [mg m − 3 ], AOU [µmol L − 1 ], N* [µmol L − 1 ], density [σ] and brominated halocarbons [pmol L −1 ] at three long observation stations (ST 2–ST 4)](https://thumb-eu.123doks.com/thumbv2/123dok_br/18432398.362257/32.918.195.526.41.471/depth-profiles-chlorophyll-density-brominated-halocarbons-observation-stations.webp)