SRef-ID: 1680-7359/adgeo/2006-6-167 European Geosciences Union
© 2006 Author(s). This work is licensed under a Creative Commons License.
Geosciences
Inter ENSO variability and its influence over the South American
monsoon system
A. R. M. Drumond and T. Ambrizzi
Institute of Astronomy, Geophysics and Atmospheric Sciences, Rua do Matao, 1226 Sao Paulo, Brazil
Received: 13 May 2005 – Revised: 13 January 2006 – Accepted: 16 January 2006 – Published: 1 February 2006
Abstract. Previous studies have discussed the interannual variability of a meridional seesaw of dry and wet conditions over South America (SA) associated to the modulation of the South Atlantic Convergence Zone (SACZ). However, they did not explore if the variability inter ENSO (El Ni˜no South-ern Oscillation) can be related to the phase changes of this dipole. To answer this question, an observational work was carried out to explore the atmospheric and Sea Surface Tem-perature (SST) conditions related to the same ENSO signal and to opposite dipole phases.
Rotated Empirical Orthogonal Function (REOF) analy-sis was applied over normalized Chen precipitation seasonal anomalies in order to find the dipole mode in the Aus-tral Summer (December to February). The fourth rotated mode, explaining 6.6% of the total variance, consists of positive loading over the SACZ region and negative load-ing over northern Argentina. Extreme events were selected and enhanced activity of SACZ during the Summer season (SACZ+) was identified in nine years: five during La Ni˜na events (LN) and two in El Ni˜no episodes (EN). On the other hand, inhibited manifestations of this system (SACZ−) were
identified in seven years: four in EN and two during LN. Power spectrum analysis indicated that the interannual variability of the precipitation dipole seems to be related to the low frequency and to the quasi-biennial part of ENSO variability. The ENSO events with the same signal can present opposite phases for the dipole. The results suggest that the displacement of the convection over Indonesia and western Pacific can play an important role to modulate the seesaw pattern.
Correspondence to:A. R. M. Drumond ([email protected])
1 Introduction
Nogu´es-Paegle and Mo (2002) suggested the existence of a precipitation dipole pattern over South America in the inter-annual variability. During enhanced activity of South At-lantic Convergence Zone (SACZ) events, there is a maximum of precipitation over its domain region and a minimum over the subtropics. The opposite occurs during the reduction of SACZ activity.
The modulation of the SACZ events and the Austral Sum-mer South ASum-merican precipitation can be influenced by SST variability. Several works have verified the influence of ENSO events over the South American precipitation (Grimm et al., 1998; and others). However, these works did not ex-plore if the variability inter ENSO is related to the phase changes of the dipole pattern and how its mechanism work. To answer this question, the inter ENSO variability related to this low frequency South American dipole variability mode is studied.
2 Data and Methods
Chen et al. (2002) 2.5◦monthly precipitation anomalies were
used in the REOF analysis. The National Center for Envi-ronmental Prediction (NCEP) Reanalysis 2.5◦ atmospheric
dataset (Kalnay et al., 1996) and the 2◦Reynolds and Smith
(2004) SST data were used for the composites.
REOF analysis was applied over the normalized precipita-tion seasonal anomalies observed during 1950–2001 in order to find the dipole mode in the Austral Summer (from De-cember to February). The domain is located between 60◦S–
15◦N and 30◦W–90◦W. Applying the O’Lenic and Livezey
(a)
(b)
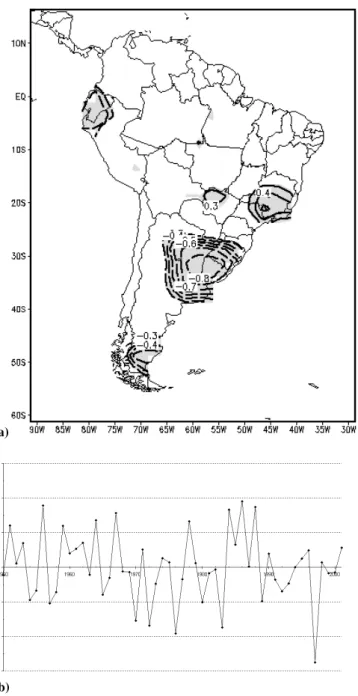
Fig. 1. (a)Correlation map between the 4th rotated mode (6.6% of the total variance) and the DJF precipitation anomalies over the South America. Gray areas indicate regions where the correlation is significant at the 95% level. Only isolines with absolute value higher than 0.3 are showed, using a 0.1 interval. Positive (negative) values are represented by continued (hashed) lines.(b)Associated normalized PC temporal series.
its normalized Principal Component time series (PC). The extreme events were classified according to the ENSO Tren-berth (1997) criteria and composites were elaborated for four classes: La Ni˜na events with enhanced and inhibited pre-cipitation activity over the SACZ region (LN/SACZ+ and LN/SACZ−) and El Ni˜no events with enhanced and
inhib-ited precipitation activity over the SACZ region (EN/SACZ+ and EN/SACZ−).
1967/68, 1984/85, 1988/89), while two occurred during El Ni˜no episodes (1951/52, 1986/87). On the other hand, two SACZ – events occurred during LN episodes (1970/71, 1983/84), while four were configured in EN events (1957/58, 1972/73, 1976/77, 1997/98). Although the classification showed that most of the SACZ+ (SACZ−) events occurred
in LN (EN) years, there are some SACZ+ events associated with EN years and vice-versa. Power spectrum analysis of the PC temporal series indicated that the interannual vari-ability of the precipitation dipole seems to be related to the low-frequency part of ENSO (a peak with a period of 3.5 years) and to the quasi-biennial component of ENSO vari-ability (another peak with a period of 2 years), according to the discussion presented in Mo (2000).
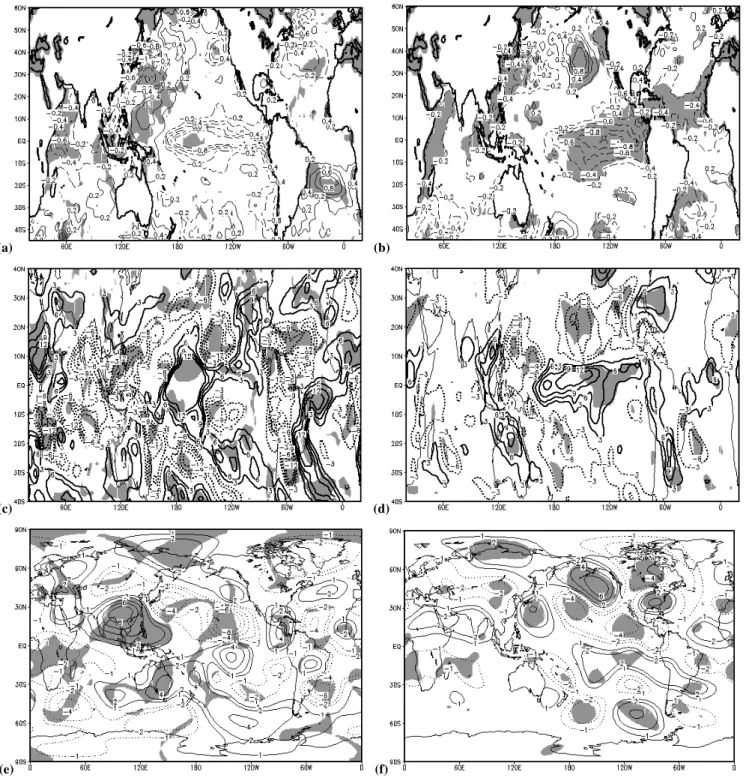
In LN episodes, LN/SACZ – presented stronger nega-tive SST anomalies over Central Pacific and warm anoma-lies over eastern Indonesia (Fig. 2a). In opposition, neg-ative SST anomalies observed in LN/SACZ+ events are weaker and displaced to the Equatorial East Pacific (Fig. 2b). Moreover, LN events in SACZ+ (−) years presented cold
(warm) SST anomalies over Southwestern Atlantic and over Southwestern Indian oceans. The strongest positive Outgo-ing Longwave Radiation (OLR) anomalies over Central Pa-cific occurred in LN/SACZ – years, which also presented anomalous convection over Indonesia and the westward dis-placement of the South Pacific Convergence Zone (SPCZ) (Fig. 2c). LN/SACZ+ years presented weak anomalous con-vection over eastern Indonesia and over the Austral Subtropi-cal Convergence Zones (Fig. 2d). For LN/SACZ−, the
PSA-like wave pattern starts from Central Pacific and also goes to SA (Fig. 2e). A PSA-like wave pattern emanating from In-donesia to SA was observed in LN/SACZ+ events (Fig. 2f).
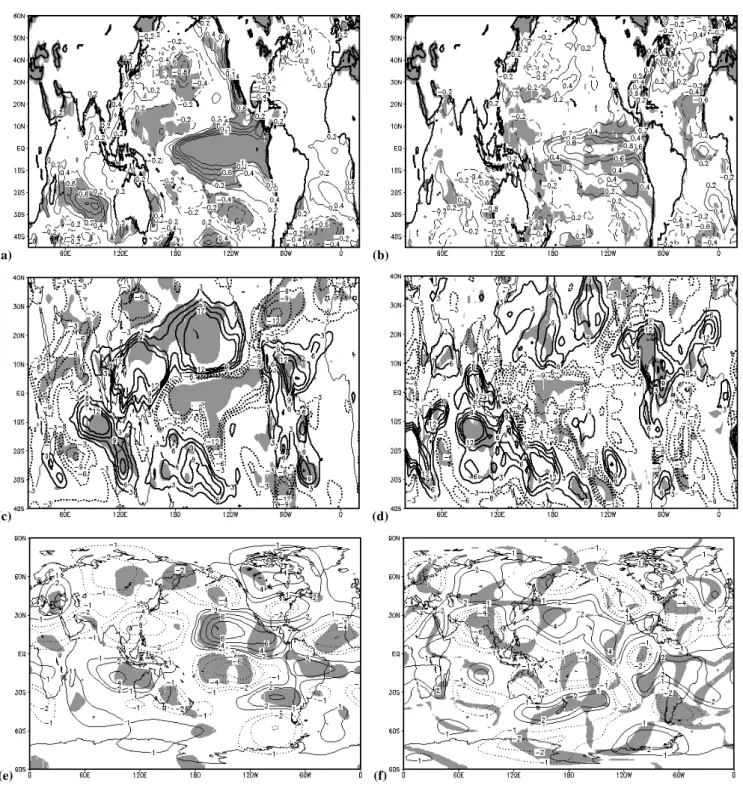
In EN events, EN/SACZ+ (−) years presented cold
(warm) SST anomalies over Southwestern Atlantic (Figs. 3a and b for EN/SACZ−and EN/SACZ+). Warm SST
(a) (b)
(c) (d)
(e) (f)
Fig. 2. (a)Composite of DJF SST anomalies (◦)for the SACZ−/LN episodes;(b)the same as (a), for SACZ+/LN. The interval between the isolines is 0.2◦C;(c)the same as (a), for OLR anomalies (Wm−2);(d)the same as (c), for SACZ+/LN. The interval between the isolines is 3 Wm−2.;(e)the same as (a) for 200 hPa anomalous zonally assimetric streamfunction component (×106m2s−1);(f)the same as (e), for SACZ+/LN. The absolute values of the isolines are 0,5; 1; 2; 4: 6×10⁶m2s−1. The continued (dotted) isolines are associated with positive (negative) anomalies and the shaded areas indicate statistically significant anomalies at the 90% level.
4 Conclusions
This work aims in studying the inter ENSO SST and atmo-spheric circulation variability related to the low frequency South American dipole precipitation mode of variability
(a) (b)
(c) (d)
(e) (f)
Fig. 3. (a)Composite of DJF SST anomalies (◦)for the SACZ−/EN episodes;(b)the same as (a), for SACZ+/EN. The interval between the isolines is 0.2◦C;(c)the same as (a), for OLR anomalies (Wm−2);(d): the same as (c), for SACZ+/EN. The interval between the isolines is 3 Wm−2;(e)the same as (a), for 200 hPa anomalous zonally assimetric streamfunction component (×106m2s−1);(f)the same as (e), for SACZ+/EN. The absolute values of the isolines are 0,5; 1; 2; 4: 6×10⁶m2s−1. The continued (dotted) isolines are associated with positive (negative) anomalies and the shaded areas indicate statistically significant anomalies at the 90% level.
Power spectrum analysis of the PC temporal series in-dicated that the interannual variability of the precipitation dipole seems to be related to the low-frequency part of ENSO (a peak with a period of 3.5 years) and to the quasi-biennial component of ENSO variability (another peak with a
pe-riod of 2 years). Although the classification of the selected episodes according to the occurrence of ENSO episodes showed that most of the SACZ+ events occurred during LN episodes and the majority of SACZ− events happened in
Table 1.Anomalous patterns related to precipitation dipole phases that occurred during La Ni˜na events.
La Ni˜na
SACZ− SACZ+
Negative SST anomalies over Central Equatorial Pacific and positive anomalies over Eastern Indonesia;
Weaker negative SST anomalies displaced toward Eastern Equatorial Pacific and there are no positive anomalies over In-donesia;
Anomalous precipitation over Indonesia and drought condi-tions over Central Pacific;
Anomalous precipitation over Eastern Indonesia;
PSA-like pattern emanating from Central Pacific towards South America
PSA-like pattern emanating from Indonesia towards South America
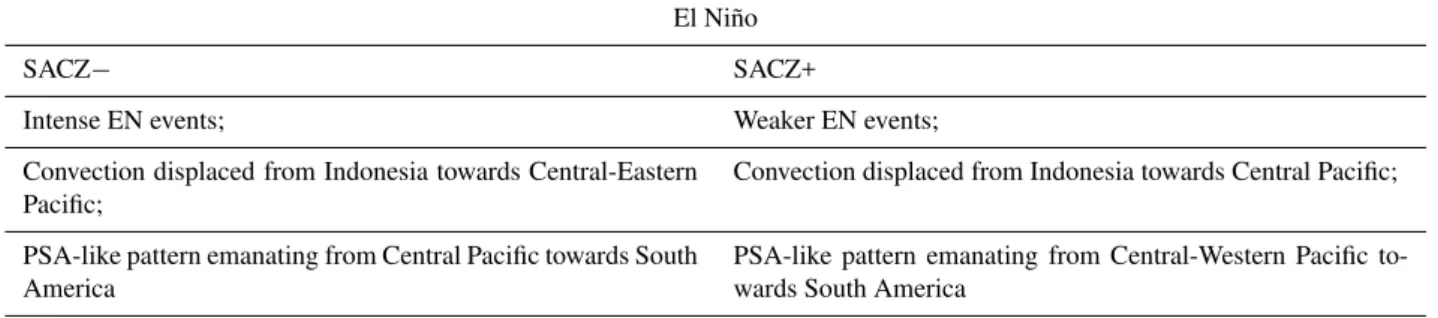
Table 2.Anomalous patterns related to precipitation dipole phases that occurred during El Ni˜no events.
El Ni˜no
SACZ− SACZ+
Intense EN events; Weaker EN events;
Convection displaced from Indonesia towards Central-Eastern Pacific;
Convection displaced from Indonesia towards Central Pacific;
PSA-like pattern emanating from Central Pacific towards South America
PSA-like pattern emanating from Central-Western Pacific to-wards South America
EN episodes and vice-versa. The results suggest that the displacement of the convection along the equatorial Pacific ocean can modulate the seesaw pattern over the Southeast of South America. The Tables 1 and 2 summarize the main anomalous patterns observed in both dipole phases during ENSO events.
Acknowledgements. The authors would like to thank the FAPESP in providing financial support through the projects 01/06842-6 and 01/13816-1, CNPq (302459/2002-2), IAI (CRN-055), CIIFEN.
Edited by: P. Fabian and J. L. Santos
Reviewed by: J. L. Santos and another anonymous referee
References
Chen, M., Xie, P., Janowiak, J. E., and Arkin, P. A.: Global land precipitation: A 50-yr monthly analysis based on gauge observa-tions, J. Hydrometeor, 3(3), 249–266, 2002.
Grimm, A. M., Ferraz, S. E. T.,and Gomes, J.: Precipitation anoma-lies in southern Brazil associated with El Ni˜no and La Ni˜na events, J. Climate, 11, 2863–2880, 1998
Kalnay, E., Kanamitsu, M., Kistler, R., et al.: The NCEP/NCAR 40-year Reanalysis Project, Bull. Amer. Meteo. Soc., 77(3), 437– 471, 1996.
Mo, K. C.: Relationships between low-frequency variability in the Southern Hemisphere and sea surface temperature anomalies, J. Climate, 13, 3599–3610, 2000.
O’Lenic, E. A. and Livezey, R. E.: Practical Considerations in the Use of REOF Analysis in Diagnostic Studies of Upper-Air Height Fields, Mon. Wea. Rev., 116, 1682–1689, 1988. Paegle, J. N. and Mo, K. C.: Linkages between summer
rain-fall variability over South America and sea surface temperature anomalies, J. Climate, 15(12), 1389–1407, 2002.
Reynolds, R. W. and Smith, T. M.: Improved global SST analyses using optimum interpolation, J. Climate, 7, 929–948, 1994. Trenberth, K. E.: The definition of El Ni˜no, Bull. Amer. Meteo.