ISSN 2393-4913, ISSN On-line 2457-5836
Competition versus Efficiency: What Drives B
anks’
Spreads in Italian Banking System?
Luca Giordano1, Antonio Lopes2
1International Organization of Securities Commission, Spain, Madrid, E-mail:[email protected]
2Seconda Università di Napoli, E-mail: [email protected]
Abstract Economists have long debated the relationships between market structure of banking sector and the profitability. General consensus asserts that more concentrated market is associated with higher profitability: banks with higher market share generally achieve higher profits. This empirical evidence can however hinge on two opposite explanations: in the first case banks increase their market share (via mergers and acquisitions) in order to exploit the resulting stronger market power and impose higher prices to their clients; the second explanation tells that more cost-efficient banks are able to lower the prices applied to their clients and therefore to gain new clients and finally enlarge their market share. In both cases there is a positive link between market share and profitability, but in the former what actually plays a crucial role is a non-competitive force (Relative Market Power Hypothesis, henceforth RMP), in the latter the relationship is driven by the greater efficiency of banks which enlarge their market share by reducing prices (X-Efficiency Hypothesis, ESX). We run a 4-years panel data analysis (2008-2011) in order to disentangle the above alternatives hypothesis (RMP versus ESX) for the Italian market. First we estimate the cost efficiency for a sample of more than 200 banks by applying the Stochastic Frontier Analysis (SFA). In the second step we regress bank spreads on efficiency scores and market structure variables in order to identify which process leads the price setting of Italian banks. Difference in the legal organization of bank (mutual, cooperative, and commercial banks) and type of business relationships established are controlled for.
Key words Bank, spreads, market structure, cost efficiency, stochastic frontier analysis
JEL Codes: G21 – L22
1. Introduction
Many studies, using different methodologies, have tried to quantify the overall impact of changes in market structure and bank efficiency on bank spreads. This paper uses balance sheet data for a sample of more than 200 Italian banks to investigate the effect of competition and efficiency on bank spreads. We test two alternative hypotheses: the relative-market power (RMP) and the X-efficiency hypothesis (ESX).
Relative market power hypothesis claims that mergers could be motivated by the ability to affect prices unfavourably for borrowers (by applying higher loan interest rate) and/or for depositors (by applying lower deposit interest rate): as a result the market will experience increased margins (the difference between active and passive interest rate, henceforth spread). The X-efficiency hypothesis, on the contrary, states that mergers and acquisitions are the result of a superior cost efficiency of some banks that can lower prices and earn new clients (therefore enlarging their market share): as a result they improve the overall welfare. Hence, these two different hypothesis call for different actions by the competition authorities, both at the national and European level, which are responsible for merger and competition cases with an EU dimension.
The relative-market power hypothesis (RMP) claims that only banks with large market shares, irrespective of market concentration, are able to exercise market power and earn abnormal profits1. The X-efficiency (ESX) version asserts that banks with superior
management or production technologies have lower marginal costs. As a result, they simultaneously reap higher profits and gain larger market shares (by shifting the cost advantages to their customers via lower lending rates).
Our paper investigate the pass-through effects of market structure and bank efficiency on bank spreads: if an increase in bank efficiency causes a reduction in bank spreads we can conclude that the X-Eff version is at work, otherwise if it is an increase in market power (proxied by market share) that drives an increase in bank spreads2, the
relative market power prevails.
Knowledge of the essential drivers of bank spreads is important for antitrust authorities, who are looking for algorithms to assess the trade-off between the value-enhancing effects of mergers and acquisitions and their potentially negative impact on competition. The relative-market-power hypothesis and the structure-conduct-performance paradigm claim that mergers could be motivated by the ability to affect prices unfavourably for customers (thereby eroding consumer surplus) and to increase margins. The efficiency hypothesis, in contrast, states that mergers and acquisitions improve overall welfare.
1 This hypothesis refers to the traditional structure-conduct-performance (SCP) paradigm which
states that the positive relationship between profit and market structure reflects non-competitive pricing behaviour in more concentrated markets.
Therefore the market-power hypothesis has radically contrasting implications from the X-efficiency hypothesis for merger and antitrust policy. To the extent that the relative market power hypothesis is correct, mergers may be motivated by the desire to set
prices that are less favourable to consumers/borrowers, which would increase banks’
profits at the expenses of consumer welfare. To the extent that the X-efficiency hypothesis is correct, these mergers may be led by more efficient banks which are able to translate their superior efficiency to consumers. Thus, advocates of the relative market power hypotheses tend to see antitrust enforcement as socially beneficial, while X-efficiency advocates tend to see policies that inhibit mergers as socially costly. From an empirical viewpoint what has emerged in the past studies is a strong linkage
between market structure (however it is measured) and banks’ profitability: that is a
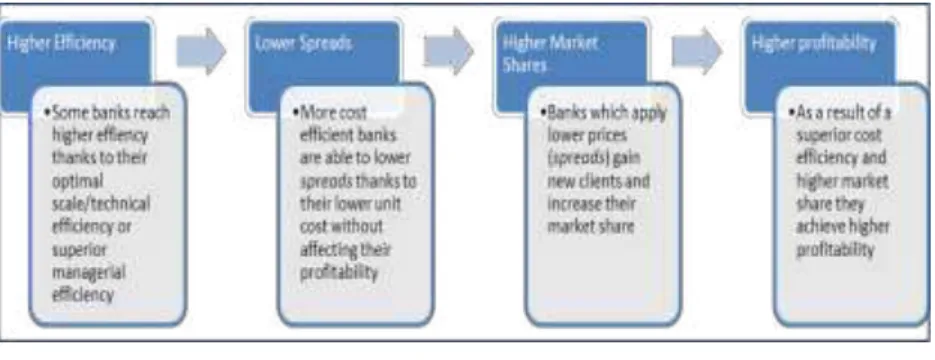
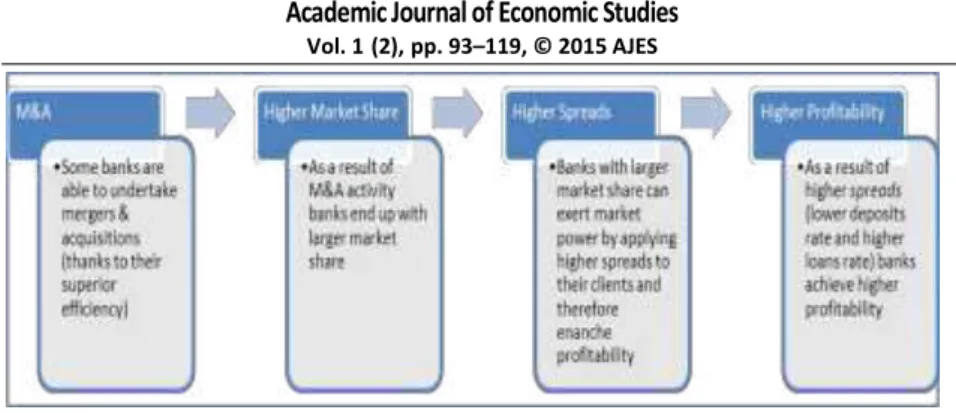
positive profit-structure relationship. Both MRP and X-Eff hypothesis are compatible with the above mentioned positive link between market structure and profitability; but while in the RMP case the market structure is treated as exogenous (SCP paradigm), in the X-Eff case the market structure itself is endogenous and is a result of the intrinsic banks efficiency which leads the whole process (figure 1 and figure 2). These theories have been tested in numerous previous studies using both banking and inter-industry data without a consensus arising. The results have been difficult to interpret because efficiency variables, particularly X-efficiency or managerial efficiency measures, have generally been excluded from the analyses. The existing literature cannot distinguish among the various hypotheses without including direct measure of X-efficiency.
Figure 1. X-Efficiency Hypothesis (ESX)
Figure 2. Relative Market Power Hypothesis (RMP)
2. Market structure and performance
Many studies in the banking literature find a positive statistical relationship between profitability and measures of market structure – either concentration or market share. On first blush, this may suggests that the past wave of mergers and acquisitions in the banking industry was motivated by the expected benefits stemming from greater market power due to the increased market concentration or larger market shares of the merging banks.
Four hypotheses are typically postulated as potential drivers of a positive relationship between market structure and bank performance (Stigler, 1964; Demsetz, 1973; Berger, 1985). First, the traditional structure-conduct-performance paradigm (SCP) states that the positive relationship between profit and market structure reflects non-competitive pricing behaviour in more concentrated markets. Second, the relative-market-power hypotheses (RMP) claims that only banks with large market shares, irrespective of market concentration, are able to exercise market power and earn abnormal profits. The third and fourth hypotheses share the idea that efficiency may account for the relationship between concentration, market share and profitability. That is, any observed relationship between market structure and performance is a spurious correlation driven by bank efficiency. The X-efficiency version (ESX) asserts that banks with superior management or production technologies have lower marginal costs. As a result, they simultaneously reap higher profits and gain larger market shares, by passing cost advantages to their customers via lower lending rates. The scale-efficiency version (ESS) assumes that some banks operate at a more efficient scale than others. These banks may experience cost and/or revenue advantages, leading to lower unit costs and higher profits. Due to lack of robust empirical support, there exists, however, no general consensus about the validity and the relative importance of these competing hypotheses, neither for Europe nor the Italy.
(lower deposit rates, higher loan rates) in more concentrated markets as a result of competitive imperfections in these markets3. A related theory is the relative-market-power hypothesis (RMP), which asserts that only firms with large markets shares and well-differentiated products are able to exercise market power in pricing these products and earn supernormal profits (Shepherd, 1982).
In contrast to these two market-power theories, there are also two efficiency explanations of the positive relationship between profits and either concentration or market share, that is, of the positive profit-structure relationship. Under the X-efficiency version of the efficient-structure hypothesis (ESX), firms with superior management or production technologies have lower costs and therefore higher profits. These firms are also assumed to gain larger market shares that may result in high levels of concentration (Demsetz, 1973, 1974; Peltzam 1977)4. Here, the positive profit-structure
relationship is spurious, rather than of direct origin, with efficiency driving both profits and market structure. Under the scale-efficiency version of the efficient-structure hypothesis (ESS), firms have essentially good management and technology, but some firms simply produce at more efficient scales than others, and therefore have lower unit costs and higher unit profits. These firms are assumed to have larger market shares that may result in high levels of concentration, again yielding a positive profit-structure relationship as a spurious outcome (Lambson, 1987).
Many of the available studies regress profitability on concentration and/or market share and find similar results, but interpret them very differently. Some argue that the common finding of a positive dominating coefficient estimate for market share and an insignificant coefficient for concentration justifies acceptance of RMP, which relates market share to market power (Shepherd 1982; Rhoades 1985; Kurtz and Rhoades 1991). Others argue that this finding supports ESX, since market share may be positively related to efficiency under ESX, in the absence of any direct measure of X-efficiency in the equation (Smilrock, Gilligan and Marshall, 1984; Smilrock, 1985; Evanoff and Fortier,1988).
3 The SCP paradigm relates structure and conduct to performance. Performance in an industry is
explained from the conduct of firms; conduct depends on structural characteristics of the markets, such as the number of firms, entry requirements and cost and demand functions.
4 More efficient firms have greater market shares. This could occur in a number of different ways.
Other studies tested the RMP hypotheses alone by examining the price-concentration relationship, again without the benefit of efficiency variables. Prices are regressed against concentration and/or market share and a finding of less favourable prices for depositor/borrowers of banks in more concentrated markets – or with larger market shares – is taken as support for the appropriate RMP hypothesis (Hannan, 1991; Berger and Hannan, 1989). However, such tests are also problematic because the excluded efficiency variables may be correlated with both prices (interest rates) and market structure (proxied by concentration and/or market share). Under the ESX hypothesis, prices may be relatively favourable for consumers of banks in concentrated markets or with large market shares because of the excluded efficiency variables, so that the coefficients of concentration and/or market share in such price-equation may represent a net effect of the different hypothesis. An insignificant market structure coefficient cannot be used to distinguish between cases in which both the RMP and the ESX effects or neither are operative.
We try to resolve the observational equivalence problem here by estimating reduced forms that include direct measures of efficiency and nest the two hypotheses: i) in the ESX case, a superior cost efficiency allows banks to reduce spreads and hence achieve larger market share (attracting more customers), therefore the link between cost efficiency and spreads should be negative; ii) in the RMP case the process starts again with banks characterized by superior efficiency but these banks, instead of using this competitive advantage in reducing spreads, embark M&A activity and as a result enlarge their market share and exploit the resulting market power in charging higher spreads. Therefore in this case the causal link between cost efficiency and spreads should be positive.
3. Traditional Structure-Conduct-Performance Theory (SCP)
The SCP theory argues that higher concentration in the banking market causes less competitive bank conduct and leads to higher bank profitability (but lower performance from a social point of view). To test the SCP hypothesis, researchers typically regress a measure of bank performance, for example bank profitability, on a proxy for market concentration, that is, an n-bank concentration ratio or a Herfindahl-Hirschman Index (HHI). A representative regression specification equals:
Πijt= α0 + α1 CRjt+ Σk yk Xk,ijt + ijt (1)
where πijt is a measure of bank i’s profitability, in banking market j at time t, CRjt is the
measure of concentration in market j at time t, and Xk,ijt stands for a k-vector control
non-competitive behaviour or collusion. Hence, the SCP theory implies that α1 >0, that
is, higher market concentration implies more market power and higher bank profits. The market structure itself, however, is assumed to be exogenous. It is clear therefore that, from an empirical viewpoint, the RMP hypothesis directly derives from the SCP theory.
4. Efficiency Hypothesis Theory
The efficiency hypothesis theory provides an alternative explanation for the positive link between bank profitability and market structure (as usual proxied by concentration and/or market share). The efficiency hypothesis (see Demsetz, 1973; Peltzmann, 1977) entails that more efficient banks will gain market share. Hence market structure is driven (endogenously) by bank efficiency. Two types of efficiency can be distinguished (Berger 1995). In an X-efficiency narrative (ESX), banks with superior management and/or production technologies enjoy higher profits and as a result grow larger market share. Alternatively, some banks may produce at more efficient scale than others, again leading to higher per-unit profits, larger markets shares, and higher market concentration (ESS).
The positive relationship between market structure and performance reported in the SCP literature is therefore spurious in the two versions of the efficiency hypothesis, as both market structure and performance are led by efficiency. Initially, the empirical literature aimed to disentangle the SCP and efficiency hypothesis (either ESX or ESS version) through the following regression specification:
Πijt= α0 + α1 CRjt+ α2 MSijt + Σ yk Xk ijt + ijt (2)
with MSijt the market share of bank i in market j at time t.
SCP implies that α1>0, whereas both efficiency hypotheses (ESX and/or ESS) imply
that α2 >0. Most studies find a positive and statistically significant α2, but a α1 close to
zero and insignificant. These findings support both efficiency hypotheses, that is, larger market share go together with higher profitability.
A fundamental criticism levelled against the SCP and efficiency hypotheses relates to the embedded – assumed – one-way causality from market structure to performance. In other words, most SCP studies do not take into account the conduct of the banks in the market and the impact of banks performance on market structure5.
5. Market power, efficiency and bank spreads: the model
As stated before, market power and efficiency may influence many aspects of banking sector. A question of interest for policymakers and academics alike is the impact of
these factors on bank spreads – the difference between the rate charged to borrowers and the rate paid to depositors.
Spreads are commonly interpreted as a measure of the cost for financial intermediation (see Saunders and Schumacher, 2000; Brock and Rojas Suarez, 2000). High spreads can hinder the growth of savings and investment and imply that the cost of using the financial system may become prohibitive for certain borrowers.
While a problem of observational equivalence exists in interpreting the relation between bank concentration and profits, this issue should not arise in analyzing bank spreads. Relatively more efficient banks should be able to charge lower spreads, as a result of having lower costs, and via lower spreads to gain larger market share: it means that under the ESX hypothesis there is a negative relationship between spreads and market share. Conversely, a positive association between bank spreads and market share should signal greater market power and less competition in the banking industry (RMP hypothesis).
Interest rate spreads and net interest margins are widely considered as proxies for the efficiency of financial intermediation. High interest spreads are the results of market frictions such as transaction costs and information asymmetries (Stiglitz and Weiss, 1981). Intermediation costs associated with screening and monitoring borrowers and processing savings and payments services, and information asymmetries resulting in agency costs, create a wedge between the interest rate paid to savers and the interest rate charged to borrowers. The larger banking inefficiencies are, the higher spreads will be, which reduces the demand for and the benefits of financial intermediation.
Furthermore, the impact of high spreads is likely to be more severe for the so called «bank oriented system» where, given that market capital are generally small and under-developed, a larger percentage of firms and individuals tend to depend on banks to meet their financial needs.
Contemporary models employed in the literature for the analysis of interest margin determinants are based on the dealership model proposed in Ho and Saunders (1981). According to this model, banks are assumed to be risk-averse intermediators in the financial market, collecting deposits and granting loans. One of the factors influencing the size of the bank margin in this model is transaction uncertainty due to asymmetric arrival time of the supply of deposits and demand for loans. Another factor driving the optimal margin set by banks is the market structure, since the bank facing relatively inelastic demand for loans and supply of deposits is able to exercise market power and set greater margin (higher spreads).
6. The model
characteristics (the most important is X-efficiency), by estimating regression of the following form:
Spreadit = α0+ α1 BankMarketShareit+ α2 Liquidityit+ α3 AdmCostit + α4 NPLit + α5 Equityit + α6 Xeffit + it (3)
where i is the bank id and t refers to the time period considered.
Equation (3) is motivated by dealership model of bank spreads developed by Ho and Saunders (1981), extended by Allen (1988), Angbazo (1997), and others, and the firm-theoretical framework developed by Zarruck (1989) and Wong (1997). Both models predict that operating costs, regulatory costs, credit risks, and the market structure of the banking sector can affect spreads.
In Equation (3), the variable Spreads is the difference between the implicit average interest charged on loans and the implicit average interest paid on deposits. In other words, the spreads is calculated by taking the total interest received by banks on loans during one year divided by the average loans for that period and subtracting from it the total interest paid on deposits through the year divided by average deposits.
Liquidity is measured as the ratio of liquid to total assets. Liquid assets refer to cash and deposit balances in other banks (including reserve requirements at the central bank). High liquidity ratios, either self-imposed for prudential reasons or as result of regulation (e.g., reserve or liquidity requirements), inflict a cost on banks since they have to give up holding higher-yielding assets. To the extent that banks are able to transfer this opportunity cost to borrowers, spreads will rise with liquidity ratios.
Administrative Costs refer to the ratio of administrative expenses (including payroll and overhead) to average assets. If banks incur high administrative costs in the process of providing their services as intermediaries, they are likely to increase the spread they charged their customers.
NPLs is the ratio of non-performing loans to total loans. This variable is intended to capture credit risk. Faced with higher credit risk, banks are likely to charge higher rates on their loans, as equity holders demand risk-adjusted returns.
Equity refers to the share of bank equity to total assets. Holding large equity ratios either on a voluntary basis or as a result of regulation can be costly for banks. We would expect bank spreads to rise with this variable.
BankMarketShare is the ratio of each bank’s loans to total system loans. To the extent
that market shares get translated into market power, banks with higher market share may be able to charge higher rates on loans (RMP hypothesis,α1 >0)6. On the other
6 In calculating the variable Bank Market Share for each bank in the sample we have divided the
hand, banks with larger market share could be those which experienced higher cost efficiency and could have gained such market share by reducing spreads and, as a consequence, reached new clients (α1≤0). In other words, more efficient banks may be
able to pass some of the benefits of their higher efficiency to their customers in term of lower spreads (ESX).
Xeff represents the cost efficiency scores we get by running the SFA analysis. By adding this variable in the same question which contains BankMarketShare we are able to disentangle the two countervailing hypothesis. If we find α6<0 it would mean that
banks with superior cost efficiency are able to reduce their spreads and therefore might be reasonable to conclude in favour of the ESX hypothesis. On the contrary, the coefficient α6≥0 (in conjunction with α1>0) is an indirect proof that RMP hypothesis is in
place: it means that banks do not translate their superior cost efficiency in lower spreads but instead use their competitive advantage to enlarge market share and enhance profits by applying higher spreads. All the hypotheses are summarized in the following table 1.
Table 1. Expected signs of coefficients
Coefficient values Theoretical Hypothesis
ESX
RMP
7. Estimation Stochastic Frontier Efficiency Model
In this section we apply the SFA (Stochastic Frontier Analysis) in order to get the cost efficiency scores (Xeff) that will be used as dependent variable in the second-step panel regression procedure (equation 3).
Originally proposed by Aigner et al. (1977), Meeusen and van den Broeck (1977) and Battese and Corra (1977), the estimation of stochastic frontiers represents a well-established empirical tool, widely employed in the last three decades by scholars interested in efficiency analysis.
The basic idea is the following. Given I producers each using X Є RN+ inputs to produce a scalar output Y Є R+, a frontier production model takes the following generic form:
Yi = F(Xi; β) exp (vi - ui) (4)
where β is the vector of unknown parameters to be estimated that characterize the structure of the technology. F(Xi; β) defines a deterministic production frontier common
to all I producers and the random error term vi captures the effect of (producer-specific)
external shocks on observed output Yi. The stochastic production frontier F(Xi; β) exp
(vi) defines the maximum feasible output in an environment characterized by the
presence of either favourable or unfavourable events beyond the control of producers (vi). The error term ui≥0 is introduced in the model in order to capture shortfalls of Yi
from F(Xi; β) exp (vi) due to technical inefficiency.
In the classical approach ui is therefore the residual non-negative random variable
which measures the inefficiency of production process after disentangling the stochastic error, assuming that it is independently and identically distributed:
ui ~N+(σ2u).
In our estimate we follow the approach firstly proposed by Battese and Coelli (1995) which consists in the assumption that inefficiency component, ui in the model, is not
identically distributed for all units observed and all the time, but instead follows a truncated normal distribution, the mean of which varies from unit to unit and from year to year, depending on a series of explanatory variables zit. Therefore ui is obtained
through zero truncation of a normal distribution with mean zit and variance σ2u; zit is a
vector (1xm) of explanatory variables associated to the mean inefficiency levels of the different economic units observed over time; is a vector (mx1) of coefficients to estimate: ui ~N+ (zi ; σ2u).
We estimate a Translog cost function (Caves and Christeensen, 1980) with three outputs (y) and three inputs (x). The outputs are: commercial loans (y1, interbank loans
(y2) and other financial assets (y3). The input are: collected funds (x1), deposits (x2) and
the average number of workers employed (x3). The corresponding prices of inputs
needed for the estimation of the cost function are: price of collected funds (w1), price of
deposits (w2) and price of labour (w3). We have included in the cost function alto the
time trend in linear (t) e quadratic form (tt) to take into account all the structural technological changes which determine Hicks's neutral frontier translation7.
7 Since the duality theorem requires the objective function to be homogenously linear in the input
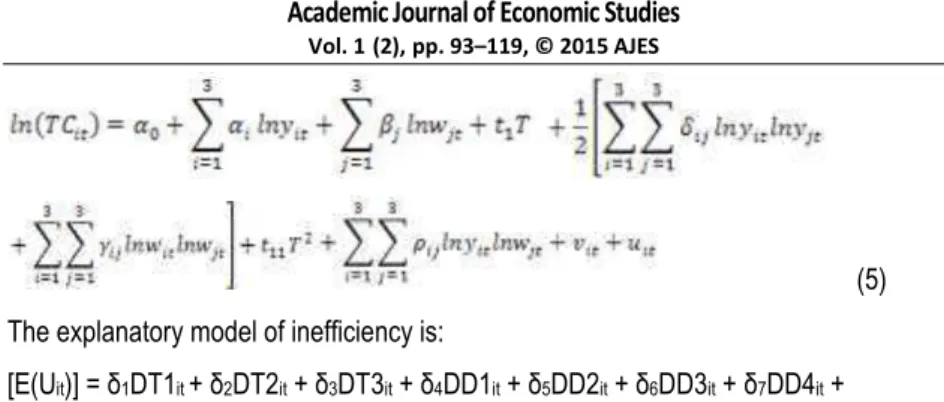
(5)
The explanatory model of inefficiency is:
[E(Uit)] = 1DT1it + 2DT2it+ 3DT3it+ 4DD1it+ 5DD2it+ 6DD3it+ 7DD4it +
+ 8DD5 + 9DG1it+ 10DG2it+ 11DG3it+ 12CIit (6)
In the specification of the inefficiency effects model (5) the following variables – which are thought to explain the distribution of inefficiency term ui– are used: the variables
DT1, DT2 and DT3 are dummies variables which assume value 1 when the banks are
respectively Commercial Banks (“Societa´ per Azioni”, SPA), Popular Banks (“Banche Popolari”, POP) and Cooperative Banks (“Banche di Credito Cooperativo”, BCC). The
variables from DD1 to DD5 refer to the dimension of banks in our sample and assume value 1 when they are Major, Big, Medium, Small or Minor. The variables DG1, DG2 and DG2 are those intended to convey impulses on bank efficiency stemming from the
environment in which banks operate. They concern the location of banks’ headquarter
and therefore assume value 1 for bank located in the North (DG1), in the Center (DG2) and in the South (DG3).
Table 2. Sample breakdown according to Size, Institutional Type and Headquarter location
SIZE Major Banks Big Banks Medium Banks Small Banks Minor Banks Total Sample
5 11 22 88 96 222
INSTITUTIONAL TYPE Spa Pop Bcc
106 19 97 222
LOCATION North Center South and Isles
138 45 39 222
Our panel is composed by observations taken from 222 Italian banks for four years (2008-2011). All the variables are built up by using official bank balance sheets and following the classical intermediation approach to the bank production function (Berger
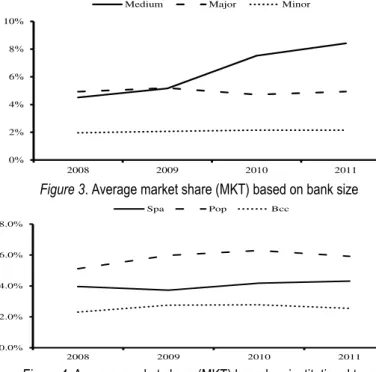
et al., 1986). In the following table is reported the sample breakdown according to the size, the bank institutional organization and the headquarter location respectively. Figure 3 refers to the variable Bank Market Share (MKT) and shows that market share of medium size banks has experienced a steadily increase from 2008 – when it was equal to 4.51% – to 2011 when it peaked to 8.42%. Major Banks didn’t move in the sample period and flattened to the initial value of average market share equal to 4.93%. Minor banks hold a residual average market share which increased slightly from 1.96% in 2008 to 2.15% in 2011.
Average market share of Popular banks (POP) rose from 5.12% in 2008 to 6.29% in 2010 and then dropped to 5.92% in the last year (2011), showing the highest average market share among the three institutional types. Commercial banks (SPA) record a quite constant market share (4%) which mirrors those of major banks, revealing a high degree of overlapping between the two samples. Cooperative banks lag behind with an average market share around 2.5%, still declining a bit in the last year of our analysis (from 2.78% in 2010 to 2.55% in 2011) (figure 4).
0% 2% 4% 6% 8% 10%
2008 2009 2010 2011
Medium Major Minor
Figure 3. Average market share (MKT) based on bank size
0.0% 2.0% 4.0% 6.0% 8.0%
2008 2009 2010 2011
Spa Pop Bcc
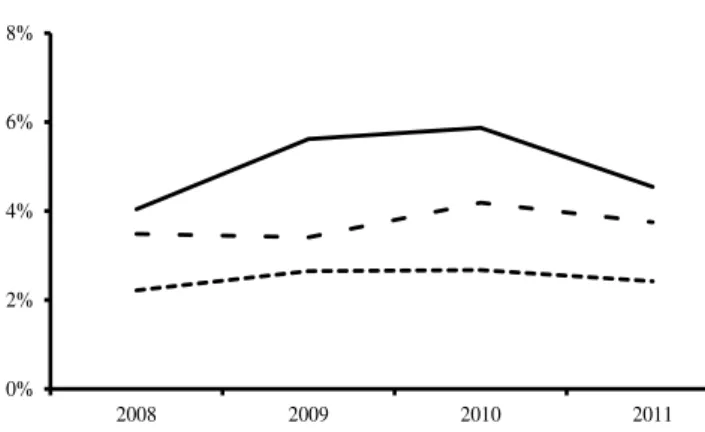
As for the geographical characteristics of the banking market, we see that the macro-area South and Isles shows the highest level of market concentration with an average level of market share equals to 4.54% in 2011, slightly decreasing from 5.87% in 2010. The Central Italy, after a small decrease from 2008 (3.49%) to 2009 (3.41%), has rebounded to 4.19% in 2010 and then fell back to 3.75% in 2011. The North seems to be the most competitive area with an average market share which has never reached the upper bound of 3% (figure 5). This evidence matches with the structural reforms
which have involved the Italian banking system during the ‘90s and that have led to a
sharp plunge in the number of banking institutions operating in the southern Italy; according to Bank of Italy data, in 1995 in the Southern Italy were located 278 banks corresponding to 28.5% of all Italian banks, twenty years later in the South there are only 121 banks accounting for 18.2% of the total.
0% 2% 4% 6% 8%
2008 2009 2010 2011
North Center South and Isles
Figure 5. Average market share (MKT) based on headquarter location
81.88
13.95
1.993 1.449 .7246
0
20
40
60
80
0 .05 .1 .15 .2 .25
Market Share
North Italy
Percentile Distribution of Market Share (MKTP)
Figure A1. Distribution of MKTP (%) in the North
51.28
26.92
12.82
1.282 5.769
.641 .641 .641
0
10
20
30
40
50
0 .2 .4 .6 .8
Market Share South and Isles
Percentile Distribution of Market Share (MKTP)
Figure A2. Distribution of MKTP (%) in the South and Isles
8. Results of efficiency scores
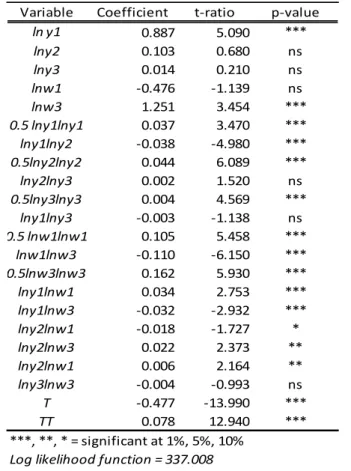
Table A1shows the parameters and the related statistical tests of the estimated cost functions (Equation 5) following the Battese and Coelli (1995) approach8.
8 Note that the estimated parameters of cost function showed in table A1 are not equivalent to
With regard to the impact of the efficiency explanatory variables9 (Equation 6) reported
in Table 3, we find that the coefficient ( ) of the dummy variable related to commercial
banks (Spa) is positive (+2.31), meaning that it affects positively the distribution of inefficiency component ui: hence, to be a commercial bank shifts to the right the mean
under which is centred the distribution of inefficiency variable. The economic interpretation might be that commercial banks usually are involved in providing a wide range of products and services ranging from the traditional intermediation of funds (collecting deposits and granting loans) to the most sophisticated trading in structured-derivative financial products or other multi-channels investment bank activities. This multi-output production function generally entails a complex organizational structure that can contribute to increase diseconomies of scope. For dummy variables related to popular (Pop) and cooperative banks (Bcc) we do not find any significant effect on cost efficiency.
While the analysis of the dummy variables related to the Institutional type has highlighted the existence of some degrees of diseconomies of scope, the coefficients attached to the Size show that could be the case for not negligible scale economies. Indeed, when we look at the dummy variables related to the bank size we find that for medium, small and minor banks the coefficient is significant and positive (meaning that it increases the cost inefficiency), while it is negative and significant for larger banks (reducing cost inefficiency). This means that smaller credit institutions cannot take advantage of scale economies in reducing production costs10. The dummy variables
concerning headquarter location show that the parameters corresponding to Central and Southern Italy are positive and significant, meaning that for these banks the distribution of inefficiency component encompasses higher values than the distribution of inefficiency for banks located in the North; in other words, a more problematic macroeconomic environment affects negatively banks operating in those regions – increasing the production cost for fixed level of output – and leads to lower cost efficiency levels.
presence of cross-products. Consequently, the interpretation of the signs of the parameters must be cautious (Berger and Mester, 1987).
9 We have performed the LR Test (see table A1 in the Appendix) for the joint nullity of the
parameters of the inefficiency effect model and we have rejected the null hypothesis with a confidence level of 99% (Kodde and Palm, 1986).
10 Therefore the correct interpretation of the signs is as follows: negative sign means that the
Table A1. Translog Cost Function parameters
Variable Coefficient t-ratio p-value
ln y1 0.887 5.090 ***
lny2 0.103 0.680 ns
lny3 0.014 0.210 ns
lnw1 -0.476 -1.139 ns
lnw3 1.251 3.454 ***
0.5 lny1lny1 0.037 3.470 ***
lny1lny2 -0.038 -4.980 ***
0.5lny2lny2 0.044 6.089 ***
lny2lny3 0.002 1.520 ns
0.5lny3lny3 0.004 4.569 ***
lny1lny3 -0.003 -1.138 ns
0.5 lnw1lnw1 0.105 5.458 ***
lnw1lnw3 -0.110 -6.150 ***
0.5lnw3lnw3 0.162 5.930 ***
lny1lnw1 0.034 2.753 ***
lny1lnw3 -0.032 -2.932 ***
lny2lnw1 -0.018 -1.727 *
lny2lnw3 0.022 2.373 **
lny2lnw1 0.006 2.164 **
lny3lnw3 -0.004 -0.993 ns
T -0.477 -13.990 ***
TT 0.078 12.940 ***
***, **, * = significant at 1%, 5%, 10%
Log likelihood function = 337.008 LR test of the one-sided error = 727.753
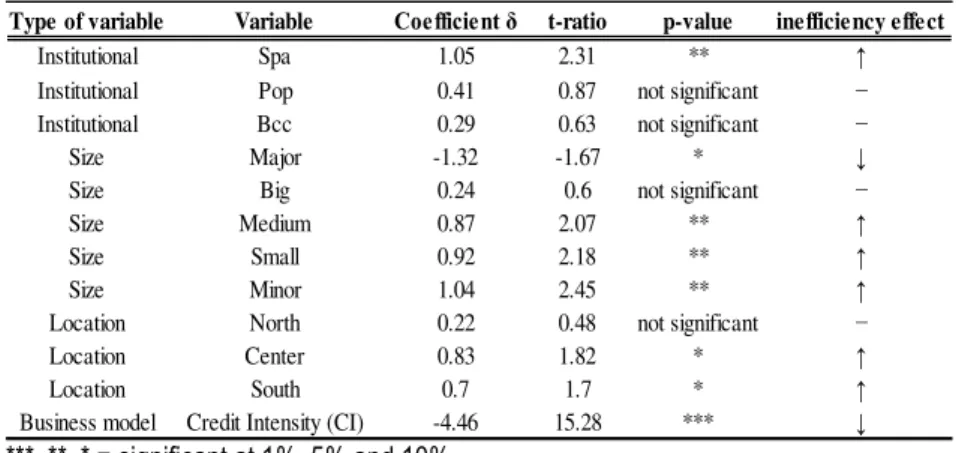
Table 3. Explanatory variables of inefficiency distribution
Type of variable Variable Coefficient δ t-ratio p-value inefficiency effect
Institutional Spa 1.05 2.31 ** ↑
Institutional Pop 0.41 0.87 not significant − Institutional Bcc 0.29 0.63 not significant −
Size Major -1.32 -1.67 * ↓
Size Big 0.24 0.6 not significant −
Size Medium 0.87 2.07 ** ↑
Size Small 0.92 2.18 ** ↑
Size Minor 1.04 2.45 ** ↑
Location North 0.22 0.48 not significant −
Location Center 0.83 1.82 * ↑
Location South 0.7 1.7 * ↑
Business model Credit Intensity (CI) -4.46 15.28 *** ↓
***, **, * = significant at 1%, 5% and 10%
Summing up the estimated parameters of explanatory variables of inefficiency distribution (table 3) we can conclude that: i) Commercial banks experience lower cost efficiency due to their institutional framework. A possible explanations could be that a wider production function (typical for commercial banks) entails a more complex organizational set up and this can lead to diseconomies of scope; ii) the larger the size (measured as logarithmic of total assets) the higher the cost efficiency. It reveals an expected positive effect of size on cost efficiency (presence of scale economies); iii) location matters: banks located in more disadvantaged macroeconomic environment (South and Center) perform lower cost efficiency; iv) banks more oriented toward traditional intermediation activity (proxied by higher ratio of commercial loans over earning assets) are those which experience superior cost efficiency compared to banks more engaged in new financial intermediation activities.
We complete this first–step regression estimation by showing cost efficiency scores (Xeff) as evolved between 2008 and 2011, dividing the sample of banks by Institutional Type, Size and Headquarter location.
company aimed at pursuing higher levels of efficiency, does not seem to find strong support from this empirical evidence11.
Table 4. Cost Efficiency (mean values) – Institutional Type
Year
Spa
Pop
Bcc
Overall
2008
78.34%
88.46%
88.30%
83.56%
2009
76.06%
87.89%
85.29%
81.11%
2010
76.40%
88.21%
85.62%
81.44%
2011
77.49%
88.21%
86.33%
82.27%
Overall
77.07%
88.19%
86.39%
82.09%
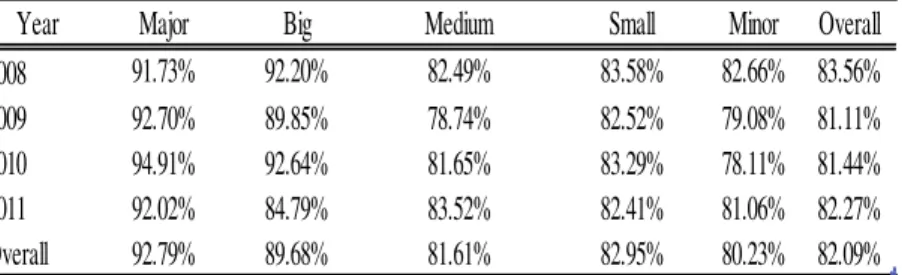
Table 5. Cost Efficiency (mean values) – Size
Year
Major
Big
Medium
Small
Minor
Overall
2008
91.73%
92.20%
82.49%
83.58%
82.66%
83.56%
2009
92.70%
89.85%
78.74%
82.52%
79.08%
81.11%
2010
94.91%
92.64%
81.65%
83.29%
78.11%
81.44%
2011
92.02%
84.79%
83.52%
82.41%
81.06%
82.27%
Overall
92.79%
89.68%
81.61%
82.95%
80.23%
82.09%
Table 5 shows that smaller banks have a lower average level of cost efficiency than the larger ones, thus confirming evidence on the existence of scale economies obtained by analyzing the explanatory variables of the inefficient model; this gap does not seem to close during 2008-2011 period and instead has slightly widened if we look at the opposite sides of size distribution (Major versus Minor). Except for Major and Medium banks, time would seem to exert a negative effect on cost efficiency: Big banks underwent a drop from 92.20% to 84.79%, Small banks declined from 83.58% to 82.41% and Minor plunged to 81.06% from the initial value of 82.66%. The persistent
11 The recent banking crisis has brought into question the business model used by most large
problem of cost inefficiency for smaller banks may depend on their limited scale which prevents a rapid decline in the unit cost or the adoption of more efficient production methods.
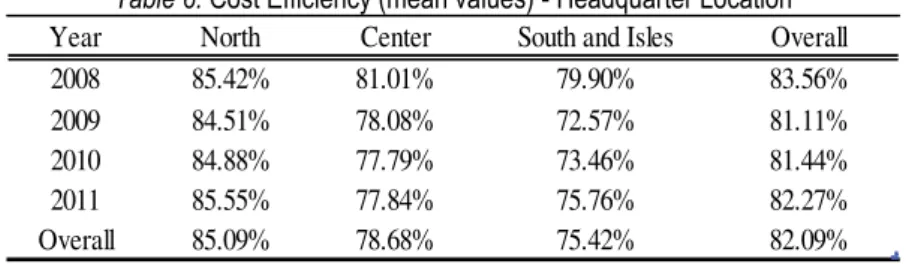
Lastly, table 6 shows a permanent gap in terms of cost efficiency unfavorable to Southern banks during the sample period; particularly with respect to Northern banks (the average differential is around 9.6% compared to Northern banks and 3.2% compared to Central banks). Results seem to confirm that it is not in place any process of convergence in the Italian banking system; with the banks located in the South that are still worsening their performance and enlarging the gap of efficiency from 2008 (5.50%) to 2011 (9.79%).
Table 6. Cost Efficiency (mean values) - Headquarter Location
Year North Center South and Isles Overall
2008 85.42% 81.01% 79.90% 83.56%
2009 84.51% 78.08% 72.57% 81.11%
2010 84.88% 77.79% 73.46% 81.44%
2011 85.55% 77.84% 75.76% 82.27%
Overall 85.09% 78.68% 75.42% 82.09%
As final remark we highlight that the time trend of cost efficiency reveals a general drop during the years of financial turmoil (2009-2010) and a slight rebound in the last year (2011). As for institutional type we find that even though there has been a bounce of cost efficiency in 2011 (overall the cost efficiency rose to 82.27% in 2011 from 81.44% in 2010), the average scores level has never regained the initial value (83.56% in 2008). Looking at the bank size, we find that Major Banks are the only ones which have not experienced a reduction in cost efficiency during crisis time, indeed for those banks cost efficiency raised from 91.73% in 2008 to 94.91% in 2010. Finally, as for the location, we see that Southern banks confirm their structural fragility, as they were hit more seriously than others banks at the onset of the financial crisis: the drop of efficiency from 79.9% to 72.57% has outpaced by far the decline suffered from banks located in the rest of the country.
9. Testing the two alternative hypothesis: ESX versus RMP
market power by applying higher active interest rate to borrowers and lower passive interest rate to depositors, hence widening the spread (RMP hypothesis – here the market power leads the process). We therefore use in this section the X-efficiency scores (Xeff) obtained in the previous one.
Table 7 presents results of the estimated coefficients of equation (3) obtained by running several alternative models12. We first perform the Hausman test in order to
choose fixed or random effects approach and we always accept the hypothesis that the individual effects are adequately modeled by a random-effects model.
Control variables are always significant (except in one case) and with the expected signs. NPL, which controls for the loans quality, positively contributes in heightening the
spreads (s is our dependent variable) charged by banks to their clients. It means that banks which operate with higher burden of non-performing loans are willing to set wider mark-up in order to cover higher costs stemming from higher default rate of their borrowers.
Liquidity has positive and highly significant coefficients in all models estimated and it means that the higher the share of liquid assets held by banks the higher will be the
spread they apply, in accordance with the hypothesis that higher share of liquid assets (cash and central banks deposits) implies that banks will incur in larger opportunity costs.
Equity measures the percentage of bank net worth (equity plus reserves) over total assets. Holding large equity ratio – either on a voluntary basis or as a result of regulation – could increase the average unit costs which banks incur in providing output, since it imposes a larger amount of expensive input (equity) for every fixed amount of output. This excessive cost burden could lead banks to transfer costs to their clients (via higher spreads) in order to enhance the targeted level of profitability.
AdmCost is an important variable because it proxies the traditional-balance sheet measure of bank efficiency, inasmuch as banks which structurally operate with higher level of administrative costs (in proportion of their total assets) are those that do not have the right skills in managing their inputs – or are likely to have a wrong designed and dysfunctional organization – and as a consequence devote a lot of resources in carrying out their activity. It is quite predictable that these banks are expected to apply higher interest rate in order to cover their major costs.
MKTP is always significant and positive: as a result of higher market power banks charge higher spreads and extract more surplus from depositors and borrowers. What
we are interested in is the joint interpretation of the εKTP’s coefficient and that one
related to Xeff.
12 We run panel model specification with Huber-White robust standard errors clustered at the
Table 7. Panel Random Effects Models Estimation robust against heteroskedasticity
While in model from (1) to (5) the Xeff variable is negative, although not significant, giving some clues in favor of the ESX hypothesis – more efficient banks tend to translate this higher competitiveness to the customers –, when we add the variable
AdmCost (model 6), which is a balance sheet related variable, we see that Xeff turns to be positive and significant. We interpret this sign shift as the fact that Xeff is better suited to measure the overall efficiency of banks in providing output and, by construction, it reflects both technical and allocative efficiency Farrell, 1957; Forsund, Lovell and Schmidt, 1980), while AdmCost is strictly related to the average weight of costs borne by banks.
Therefore in accordance with model (6) banks with superior cost efficiency (Xeff) are those more likely to charge higher spreads to their customers. It means that banks with superior technical and/or allocative efficiency, instead of using their competitive advantage in reducing spread, use it in achieving larger market share and consequently exploit the relative market power by widening the mark-up on deposit and loans (spreads).
In Table 8 we run some robustness checks in order to assess whether AdmCost and
Xeff do actually capture different aspects of efficiency and hence can be simultaneously used in the same equation. Our hypothesis is that AdmCost is a variable which merely refers to the average burden costs that banks sustain in providing their outputs. The higher the percentage of these costs (relating to total assets), the higher the spreads banks are willing to apply. On the contrary Xeff is the technical and allocative measure of efficiency which we get by applying a Stochastic Frontier Approach (SFA) and thus it encompasses a broader efficiency concept which
conjunction with AdmCost– is more suitable to be used for testing the ESX of RMP hypothesis as it gives information on the competitive advantage of banks, letting
AdmCost to give distinct insights on the cost management aspects of banking industry.
We see that in each model we’ve adopted when we add the AdmCost the sign of Xeff
parameter turns positive from negative and that in two of them it gets also significance (table 8).
Tabel 8 - Robustness Checks
Model (1) Model (1-bis) Model (2) Model (2 - bis) Model (3) Model (3- bis) Model (4) Model (4 - bis) Model (5) Model (5 - bis)
Xeff -0.004 0.007 (0.0048) (0.0052)
AdmCost 0.448
(0.1588)***
Xeff -0.003 0.007
(0.0045) (0.0049)
NPL 0.235 0.215
(0.1036)** (0.1022)*
AdmCost 0.435
(0.1557)***
Xeff -0.004 0.007
(0.0044) (0.0051)
NPL 0.233 0.214
(0.1026)** (0.1016)**
Liquidity 0.242 0.239
(0.0796)*** (0.071)***
AdmCost 0.428
(0.157)***
Xeff -0.002 0.01
(0.0049) (0.0057)*
NPL 0.236 0.219
(0.1031)** (0.1022)**
Liquidity 0.246 0.245
(0.0797)*** (0.0709)***
Equity 0.001 0.0038
(0.0019) (0.0021)*
AdmCost 0.451
(0.1592)***
Xeff -0.003 0.009
(0.0049) (0.0056)*
NPL 0.24 0.223
(0.1026)** (0.1016)**
Liquidity 0.2379 0.237
(0.0785)*** (0.0695)***
Equity 0.0021 0.004
(0.0019) (0.0021)*
MKTP 0.022 0.022
(0.0126)* (0.0121)*
AdmCost 0.452
(0.1581)***
***, **, * = significant at 1%, 5% and 10%
Interestingly we also notice that Cooperative banks tend to set lower spreads compared to Commercial ones and banks located in the South and Isles seem to charge wider spreads on their customers (table 9). At the opposite, for banks located in the North we find that a coefficient of the dummy variable is negative and highly significant (-0.013).
Taken together these results confirm that banks which have performed better in the past – those with higher efficiency – are more likely to rise the interest spread and as a consequence experience higher profitability on the intermediation of funds between depositors and borrowers. Hence it seems that banks use their superior efficiency in order to enhance market power instead of lessening price conditions. One possible explanation is that they exploit competitive advantage in order to achieve larger market share and consequently exert the resulting market power.
We repeat the regression exercise using lagged efficiency variable (Xefft-1) as well as
dummy variables for institutional type (Spa and Bcc) and headquarter location (North,
South and Isles). The relationship between spread and efficiency holds (table 9). However, saying that banks more efficient use their market power in order to increase interest spreads does not answer to the question on which component is moving: indeed it could be that spreads rise due to increasing interest rate paid by borrowers or due to slumping interest rate paid to depositors. Disentangling the leading parts behind the interest spread is beyond the aim of this paper.
10.Conclusions
The market-power (RMP) hypothesis has radically contrasting implications from the X-efficiency hypotheses (ESX) for merger and antitrust policy. To the extent that RMP hypotheses is correct, mergers may be motivated by desires to set prices that are less favourable to consumers, which would decrease total consumer plus producer surplus. To the extent that ESX hypothesis is correct, these mergers may be motivated by efficiency considerations that would lessen spreads and increase total surplus. Thus, advocates of the RMP hypotheses tend to see antitrust enforcement as socially beneficial, while ESX advocates tend to see policies that inhibit mergers as socially costly.
In this paper we implemented test that distinguishes among these alternative hypotheses. To the best of our knowledge this test has been usually addressed by using a balance-sheet variable as a proxy for efficiency motivations while we tackle with a disentangle procedure by adopting an econometric measure of efficiency which reflects at the same time technical and allocative efficiency and thus mirrors a wider
concept of banks’ competitive advantage.
In accordance with theoretical assumptions we find that banks with (i) worsen loans quality, (ii) more capitalized, (iii) which incur in higher administrative costs and (iv) with larger share of liquid assets, are more likely to apply higher spreads.
We also find that market share and banks cost efficiency positively affect spreads, leading us to accept the Relative Market Power (RMP) hypothesis for the Italian banking system: it seems that Italian banks empowered with superior efficiency – instead of reducing prices – tend to use their competitive advantage in order to achieve larger market share and then exploit the resulting market power by widening spreads charged to customers.
References
Aigner, D., K.C. δovell, C.P. Schmidt (1977), “Formulation and estimation of stochastic
frontier production function models”, Journal of Econometrics, 6: 21-37.
Allen, δ. (1988), “The Determinants of Bank interest εargins: A Note”, The Journal of
Financial and Quantitative Analysis, 23: 231-235.
Angbazo, δ. (1997), “Commercial bank net interest margins, default risk, interest rate risk, and off balance sheet banking”, Journal of Banking and Finance, 21: 55-87. Battese, G.E., T.J. Coelli (1995), “A model for technical inefficiency effects in a
Battese, G.E., G.S. Corra (1977), “Estimation of a Production Frontier εodel: With
Application to the Pastoral Zone of Eastern Australia”, Australian Journal of Agricultural Economics, 21: 169-I79.
Berger, A.N., G. Hanweck, D. Humphrey (1986), “Competitive viability in banking: scale, scope and product mix economies”, Working Paper, Board of Governors of the Federal Reserve System.
Berger, A.N., T. Hannan, (1989), “The Price-Concentration Relationship in Banking”, The Review of Economics and Statistics, 71: 291-299.
Berger, A.N. (1995),”The profit-structure relationship in banking–tests of market-power and efficient-structure hypotheses”, Journal of εoney, Credit and Banking, 27(2): 404– 431.
Berger, A.N., R.S. Demsetz, P.E. Strahan (1999), “The consolidation of the Financial
services industry: Causes, consequences, and implications for the future”, Journal of Banking & Finance, 23: 135-194.
Brock, P., δ. Rojas Suarez (2000), “Understanding the behavior of bank spread in δatin America”, Journal of Development Economics, 63: 113-134.
Butzbach, O., Kurt von Mettenheim (2014), (edited by), Alternative Banking and Financial Crisis, Pickering & Chatto, London.
Caves, D., δ. Christeensen (1980), “Flexible cost functions for multiproduct firms”
Review of Economics and Statistics, 62: 477-481.
Demsetz, H. (1973), “Industry Structure, εarket Rivalry, and Public Policy”, Journal of Law and Economics, 16: 1-9.
Demsetz, H. (1974), “Where is the New Industrial State?” , Economic Inquiry, Western
Economic Association International, 12(1): 1-12.
Evanoff, D., D. Fortier (1988), “Reevaluation of the Structure-Conduct-Performance
Relationship in Banking,” Journal of Financial Services Research, 1: 277-294.
Farrell, ε. (1957), “The measurement of productive efficiency”, Journal of Royal
Statistical Society, Series A, 120: 253-281.
Forsund, F., C.K. δovell, P. Schmidt (1980), “A survey of frontier production functions and of their relationship to efficiency measurement”, Journal of Econometrics, 13(1): 5-25.
Hannan, T. (1991), “Bank commercial loan markets and the role of market structure:
evidence from surveys of commercial lending”, Journal of Banking and Finance, vol.
15(1): 133-149.
Ho, T., A. Saunders, (1981), “The Determinants of Bank Interest εargins: Theory and Empirical Evidence”, Journal of Financial and Quantitative Analysis, 4: 581-600.
Kodde, D.A., F. Palm (1986), “Wald Criteria for Jointly Testing Equality and Inequality Restrictions”, Econometrica, 54(5): 1243-1248.
Kurtz, R.D., S.A. Rhoades (1991), “A Note on the εarket Share-Profitability
Relationship”, Working Paper, Board of Governors of the Federal Reserve System. δambson, V. E. (1987), “Is the Concentration-Profit Correlation Partly an Artifact of Lumpy Technology?”,American Economic Review, American Economic Association, vol. 77(4): 731-33.
εeeusen, W., J. van den Broeck (1977), “Efficiency estimation from Cobb-Douglass
production functions with composed error”, International Economic Review, 18: 435–
444.
Mester, L.J. (1987), “A εultiproduct Cost Study of Savings and δoans”, Journal of Finance, 42: 423-445.
Peltzam, S. (1977), “The Gains and δosses from Industrial Concentration”, Journal of
Law and Economics, 20: 229-63.
Rhoades, S. A. (1985), “εarket Share as a Source of Market Power: Implications and
Some Evidence,” Journal of Economics and Business, 37: 343–365.
Saunders, A., δ. Schumacher (2000), “The determinants of bank interest rate margins:
an international study”, Journal of International Money and Finance, 19: 813--832.
Shepherd, W.G. (1982), “Economies of Scale and εonopoly Profits”, in: J. V. Craven
(edited by), Industrial Organization, Antitrust, and Public Policy, Kluwer Nijhoff, Boston. Smirlock, M., T. Gilligan, W. εarshall (1984), “Tobin's q and the Structure-Performance
Relationship”, American Economic Review, 74: 1051-1060.
Smirlock, ε. (1985), “Evidence on the Non Relationship between Concentration and Profitability in Banking”, Journal of εoney, Credit, and Banking, 17: 69-83.
Stigler, G.J. (1964), “A theory of oligopoly”, Journal of Political Economy, 72(1): 44-61.
Stiglitz, J.E., A. Weiss (1981), “Credit Rationing in εarkets with Imperfect Information”,
American Economic Review, 71: 393-410.
Wong, K.P. (1997), “On the determinants of bank interest margins under credit and
interest rate risk”, Journal of Banking and Finance, 21: 251-271.
Zarruck, E.R. (1989), “Bank margins with uncertain deposit level and risk aversion”,