BGD
4, 3343–3375, 2007Algal-bacterial competition for N and
P
T. Løvdal et al.
Title Page
Abstract Introduction
Conclusions References
Tables Figures
◭ ◮
◭ ◮
Back Close
Full Screen / Esc
Printer-friendly Version
Interactive Discussion
EGU
Biogeosciences Discuss., 4, 3343–3375, 2007 www.biogeosciences-discuss.net/4/3343/2007/ © Author(s) 2007. This work is licensed
under a Creative Commons License.
Biogeosciences Discussions
Biogeosciences Discussionsis the access reviewed discussion forum ofBiogeosciences
Competition for inorganic and organic
forms of nitrogen and phosphorous
between phytoplankton and bacteria
during an
Emiliania huxleyi
spring bloom
(PeECE II)
T. Løvdal1,∗, C. Eichner1,∗∗, H.-P. Grossart2, V. Carbonnel3, L. Chou3, and T. F. Thingstad1
1
Department of Biology, University of Bergen, Jahnebakken 5, P.O. Box 7800, 5020 Bergen, Norway
2
Leibniz Institute of Freshwater Ecology and Inland Fisheries, Department of Limnology of Stratified Lakes, Alte Fischehuette 2, 16775 Stechlin, Germany
3
Laboratoire d’Oc ´eanographie Chimique et G ´eochimie des Eaux, Universit ´e Libre de Bruxelles, Campus Plaine – CP 208, 1050 Brussels, Belgium
BGD
4, 3343–3375, 2007Algal-bacterial competition for N and
P
T. Løvdal et al.
Title Page
Abstract Introduction
Conclusions References
Tables Figures
◭ ◮
◭ ◮
Back Close
Full Screen / Esc
Printer-friendly Version
Interactive Discussion
EGU
∗present address: Department of Mathematics and Natural Sciences, Faculty of Science and
Technology, University of Stavanger, 4036 Stavanger, Norway
∗∗present address: Institute of Marine Research, P.O. Box 1870 Nordnes, 5817 Bergen, Norway
Received: 18 September 2007 – Accepted: 19 September 2007 – Published: 26 September 2007
BGD
4, 3343–3375, 2007Algal-bacterial competition for N and
P
T. Løvdal et al.
Title Page
Abstract Introduction
Conclusions References
Tables Figures
◭ ◮
◭ ◮
Back Close
Full Screen / Esc
Printer-friendly Version
Interactive Discussion
EGU
Abstract
Using15N and33P, we measured the turnover of organic and inorganic nitrogen (N) and phosphorus (P) substrates, and the partitioning of N and P from these sources into two size fractions of marine osmotrophs during the course of a phytoplankton bloom in a nutrient manipulated mesocosm. The larger size fraction (>0.8µm), mainly consisting 5
of the coccolithophoridEmiliania huxleyi, but also including an increasing amount of large particle-associated bacteria as the bloom proceeded, dominated uptake of the inorganic forms NH+4, NO−
3, and PO 3−
4 . The uptake of N from leucine, and P from ATP
and dissolved DNA (dDNA), was initially dominated by the 0.8–0.2µm size fraction, but shifted towards dominance by the >0.8µm size fraction as the system turned to 10
an increasing degree of N-deficiency. Normalizing uptake to biomass of phytoplankton and heterotrophic bacteria revealed that organisms in the 0.8–0.2µm size fraction had higher specific affinity for leucine-N than those in the>0.8µm size fraction when N was deficient, whereas the opposite was the case for NH+4. There was no such difference regarding the specific affinity for P substrates. Since heterotrophic bacteria seem to 15
acquire N from organic compounds like leucine more efficiently than phytoplankton, our results suggest different structuring of the microbial food chain in N-limited relative to P-limited environments.
1 Introduction
Under conditions of mineral nutrient limitation, heterotrophic bacteria may compete with 20
phytoplankton for inorganic nutrients (e.g. orthophosphate (PO34−), ammonium (NH+4), and nitrate (NO−3)). The outcome of this competition potentially influences the carbon cycle both by heterotrophic microbes indirectly limiting primary production by depriving phytoplankton of nutrients (Joint et al., 2002), and by phytoplankton indirectly limiting the extent of heterotrophic degradation of organic material (Havskum et al., 2003). 25
Understanding how competition, predation, and other trophic interactions structure the
BGD
4, 3343–3375, 2007Algal-bacterial competition for N and
P
T. Løvdal et al.
Title Page
Abstract Introduction
Conclusions References
Tables Figures
◭ ◮
◭ ◮
Back Close
Full Screen / Esc
Printer-friendly Version
Interactive Discussion
EGU
flows of C, N, P, and other elements through the microbial food web is central to our understanding of the role and function of this part of the pelagic ecosystem, both in a biological and in a biogeochemical context.
Competition between phytoplankton and bacteria potentially influences the species composition of the phytoplankton and bacterial communities (Jacobsen et al., 1995; 5
Samuelsson et al., 2002). It may also affect the fundamental functioning of the micro-bial ecosystem by shifting the balance between phytoplankton and bacteria (Bratbak and Thingstad, 1985), as well as the bacterial degradation of organic matter (Pengerud et al., 1987; Grossart et al., 2006b). In principle, the competition between heterotrophic bacteria and phytoplankton for N and P may be different for the organic forms than it 10
is for the inorganic ones. In addition, the case of N- and P-limitation may be different. Bacteria have traditionally been expected to be more superior in competition for dis-solved organic N (DON) (reviewed by Antia et al., 1991), than they are for disdis-solved organic P (DOP), where both phytoplankton and bacteria are known to produce en-zymes, such as alkaline phosphatase, splitting orthophosphate off from the organic 15
part before uptake (reviewed by Chr ´ost, 1990). If this is correct, simple mathematical models suggest that the microbial part of the C-cycle may differ substantially between N- and P-limited systems (Thingstad, 2000).
Although heterotrophic uptake by bacteria has long been recognized as the major process removing DON (e.g. as amino acids (Paul, 1983; Billen, 1984)), uptake of 20
amino acids and other DON-compounds by phytoplankton can occur under several environmental conditions (Ietswaart et al., 1994; Pantoja and Lee, 1994; Palenik and Henson, 1997). Proteolytic activity has been found in association with eukaryote algae (Berges and Falkowski, 1996) and cyanobacteria (Martinez and Azam, 1993). One important question is whether cyanobacteria, being a diverse group of prokaryotic al-25
BGD
4, 3343–3375, 2007Algal-bacterial competition for N and
P
T. Løvdal et al.
Title Page
Abstract Introduction
Conclusions References
Tables Figures
◭ ◮
◭ ◮
Back Close
Full Screen / Esc
Printer-friendly Version
Interactive Discussion
EGU
methionine, leucine and tyrosine could be an important source of N for Prochlorococ-cus, but not forSynechococcus. Apart from this, there has been little work to quantify the importance of DON to the nutrition of these organisms in the natural environment. Laboratory experiments leave no doubt that the majority of aquatic algal species are able to utilize common organic compounds as N sources for growth if sufficient sub-5
strate concentration is provided and enough time is allowed for metabolic adaptation (reviewed by Berman and Bronk, 2003). Most of these studies, however, used ax-enic laboratory batch cultures growing on high initial substrate concentrations, thus the ability of organisms to exploit the much lower concentrations of these compounds encountered in the environment in situ still remains unclear (Paul, 1983; Berman and 10
Bronk, 2003).
This paper focuses on algal and bacterial uptake of different N- and P-substrates dur-ing an artificially induced phytoplankton bloom dominated by coccolithophorids, mainly
Emiliania huxleyi. The experiment was done in a mesocosm set-up with a time depen-dent change from presumably C-stressed bacteria and P-stressed phytoplankton, to 15
N-limitation, at least of autotrophic processes. Bacterial and algal uptake of inorganic N (NH+4, NO−
3) and of leucine as a model substrate for DON, as well as inorganic P
(PO3−
4 ) and the two organic forms ATP and DNA as model substrates for DOP was
measured. Analyses of15N and33P uptake from these sources in algal and bacterial size fractions were performed in order to compare algal vs. bacterial competition for 20
organic and inorganic dissolved N and P by means of their biomass-specific affinities.
2 Materials and methods
2.1 Experiment
An outdoor mesocosm experiment was carried out at the Marine Biological Field Sta-tion, Espeland, 20 km south of Bergen, western Norway from 4 to 24 May. The study 25
BGD
4, 3343–3375, 2007Algal-bacterial competition for N and
P
T. Løvdal et al.
Title Page
Abstract Introduction
Conclusions References
Tables Figures
◭ ◮
◭ ◮
Back Close
Full Screen / Esc
Printer-friendly Version
Interactive Discussion
EGU
setup and sampling procedures are described elsewhere (Grossart et al., 2006a). The data referred to here were obtained from enclosure number 4 referred to as “present” in the paper of Grossart et al. (2006a) because it represented the present-day level of 370 ppmV atmospheric CO2concentration. The enclosure (volume∼20 m3) was filled
with unfiltered, nutrient-poor, post-spring bloom sea water from the fjord and supple-5
mented with 9µmol L−1NO−3, 0.5µmol L−1 PO34−, and 12µmol L−1 Si(OH)4on day 0 of the experiment to induce a phytoplankton bloom.
Stormy weather from day 4 eventually led to a collapse of the enclosure on day 6. The enclosure was restored to an upright position, and 705 mg of KH2PO4was added to the enclosure on day 7 to maintaining the phytoplankton bloom. The addition of 10
KH2PO4 would ideally correspond to a PO3−
4 enrichment corresponding to a
concen-tration of 0.3µmol L−1PO3−
4 , but was actually slightly higher since the enclosure was
not entirely unfolded at the time. From day 10 on, the weather calmed down, and the enclosure was underlayered with an unknown volume of deep, high salinity water (with a soluble reactive phosphorus (SRP) concentration of 0.77µmol L−1) in order to unfold
15
the enclosure after the storm.
2.2 Chemical analysis
SRP was measured using the molybdate blue method (Koroleff, 1983). Nitrate and nitrite (NOx) were determined with a Skalar AutoAnalyser, based on the sulphanil-amide colorimetric method (Grasshoff, 1983). Ammonium (NH+4) was analysed by 20
the indophenol blue method according to Koroleff(1969). Dissolved free amino acids (DFAA) were analyzed by High Pressure Liquid Chromatography (HPLC) after ortho-phtaldialdehyde derivatization as described elsewhere (Grossart et al., 2006a).
2.3 Biomass estimations
Free and particle-associated bacteria were enumerated and their volumes calculated 25
BGD
4, 3343–3375, 2007Algal-bacterial competition for N and
P
T. Løvdal et al.
Title Page
Abstract Introduction
Conclusions References
Tables Figures
◭ ◮
◭ ◮
Back Close
Full Screen / Esc
Printer-friendly Version
Interactive Discussion
EGU
was calculated assuming a constant biomass of 18.5 fg C cell−1and a C:N:P molar ratio
of 50:10:1 for coccoid bacteria (Fagerbakke et al., 1996). Particle-associated bacteria were significantly bigger than free bacteria, and increased from 0.6 to 1.5µm3at the end of the experiment (Grossart et al., 2006a). Because of the large and temporally variable size of the particle-associated bacteria, allometric conversion factors between 5
volume (V) and C, N, and P content (in femtograms) of C=220×V0.9, N=50×V0.8, and
P=2×V0.7 was applied. The bacterial volume to C conversion factor is comparable to a factor (C=218×V0.86) for both cultures and bacterioplankton from lakes of different
trophic status (Loferer-Kr ¨oßbacher et al., 1998) and to a factor (C=224×V0.89) forVibrio
splendidus grown along a gradient from C to P limitation (Løvdal et al., 2007a). The 10
volume to N and volume to P conversion factors are adapted from Løvdal et al. (2007a). Chlorophylla(Chla) measurements (Grossart et al., 2006a) were used for estimat-ing phytoplankton C, N, and P biomass. A C:Chlaratio of 30 (w:w) and a C:N:P molar ratio of 106:16:1 in phytoplankton biomass was assumed. With the conversion factors applied here, we got an estimated “bacterial+algal C-biomass” to Chlaratio (w:w) of 15
85±22 (mean±SD,n=10), which is close to the reported constant particulate organic C (POC):Chla ratio (w:w) of 81 (Aure et al., 2000, as cited in Erga et al., 2005) from the waters of the Samnanger Fjord. This site constitutes the fjord system adjacent to the study site.
2.4 Alkaline phosphatase activity (APA) 20
APA was measured fluorometrically using 3-0−methylfluorescein-phosphate (MFP) as
substrate (Perry, 1972). Samples were mixed with MFP solution in 0.1 mol L−1
Trizma-HCl pH 8.3 (final concentration 0.1µmol L−1). Fluorescence was measured directly
after the addition of the reagent and at two subsequent times according to the expected activity using a Perkin Elmer fluorometer LS50B. After correcting fluorescence values 25
of samples to those of autoclaved samples used as blanks, APA (nmol-P L−1h−1) was
calculated using linear regression of fluorescence values versus incubation time.
BGD
4, 3343–3375, 2007Algal-bacterial competition for N and
P
T. Løvdal et al.
Title Page
Abstract Introduction
Conclusions References
Tables Figures
◭ ◮
◭ ◮
Back Close
Full Screen / Esc
Printer-friendly Version
Interactive Discussion
EGU
2.5 Uptake of15N-compounds
Water for use in15N uptake studies was collected with a tube covered with 18µm gaze under stirring into thoroughly cleaned 1000 mL septum glass bottles. 15N enriched NH4Cl, NaNO3, or L-leucine (>98 atom% 15N; Larodan Fine Chemicals AB), respec-tively, in a concentration of about 10% of the ambient concentrations was added. When 5
the ambient NH+4 concentrations were below the measurement limit, unlabelled NH4Cl was added to a final concentration of 0.5µmol L−1 1 to 4 h before tracer addition. The precise portion of tracer added was calculated after determination of the ambient NH+4, NO−
3, or DFAA (Grossart et al., 2006a) concentrations. The bottles were closed
gas-tight and were incubated at in situ temperature and light. Four time points were taken 10
within 3 to 5 h for each measurement. The reaction was terminated by filtering the samples through silver-membrane filters (Osmonics; pre treated 500◦C for 1 h) with
pore sizes of 0.2 and 0.8µm. The filtration volume was 400 to 500 mL. Filters were flushed with 0.2µm filtered sea water to remove adherent tracer-containing water and stored frozen until analysis.
15
After drying in a drying chamber, the filters were wrapped in silver cups (6×6×12 mm;
Elementar Analysensysteme) and formed into pellets with a laboratory press. As the amount of N on the 0.2µm filters was under the measurement limit,δ15N values were measured together with a well defined N isotope standard (peptone; Merck). One
µmol L−1 peptone was pipetted onto the 0.2µm filters before packing and N isotopes
20
were measured by continuous flow isotope ratio mass spectrometry (CF-IRMS) on a Finnigan MAT Delta plus coupled with a Thermo NA 2500 CHN analyser. The N content was calculated using acetanilide (Fisons) as a standard. The standard deviation of the
δ15N values measured for the standards was on average 0.15‰. The stable N isotope ratio was calculated in terms ofδ15N-values as follows:
25
δ15N= Rsample−Rstandard
Rstandard
!
BGD
4, 3343–3375, 2007Algal-bacterial competition for N and
P
T. Løvdal et al.
Title Page
Abstract Introduction
Conclusions References
Tables Figures
◭ ◮
◭ ◮
Back Close
Full Screen / Esc
Printer-friendly Version
Interactive Discussion
EGU
whereR=1514NN. The measured δ
15
N values were converted to atom percent15N after the formula (Montoya et al., 1996):
atom%15N=100× "
(10−3×δ15N+1)×(15N/14N)atmosphere
1+(10−3×δ15N+1)×(15N/14N)
atmosphere
#
with1514N
N
atmosphere=0.003676 (Junk and Svec 1958). The uptake rates were estimated
from the regression relationship between uptake and time and converted to turnover 5
time (T; see below).
2.6 33P-labelling of DNA
Radiolabeling of DNA was performed by random oligonucleotide primed synthesis (ROPS) with the DecaLabel DNA labeling kit (Fermentas K0621) in accordance with the manufacturer’s instructions. [33P]DNA was prepared for use in uptake studies as 10
described by Løvdal et al. (2007b). This procedure yields labelled DNA products with an average length of 0.5 kilobase pairs (kb) which is at the lower end of the range for naturally occurring dDNA (0.12–35.2 kb) in aquatic environments (DeFlaun et al., 1987). We did not correct for potential shortening of the DNA chain length by radio-chemical decay, but the radiolabelled DNA was used well within one half life of the ra-15
dioactive precursor in order to avoid significant shortening. The final product had a spe-cific activity of approximately 108counts per minute (cpm)µg−1with 97.0
±0.6% (mean ±SD of 3 replicates) incorporation of label and a concentration of 12.6±0.1 ngµL−1
(mean±SD of 3 replicates) as calculated by the DE-81 filter-binding assay (Sambrook
and Russell, 2001). 20
2.7 Uptake of33P-compounds
Uptake of 33PO34−, AT33P and [33P]DNA was measured according to Thingstad et al. (1993), modified as described by Løvdal et al. (2007b), except that the samples
BGD
4, 3343–3375, 2007Algal-bacterial competition for N and
P
T. Løvdal et al.
Title Page
Abstract Introduction
Conclusions References
Tables Figures
◭ ◮
◭ ◮
Back Close
Full Screen / Esc
Printer-friendly Version
Interactive Discussion
EGU
were not assayed for inorganic P released from organic substrates which was not taken up by the organisms. All incubations were done in 10 mL subsamples in 15 mL Falcon tubes at subdued light and 15.5±1.0◦C. Samples were incubated according to
the expected turnover time; for samples incubated with33PO34−, AT33P and [33P]DNA, the respective incubation times varied between 15 min and 1 h, 1–2 h, and 2–5 h, re-5
spectively. Incubations were stopped by cold chase (Løvdal et al., 2007b). Bacteria and phytoplankton were separated into different size fractions by filtration onto poly-carbonate filters (Poretics) with pore sizes of 0.2 and 0.8µm according to Løvdal et al. (2007b). Subsamples and filters were radioassayed by liquid scintillation counting (Løvdal et al., 2007b).
10
2.8 Estimation of turnover times and biomass-specific affinity
Turnover times (T; h) were calculated by the equation (Thingstad et al., 1993):
T = t
−ln(1−R)
whereR is the consumed fraction of added label and tis the incubation time. Hence,
T represents here the turnover of substrates into particulate matter and does not in-15
clude the release of hydrolysis products to the water phase. T for33P substrates was calculated from one time-point measurements (Thingstad et al., 1993), whereasT for
15
N substrates was calculated from the regression line between four time points. Biomass-specific affinity for N (αN; L nmol-N−1h−1) and P (αP; L nmol-P−1h−1) uptake was estimated according to the procedure proposed by Thingstad and Ras-20
soulzadegan (1999):
α=f /(TB) (1)
BGD
4, 3343–3375, 2007Algal-bacterial competition for N and
P
T. Løvdal et al.
Title Page
Abstract Introduction
Conclusions References
Tables Figures
◭ ◮
◭ ◮
Back Close
Full Screen / Esc
Printer-friendly Version
Interactive Discussion
EGU
5µm filter (Grossart et al., 2006a). Hence, due to the particle-associated bacteria, the mechanical separation of bacteria and phytoplankton by size fractionation was not entirely successful. In our estimates of biomass-specific affinity, this was corrected for by assuming that particle-associated bacteria had the same affinity for uptake as free bacteria. From this assumption, the fraction of uptake by particle-associated bacteria 5
was calculated by rearranging Eq. (1) to
f =αT B (2)
inserting the estimated biomass of particle associated bacteria. Corrected estimates corresponding to algae and bacteria was then calculated by subtracting this value from the>0.8µm size fraction, contributing it to the 0.8–0.2µm size fraction, respectively. 10
2.9 Statistical analysis
Statistical analysis was performed by student’s t-tests according to Sokal and Rohlf (1995). The confidence level of all analyses was set at 95%.
3 Results
3.1 Nutrients, alkaline phosphatase activity (APA), and bloom development 15
Dissolved inorganic N (DIN), represented as the sum of NH+4+NOxwas dominated by NOxconcentrations ranging from 8µmol L−1on day 1, to 4µmol L−1on day 7, before it
rapidly declined to under the detection limit (<0.01µmol L−1) on day 16, whereas NH+
4
concentrations were low (<0.02µmol L−1) the whole study period. SRP concentrations declined from approximately 0.4µmol L−1on day 1 to
∼0.04µmol L−1on day 20. Thus,
20
the DIN:SRP ratio was well above the Redfield ratio of 16 beyond the second addition of PO34− on day 7 before it rapidly declined (Fig. 1). DFAA concentrations ranged
BGD
4, 3343–3375, 2007Algal-bacterial competition for N and
P
T. Løvdal et al.
Title Page
Abstract Introduction
Conclusions References
Tables Figures
◭ ◮
◭ ◮
Back Close
Full Screen / Esc
Printer-friendly Version
Interactive Discussion
EGU
between 0.4 and 1.6µmol L−1, with the lowest concentrations after the peak of the
bloom (Grossart et al., 2006a).
Alkaline phosphatase activity (APA) ranged from 1 nmol-P L−1h−1 on day 2 of the
experiment, to 5 nmol-P L−1h−1 on day 20. Specific values for APA (S-APA) and for
phosphate affinity (S-αPO4) normalized for the summed P-biomass of phytoplankton 5
and bacteria are shown in Fig. 2. Both values increased after day 8, but remained be-low 0.04 h−1and 0.008 L nmol-P−1h−1, respectively. According to Tanaka et al. (2006),
S-APA above 0.2 h−1 or S-αPO4 above 0.02 L nmol-P−1h−1, is indicative of systemic P-limitation. According to these criteria, our data on S-APA and S-αPO4 (Fig. 2) do not indicate severe P-limitation during any parts of the study period.
10
The algal bloom, almost exclusively dominated by coccolithophorids (mainly Emilia-nia huxleyi), was initiated by the addition of inorganic nutrients on day 0 and reached its maximum on day 12 (Grossart et al., 2006a) where the DIN:SRP ratio was ∼5 (NOx:SRP ∼2). Highest numbers of total as well as free bacteria were recorded on
day 8 (Grossart et al., 2006a) when the DIN:SRP ratio was∼11 and NOx accounted
15
for 99% of DIN. Particle-associated bacteria contributed to 40–80% of the total bacte-rial volume (Grossart et al., 2006a). From our estimates, the contribution of particle-associated bacteria to the total C-biomass of algae and bacteria increased from∼30%
on day 0 to∼65% on day 20.
3.2 Turnover times 20
During the first week of the experiment, T of all substrates were in general long and
T of the organic N and P substrates measured were shorter than T of the respective inorganic substrates (Fig. 3). This may indicate C-limitation of heterotrophic processes in this phase (see discussion). The peak of the phytoplankton bloom on day 12 co-incided with the shortestTNH4 (4.8 h) andTNO3 (6.2 h). From this point on, NH+4 and
25
BGD
4, 3343–3375, 2007Algal-bacterial competition for N and
P
T. Løvdal et al.
Title Page
Abstract Introduction
Conclusions References
Tables Figures
◭ ◮
◭ ◮
Back Close
Full Screen / Esc
Printer-friendly Version
Interactive Discussion
EGU
whereasTLeucinedecreased from>100 h to 34 h at the same time (Fig. 3a).
Despite high DIN:SRP ratios (Fig. 1), which could have been interpreted to indicate phosphate limitation, TPO4 was longer than TATP at the beginning of the experiment (Fig. 3b). Because P limitation was not expected immediately after the addition of PO3−
4 on day 7, T for P substrates was not measured between day 6 and day 12, the
5
peak of the phytoplankton bloom. On day 12,TPO4 (5.8 h) was shorter than TATP and was comparable to TNH4 and TNO3, before it reached a minimum of 1.4 h at day 16 (Fig. 3b). TATP andTdDNAdeclined from 24 and 346 h, respectively, on day 12 before it stabilized on 6±2 h (mean±SD,n=) and 84±8 h (mean ±SD,n=4), respectively, for the rest of the study period (Fig. 3b).
10
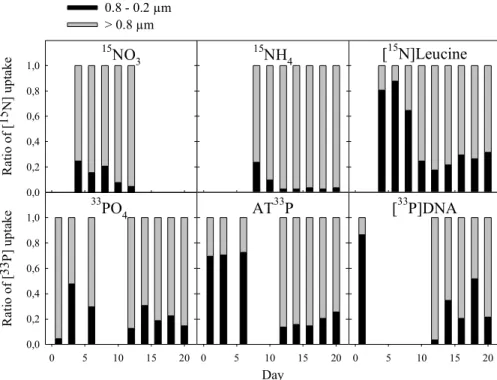
3.3 Uptake distribution of15N- and33P-substrates and biomass-specific affinity The distribution of added activity taken up by the two size fractions is shown in Fig. 4. The 0.8–0.2µm size fraction took up most of the organic substrates during the first part of the study period, whereas the>0.8µm size fraction dominated uptake of the inorganic substrates. In our set of data, bothTNH4andTPO4dropped below 10 h at the 15
peak of the phytoplankton bloom (Fig. 3). There are strong indications for a transition from a non-N-limited to an N-limited system at this point (see Discussion). Hence, we usedTNH4 as an indicator to split the dataset into non-N-limitation (TNH4>10 h) and
N-limitation (TNH4<10 h) which also represents the periods before and after the peak of the phytoplankton bloom, respectively. After the peak of the phytoplankton bloom, the 20
>0.8µm size fraction dominated uptake of all substrates, and NH+4 uptake was almost exclusively by the>0.8µm size fraction. There were small changes in the distribution of inorganic N and P compared to before the phytoplankton peak, with the >0.8µm size fraction taking up slightly more after this peak (Fig. 4).
Table 1 is a compilation of data presented in Fig. 4 showing uptake distributions to 25
the>0.8µm size fraction grouped for the two periods. NO−3 and NH+4 data are pooled as DIN, whereas ATP and dDNA data are pooled as DOP. From DON (i.e. leucine-N) and DOP uptake dominated by the 0.8–0.2µm size fraction during TNH4>10 h, there
BGD
4, 3343–3375, 2007Algal-bacterial competition for N and
P
T. Løvdal et al.
Title Page
Abstract Introduction
Conclusions References
Tables Figures
◭ ◮
◭ ◮
Back Close
Full Screen / Esc
Printer-friendly Version
Interactive Discussion
EGU
was a shift towards DON and DOP uptake dominated by the >0.8µm size fraction duringTNH4<10 h (Table 1). There were no drastic shifts in the distribution of inorganic substrates, with the>0.8µm size fraction dominating uptake in both periods, but more so duringTNH4<10 h (Table 1).
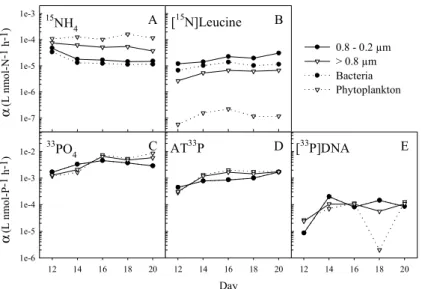
S-αNO3 and S-αNH4, and S-αPO4 are specific affinities normalized for the summed N 5
and P biomass, respectively, of algae and bacteria, and are shown in Fig. 2. Affinities for all substrates were low during the first half of the study period. Maximum values of S-αNH4 paralleled the peak of the phytoplankton bloom, whereas S-αPO4 peaked on day 16.
Comparing competitive ability of osmotrophs in the 0.8–0.2µm and the>0.8µm size 10
fraction by means of biomass-specific affinity for N-uptake in the two size fractions, fo-cusing on the N-limited phase (TNH4<10 h), reveals a significant shift depending on whether N is present in organic or inorganic form (Fig. 5). The>0.8µm size fraction had a significantly higher biomass-specific affinity for NH+4 than the 0.8–0.2µm size fraction (p=0.005), and a significantly lower biomass-specific affinity for leucine-N than 15
the 0.8–0.2µm size fraction (p=0.003) (Figs. 5a–b). No such shift between the compe-tition for DIP and DOP were observed; no significant differences were found between biomass-specific affinity in the two size fractions for PO3−
4 (p=0.449), ATP-P (p=0.372),
or dDNA-P (p=0.494) (Figs. 5c–e).
From Eq. (2), it was estimated that much of the uptake in the >0.8µm size frac-20
tion was by particle-associated bacteria. Particle-associated bacteria took up larger shares of DON compared to DIN (Table 2). In fact, it was estimated that the major-ity (73±6%, n=5) of total DON uptake was by particle-associated bacteria during N-limitation (TNH4<10 h), leaving phytoplankton with <2% (Table 2), and thus free-living bacteria with approximately 25% of total DON uptake. Hence, from the corrected es-25
BGD
4, 3343–3375, 2007Algal-bacterial competition for N and
P
T. Løvdal et al.
Title Page
Abstract Introduction
Conclusions References
Tables Figures
◭ ◮
◭ ◮
Back Close
Full Screen / Esc
Printer-friendly Version
Interactive Discussion
EGU
in algae and bacteria for PO3−
4 (p=0.324), ATP-P (p=0.237), or dDNA-P (p=0.407)
(Figs. 5c–e).
4 Discussion
It has been hypothesized that phosphate limitation, classically indicated by DIN:DIP ratios>16, is one of the critical factors allowing the coccolithophoreEmiliania huxleyi
5
to bloom (reviewed by Lessard et al., 2005). This hypothesis is based on physiological studies showing thatE. huxleyi has an exceptionally high affinity for PO34− and is able to use DOP (Kuenzler and Perras, 1965; Riegman et al., 2000). High NO−3:PO34− ra-tios, however, appear to be the exception rather than the rule inE. huxleyi blooms. In fact, in most blooms studied to date, NO−
3:PO 3−
4 ratios were low, and nitrate was low or
10
undetectable (Lessard et al., 2005). In the current experiment, the addition of NO−3 and PO34−in a molar ratio of 18 initiated a bloom of coccolithophorids, dominated byE. hux-leyi, reaching its maximum after 12 days when the DIN:SRP ratio was∼5. The first half
of the period prior to the peak of the bloom was characterized by high DIN:SRP ratios (Fig. 1), thus the phytoplankton growth may be suspected to have been restricted by 15
the availability of inorganic P. Low S-APA and low S-αPO4, S-αNO3and S-αNH4 values
(Fig. 2), however, does not indicate severe mineral nutrient limitation, andT of the or-ganic N and P substrates measured where shorter thanT of the respective inorganic substrates (Fig. 3), possibly indicating C-limitation of heterotrophic processes in this phase. Bacteria hydrolyze specific DON and DOP-compounds in the presence of inor-20
ganic mineral nutrients, presumably to obtain other associated mineral nutrients and C (Jørgensen et al., 1993; Benitez-Nelson and Buesseler, 1999). DIN:SRP ratios rapidly declined from day 7 (Fig. 1) due to the PO3−
4 enrichment. However, the additional PO 3−
4
was rapidly consumed followed by increasing values of S-APA and S-αPO4 (Fig. 2).
S-αNO3 and S-αNH4 values rapidly increased from day 8 with S-αNH4 peaking at day 12
25
BGD
4, 3343–3375, 2007Algal-bacterial competition for N and
P
T. Løvdal et al.
Title Page
Abstract Introduction
Conclusions References
Tables Figures
◭ ◮
◭ ◮
Back Close
Full Screen / Esc
Printer-friendly Version
Interactive Discussion
EGU
TNH4 reaching minimum values at day 10 before stabilizing, andTLeucinedeclining from day 10 to the end (Fig. 3). Conclusively, the splitting of the investigation period into a non-N-limited and an N-limited phase can be justified.
From our data, there is evidence for a shift in terms of algal – bacterial competition when N is available in the form of leucine contrary to NH+4 (Fig. 5), with organisms in the 5
>0.8µm size fraction having significantly lower biomass-specific affinity for leucine-N and significantly higher biomass-specific affinity for NH+4 compared to smaller organ-isms (0.8–0.2µm). Correcting for the contribution of particle-associated bacteria in the
>0.8µm size fraction by assuming they have similar affinity per biomass as free-living bacteria, probably represents a best estimate for the competition between algae and 10
heterotrophic bacteria. However, since specific aminopeptidase (Karner and Herndl, 1992; Middelboe et al., 1995), protease (Becquevort et al., 1998) and phosphatase (Smith et al., 1992; Simon et al., 2002) activities in particle-associated bacteria is of-ten higher than those characteristic for free-living bacteria, our affinity values for het-erotrophic bacteria may have been underestimated, and the values for phytoplankton 15
correspondingly overestimated.
In a previous investigation in P-limited estuarine mesocosms, Løvdal et al. (2007b) found no significant shift in algal – bacterial competition for P from ATP and dDNA rel-ative to PO34−, in terms of biomass-specific affinity. In the current experiment, using comparable methodology, a shift from bacteria dominating the competition for DON 20
towards algae dominating the competition for DIN was evident (Fig. 5). This does in-deed indicate that the structure of the microbial food web in N-limited environments may be different from that in P-limited environments. If amino acids are utilized almost exclusively by bacteria, this changes the food web structure relative to P-limited envi-ronments, since there will be a pool of dissolved N for which bacteria do not experience 25
significant competition from phytoplankton to achieve. One effect of this is, theoretically, that the probability for C-limitation of bacteria could be larger in N-deficient regions than in P-deficient regions (Thingstad, 2000).
com-BGD
4, 3343–3375, 2007Algal-bacterial competition for N and
P
T. Løvdal et al.
Title Page
Abstract Introduction
Conclusions References
Tables Figures
◭ ◮
◭ ◮
Back Close
Full Screen / Esc
Printer-friendly Version
Interactive Discussion
EGU
petitor for phosphate compared to other algal species (Riegman et al., 1992, 2000). During naturalE. huxleyi blooms,E. huxleyi primarily use NH+4 and urea (Kristiansen et al., 1994; Fern ´andez et al., 1996; Rees et al., 2002). The high P acquisition capacity and ability to use non-nitrate N has been suggested to (Lessard et al., 2005), at least in part, explain the success ofE. huxleyi in nutrient-depleted waters. This is supported 5
by our data because the biomass-specific affinity for all P-substrates inE. huxleyiwas comparable to that in heterotrophic bacteria, whereasE. huxleyi, although they seemed to have low amino acid-N acquisition capacity, dominated the competition for NH+4. Our results also agree with previous findings that DFAA are an important N source to ma-rine bacteria (Hollibaugh and Azam, 1983; Jørgensen et al., 1993).
10
The biomass-specific affinity values estimated in the present study can be compared with those given by diffusion limitation of substrate transport to the cell surface – that is, the theoretical maximum. Assuming that the cell is diffusion-limited, i.e., that the cell’s uptake system is so efficient (and the bulk nutrient concentration so low) that all substrate molecules hitting the cell surface are captured, it is possible to derive a 15
theoretical expression for maximum specific affinity (αmax) for a spherical cell (Fig. 6; see also Thingstad and Rassoulzadegan, 1999):
αmax=3D/(σr2)
where D is the diffusion constant for the substrate molecules and σ is the volume-specific content of the element in question. Assuming free-living and particle-20
associated bacteria to have volumes of 0.2 and 1.5µm3, respectively, and particle-associated bacteria to make up 30% of the total bacterial community (cf. Grossart et al., 2006a), their mean equivalent r can be calculated to be ∼0.5µm. Assuming the phytoplankton community is dominated by N-limited E. huxleyi with volumes of
∼40µm3 (cf. Riegman et al., 2000), their mean r may be set to 2.1µm. One should
25
however keep in mind that genetic and physiological intraspecific diversity inE. hux-leyi has been documented, and multiple strains can be present within an environment (Paasche, 2002), complicating comparison between laboratory and field studies. The
BGD
4, 3343–3375, 2007Algal-bacterial competition for N and
P
T. Løvdal et al.
Title Page
Abstract Introduction
Conclusions References
Tables Figures
◭ ◮
◭ ◮
Back Close
Full Screen / Esc
Printer-friendly Version
Interactive Discussion
EGU
in continuous cultures and was more than three times smaller and had lower internal N and P cell quotas than E. huxleyi reported elsewhere (Ho et al., 2003). Thus, the results of their study cannot be applied directly to the natural environment. Hence, the cell radius applied here and the lines representing the theoretical maximum for biomass-specific affinity inE. huxleyi(Fig. 6) is to be understood as extremes.
5
The mean biomass-specific affinity for NH+4 uptake in phytoplankton was higher than that for bacteria, approaching that predicted by the diffusion model (Fig. 6a), contrary to that estimated for leucine (Fig. 6b). AlthoughE. huxleyi is reported to grow fairly on leucine as the sole N-source (Ietswaart et al., 1994), our data suggest that the natural amount of leucine does not serve as an important N-source forE. huxleyiin our study. 10
The reason for the low biomass-specific affinity for N-substrates estimated for bacte-ria (Figs. 6a–b) is unknown. One possibility, contradictory to our previous conclusion, could be that the growth rate of heterotrophic bacteria was limited by C or other factors, rather than N. Another possibility could be artefacts in our estimation procedure. How-ever, the main reason that biomass-specific affinities for N-compounds, both in bacteria 15
and algae, seem unrealistically low for a presumably N-stressed system, compared to that of P-compounds, stems probably from a methodological limitation. Although the continuous flow isotope ratio mass spectrometry (CF-IRMS) is very sensitive, it re-quires a certain threshold level of particulate material for the analysis of microbial N uptake. Hence, following long filtration time due to large sample volumes, this tech-20
nique only allows for analysis of relatively high levels of isotope enrichment to avoid exhaustion of the added tracer. Thus, it is not optimal in environmental labelling stud-ies when the ambient turnover time is extremely short. In our experiment, effort was done to add below 10% of ambient concentrations of tracer15N isotope. In the case of NH+4 uptake studies, this was occasionally achieved only by adding additional un-25
BGD
4, 3343–3375, 2007Algal-bacterial competition for N and
P
T. Løvdal et al.
Title Page
Abstract Introduction
Conclusions References
Tables Figures
◭ ◮
◭ ◮
Back Close
Full Screen / Esc
Printer-friendly Version
Interactive Discussion
EGU
the N-limitation in these bottles, and led to significant overestimates of the ambient NH+4 turnover times (Fig. 3a). Additions of 15N-leucine were based on measurements of ambient DFAA concentrations. Most likely, the DFAA pool measured chemically is larger than that utilized by osmotrophs since both bacteria and phytoplankton prefer certain amino acids (including the neutral leucine) over others (Ietswaart et al., 1994). 5
Hence, in the N-limited phase,15N enrichment presumably exceeded that typically re-garded as true tracer levels, leading to an overestimate of turnover times, and hence underestimates of biomass-specific affinities for N-compounds (Figs. 5a–b). The liq-uid scintillation counting technique on the other hand, applied for33P uptake studies, is not hampered with this problem because the high specific activity of33P allows for 10
true tracer level enrichment, e.g. picomolar concentrations. Although this problem with the CF-IRMS technique can be expected to have given significant underestimates of biomass-specific affinity, we believe that it did not affect the relative distribution of N-substrates in the two size fractions considerably. Thus, qualitative differences between the 0.8–0.2µm and the >0.8µm size fractions were attributed to the differences be-15
tween bacterial and algal metabolism.
DNA and ATP contain 16% and 14% N, and 10% and 18% P, respectively. Hence, they contain as much N per dry weight as amino acids of algal proteins (Laws, 1991). Therefore these substrates may serve as potential N and P sources at the same time. The high biomass-specific affinities for dDNA and ATP, considering their diffusion con-20
stants, compared to PO3−
4 (Figs. 6c–e), may indicate that these substrates where
hydrolyzed for their N content rather than their P content. dDNA is mainly utilized as a P source by marine bacteria, and accounts <10 of their N and C requirements (Jørgensen et al., 1993; Jørgensen and Jacobsen, 1996). The possibility then exists, that organic compounds, such as dDNA, are more bioavailable to phytoplankton than 25
DON-compounds, such as amino acids, and are thus utilized as alternative sources for N by phytoplankton when the ambient DIN-concentrations are too low to support their growth. The potential for dDNA and ATP to also have rapid turnover times in non-P-limited environments, and to substantially support algal N-demand, indicates that
BGD
4, 3343–3375, 2007Algal-bacterial competition for N and
P
T. Løvdal et al.
Title Page
Abstract Introduction
Conclusions References
Tables Figures
◭ ◮
◭ ◮
Back Close
Full Screen / Esc
Printer-friendly Version
Interactive Discussion
EGU
toplankton may rely on these compounds to support their N-demand, rather than those traditionally looked upon as important DON-sources. Yet, isotope P-labelled substrates may yield limited information about N uptake. Therefore, an N-isotope is preferable in assessing phytoplankton dDNA and ATP utilization.
The main conclusion of our study is that the competitive fitness of bacteria and al-5
gae for nutrients (and particularly N) vary dramatically depending on whether the sub-strates are organic or inorganic. Whereas bacteria appear to be superior competitors for organic forms of N, phytoplankton appear to be superior competitors for inorganic N supplied as NH+4. This observation has major implications for our understanding of marine food webs and effects of nutrient status on community structure.
10
Acknowledgements. We thank the staff of the Large Scale Facility (LSF) in Bergen and
U. Riebesell for coordinating the project. S. Trimborn is thanked for Chlameasurements, and E. Foss Skjoldal, T. Tanaka, and M. Allgaier for technical assistance. U. Struck at the Museum f ¨ur Naturkunde Berlin (Germany) is acknowledged for stable isotope analysis. This work was supported by the University of Bergen and the Research Council of Norway; project 158936/I10 15
Patterns in Biodiversity.
References
Antia, N. J., Harrison, P. J., and Oliveira, L.: The role of dissolved organic nitrogen in phyto-plankton nutrition, cell biology and ecology, Phycologia, 30, 1–89, 1991.
Aure, J., Erga, S. R., and Asplin, L.: Increased biological production in fjords by artificial up-20
welling, Fisken Havet, 11, 1–30, 2000.
Becquevort, S., Rousseau, V., and Lancelot, C.: Major and comparable roles for free-living and attached bacteria in the degradation ofPhaeocystis-derived organic matter in Belgian coastal waters of the North Sea, Aquat. Microb. Ecol., 14, 39–48, 1998.
Benitez-Nelson, C. R. and Buesseler, K. O.: Variability of inorganic and organic phosphorus 25
turnover rates in the coastal ocean, Nature, 398, 502–505, 1999.
BGD
4, 3343–3375, 2007Algal-bacterial competition for N and
P
T. Løvdal et al.
Title Page
Abstract Introduction
Conclusions References
Tables Figures
◭ ◮
◭ ◮
Back Close
Full Screen / Esc
Printer-friendly Version
Interactive Discussion
EGU
Berman, T. and Bronk, D. A.: Dissolved organic nitrogen: a dynamic participant in aquatic systems, Aquat. Microb. Ecol., 31, 279–305, 2003.
Billen, G.: Heterotrophic utilization and regeneration of nitrogen, in: Heterotrophic activity in the sea, edited by: Hobbie, J. E. and Williams, P. J. L. B., Plenum Press, New York, London, 313–355, 1984.
5
Bratbak, G. and Thingstad, T. F.: Phytoplankton-bacteria interactions: an apparent paradox? analysis of a model system with both competition and commensalism, Mar. Ecol. Prog. Ser., 25, 23–30, 1985.
Chr ´ost, R. J.: Microbial ectoenzymes in aquatic environments, in: Aquatic microbial ecology: Biochemical and molecular approaches, edited by: Overbeck, J. and Chr ´ost, R. J., Springer 10
Verlag, 47–78, 1990.
DeFlaun, M. F., Paul, J. H., and Jeffrey, W. H.: Distribution and molecular weight of dissolved DNA in subtropical estuarine and oceanic environments, Mar. Ecol. Prog. Ser., 38, 65–73, 1987.
Diehl, H., Ihlefeld, H., and Schwegler, H.: Physik f ¨ur Biologen, Springer-Verlag, 391, 1991. 15
Erga, S. R., Aursland, K., Frette, Ø., Hamre, B., Lotsberg, J. K., Stamnes, J. J., Aure, J., Rey, F., and Stamnes, K.: UV transmission in Norwegian marine waters: controlling factors and possible effects on primary production and vertical distribution of phytoplankton, Mar. Ecol. Prog. Ser., 305, 79–100, 2005.
Fagerbakke, K. M., Heldal, M., and Norland, S.: Content of carbon, nitrogen, oxygen, sulfur and 20
phosphorus in native aquatic and cultured bacteria, Aquat. Microb. Ecol., 10, 15–27, 1996. Fern ´andez, E., Mara ˜n ´on, E., Harbour, D. S., Kristiansen, S., and Heimdal, B. R.: Patterns of
carbon and nitrogen uptake during blooms ofEmiliania huxleyi in two Norwegian fjords, J. Plankton Res., 18, 2349–2366, 1996.
Grasshoff, K.: Determination of nitrate, in: Methods of seawater analysis, edited by: Grasshoff, 25
K., Erhardt, M., and Kremling, K., Verlag Chemie, Weinheim, 143–150, 1983.
Grossart, H.-P., Allgaier, M., Passow, U., and Riebesell, U.: Testing the effect of CO2
concentra-tion on the dynamics of marine heterotrophic bacterioplankton, Limnol. Oceanogr., 51, 1–11, 2006a.
Grossart, H.-P., Czub, G., and Simon, M.: Specific interactions of planktonic algae and bacteria: 30
Implications for aggregation and organic matter cycling in the sea, Environ. Microbiol., 8, 1074–1084, 2006b.
Havskum, H., Thingstad, T. F., Scharek, R., Peters, F., Berdalet, E., Sala, M. M., Alcaraz, M.,
BGD
4, 3343–3375, 2007Algal-bacterial competition for N and
P
T. Løvdal et al.
Title Page
Abstract Introduction
Conclusions References
Tables Figures
◭ ◮
◭ ◮
Back Close
Full Screen / Esc
Printer-friendly Version
Interactive Discussion
EGU
Bangsholt, J. C., Zweifel, U. L., Hagstr ¨om, ˚A., Perez, M., and Dolan, J. R.: Silicate and labile DOC interfere in structuring the microbial food web via algal-bacterial competiton for mineral nutrients: Results from a mesocosm experiment, Limnol. Oceanogr., 48, 129–140, 2003. Ho, T.-Y., Quigg, A., Finkel, Z. V., Milligan, A. J., Wyman, K., Falkowski, P. G., and Morel, F. M.
M.: The elemental composition of some marine phytoplankton, J. Phycol., 39, 1145–1159, 5
2003.
Hollibaugh, J. T. and Azam, F.: Microbial degradation of dissolved proteins in seawater, Limnol. Oceanogr., 28, 1104–1116, 1983.
Hoiczyk, E. and Hansel, A.: Cyanobacterial cell walls: News from an unusual prokaryotic en-velope, J. Bacteriol., 182, 1191–1199, 2000.
10
Ietswaart, T., Schneider, P. J., and Prins, R. A.: Utilization of organic nitrogen sources by two phytoplankton species and a bacterial isolate in pure and mixed cultures, Appl. Environ. Microbiol., 60, 1554–1560, 1994.
Jacobsen, A., Egge, J. K., and Heimdal, B. R.: Effects of increased concentration of nitrate and phosphate during a springbloom experiment in mesocosm, J. Exp. Mar. Biol. Ecol., 187, 15
239–251, 1995.
Joint, I., Henriksen, P., Fonnes, G. A., Bourne, D., Thingstad, T. F., and Riemann, B.: Competi-tion for inorganic nutrients between phytoplankton and bacterioplankton in nutrient manipu-lated mesocosms, Aquat. Microb. Ecol., 29, 145–159, 2002.
Junk, G. and Svec, H. J.: The absolute abundance of the nitrogen isotopes in the atmo-20
sphere and compressed gas from various sources, Geochim. Cosmochim. Acta, 14, 234– 243, 1958.
Jørgensen, N. O. G. and Jacobsen, C. S.: Bacterial uptake and utilization of dissolved DNA, Aquat. Microb. Ecol., 11, 263–270, 1996.
Jørgensen, N. O. G., Kroer, N., Coffin, R. B., Yang, X.-H., and Lee, C.: Dissolved free amino 25
acids, combined amino acids, and DNA as sources of carbon and nitrogen to marine bacte-ria, Mar. Ecol. Prog. Ser., 98, 135–148, 1993.
Karner, M. and Herndl, G. F.: Extracellular enzymatic activity and secondary production in free-living and marine-snow-associated bacteria, Mar. Biol., 113, 341–347, 1992.
Koroleff, F.: Direct determination of ammonia in natural waters as indophenol blue, Council 30
Meeting Document – International Council for the Exploration of the Sea, 19–22, 1969. Koroleff, F.: Determination of phosphorus, in: Methods in seawater analysis, edited by:
BGD
4, 3343–3375, 2007Algal-bacterial competition for N and
P
T. Løvdal et al.
Title Page
Abstract Introduction
Conclusions References
Tables Figures
◭ ◮
◭ ◮
Back Close
Full Screen / Esc
Printer-friendly Version
Interactive Discussion
EGU
Kristiansen, S., Thingstad, T. F., van der Wal, P., Farbrot, T., and Skjoldal, E. F.: AnEmiliania huxleyi dominated subsurface bloom in Samnangerfjorden, western Norway. Importance of hydrography and nutrients, Sarsia, 79, 357–368, 1994.
Kuenzler, E. J. and Perras, J. P.: Phosphatases of marine algae, Biol. Bull., 128, 271–284, 1965.
5
Laws, E. A.: Photosynthetic quotients, new production and net community production in the open ocean, Deep-Sea Res., 38, 143–167, 1991.
Lessard, E. J., Merico, A., and Tyrrell, T.: Nitrate: phosphate ratios and Emiliania huxleyi
blooms, Limnol. Oceanogr., 50, 1020–1024, 2005.
Loferer-Kr ¨oßbacher, M., Klima, J., and Psenner, R.: Determination of bacterial cell dry mass 10
by transmission electron microscopy and densitometric image analysis, Appl. Environ. Mi-crobiol., 64, 688–694, 1998.
Løvdal, T., Skjoldal, E. F., Heldal, M., Norland, S., and Thingstad, T. F.: Changes in morphol-ogy and elemental composition of Vibrio splendidus along a gradient from carbon-limited to phosphate-limited growth, Microb. Ecol., published online first, doi:10.1007/s00248-007-15
9262-x, 2007a.
Løvdal, T., Tanaka, T., and Thingstad, T. F.: Algal-bacterial competition for phosphorus from dissolved DNA, ATP, and orthophosphate in a mesocosm experiment, Limnol. Oceanogr., 52, 1407–1419, 2007b.
Lukacs, G. L., Haggie, P., Seksek, O., Lechardeur, D., Freedman, N., and Verkman, A. S.: 20
Size-dependent DNA mobility in cytoplasm and nucleus, J. Biol. Chem., 275, 1625–1629, 2000.
Martinez, J. and Azam, F.: Aminopeptidase activity in marine chroococcoid cyanobacteria, Appl. Environ. Microbiol., 59, 3701–3707, 1993.
Middelboe, M., Søndergaard, M., Letarte, Y., and Borch, N. H.: Attached and free-living bacte-25
ria: Production and polymer hydrolysis during a diatom bloom, Microb. Ecol., 29, 231–248, 1995.
Montoya, J. P., Voss, M., K ¨ahler, P., and Capone, D. G.: A simple, precision, high-sensitivity tracer assay for N2fixation, Appl. Environ. Microbiol., 62, 986–993, 1996.
Nimer, E., Schneiderman, R., and Maroudas, A.: Diffusion and partition of solutes in cartilage 30
under static load, Biophys. Chem., 106, 125–146, 2003.
Palenik, B. and Henson, S. E.: The use of amides and other organic nitrogen sources by the phytoplanktonEmiliania huxleyi, Limnol. Oceanogr., 42, 1544–1551, 1997.
BGD
4, 3343–3375, 2007Algal-bacterial competition for N and
P
T. Løvdal et al.
Title Page
Abstract Introduction
Conclusions References
Tables Figures
◭ ◮
◭ ◮
Back Close
Full Screen / Esc
Printer-friendly Version
Interactive Discussion
EGU
Pantoja, S. and Lee, C.: Cell-surface oxidation of amino acids in seawater, Limnol. Oceanogr., 39, 1718–1726, 1994.
Paul, J. H.: Uptake of organic nitrogen, in: Nitrogen in the marine environment, edited by: Carpenter, E. J. and Capone, D. G., Academic Press, Inc., New York, 275–308, 1983. Pengerud, B., Skjoldal, E. F., and Thingstad, T. F.: The reciprocal interactions between degrada-5
tion of glucose and ecosystem structure. Studies in mixed chemostat cultures of marine bac-teria, algae, and bacterivorous nanoflagellates, Mar. Ecol. Prog. Ser., 35, 111–117, 1987. Perry, M. J.: Alkaline phosphatase activity in subtropical Central North Pacific waters using a
sensitive fluorometric method, Mar. Biol., 15, 113–119, 1972.
Paasche, E.: A review of the coccolithophoridEmiliania huxleyi(Prymnesiophyceae), with par-10
ticular reference to growth, coccolith formation, and calcification-photosynthesis interactions, Phycologia, 40, 503–529, 2002.
Rees, A. P., Woodward, E. M. S., Robinson, C., Cummings, D. G., Tarran, G. A., and Joint, I.: Size-fractionated nitrogen uptake and carbon fixation during a developing coccolithophore bloom in the North Sea during june 1999, Deep-Sea Res. II, 49, 2905–2927, 2002.
15
Riegman, R., Noordeloos, A. A. M., and Cad ´ee, G. C.:Phaeocystisblooms and eutrophication of the continental coastal zones of the North Sea, Mar. Biol., 112, 479–484, 1992.
Riegman, R., Stolte, W., Noordeloos, A. A. M., and Slezak, D.: Nutrient uptake and alkaline phosphatase (EC 3:1:3:1) activity ofEmiliania huxleyi (Prymnesiophyceae) during growth under N and P limitation in continuous cultures, J. Phycol., 36, 87–96, 2000.
20
Sambrook, J. and Russell, D. W.: Molecular cloning: A laboratory journal, Cold Spring Harbour Laboratory Press, 2001.
Samuelsson, K., Berglund, J., Haecky, P., and Andersson, A.: Structural changes in an aquatic microbial food web caused by inorganic nutrient addition, Aquat. Microb. Ecol., 29, 29–38, 2002.
25
Simon, M., Grossart, H.-P., Schweitzer, B., and Ploug, H.: Microbial ecology of organic aggre-gates in aquatic ecosystems, Aquat. Microb. Ecol., 28, 175–211, 2002.
Smith, D. C., Simon, M., Alldredge, A. L., and Azam, F.: Intense hydrolytic enzyme activity on marine aggregates and implications for rapid particle dissolution, Nature, 359, 139–142, 1992.
30
Sokal, R. R. and Rohlf, F. J.: Biometry, 3rd ed., W. H. Freeman, 207–271, 1995.
BGD
4, 3343–3375, 2007Algal-bacterial competition for N and
P
T. Løvdal et al.
Title Page
Abstract Introduction
Conclusions References
Tables Figures
◭ ◮
◭ ◮
Back Close
Full Screen / Esc
Printer-friendly Version
Interactive Discussion
EGU
tools for detecting P-limited phytoplankton and bacteria, Estuaries and Coasts, 29, 1226– 1241, 2006.
Thingstad, T. F.: Control of bacterial growth in idealized food webs, in: Microbial ecology of the oceans, edited by: Kirchman, D. L., Wiley-Liss, 229–260, 2000.
Thingstad, T. F. and Rassoulzadegan, F.: Conceptual models for the biogeochemical role of the 5
photic zone microbial food web, with particular reference to the Mediterranean Sea, Prog. Oceanogr., 44, 271–286, 1999.
Thingstad, T. F., Skjoldal, E. F., and Bohne, R. A.: Phosphorus cycling and algal-bacterial competition in Sandsfjord, western Norway, Mar. Ecol. Prog. Ser., 99, 239–259, 1993. Zubkov, M. V., Fuchs, B. M., Tarran, G. A., Burkill, P. H., and Amann, R.: High rate of uptake of 10
organic nitrogen compounds byProchlorococcuscyanobacteria as a key to their dominance in oligotrophic waters, Appl. Environ. Microbiol., 69, 1299–1304, 2003.
Zubkov, M. V. and Tarran, G. A.: Amino acid uptake ofProchlorococcus spp. in surface waters across the South Atlantic subtropical front, Aquat. Microb. Ecol., 40, 241–249, 2005.
BGD
4, 3343–3375, 2007Algal-bacterial competition for N and
P
T. Løvdal et al.
Title Page
Abstract Introduction
Conclusions References
Tables Figures
◭ ◮
◭ ◮
Back Close
Full Screen / Esc
Printer-friendly Version
Interactive Discussion
EGU
Table 1. Uptake of labelled substrate in the>0.8µm size fraction as percent of total uptake. Pooled data for inorganic and organic N and P substrates, grouped in samples withTNH4longer than and shorter than 10 h. Means with standard deviation.
Substrate TNH4>10 h TNH4<10 h
DIN 83±7 96±1
DON 35±28 74±6
DIP 72±22 80±7
BGD
4, 3343–3375, 2007Algal-bacterial competition for N and
P
T. Løvdal et al.
Title Page
Abstract Introduction
Conclusions References
Tables Figures
◭ ◮
◭ ◮
Back Close
Full Screen / Esc
Printer-friendly Version
Interactive Discussion
EGU
Table 2.Uptake of labelled substrates by particle-associated bacteria and phytoplankton given as percent of total uptake. Estimates from Eq. (2) assuming similar affinity in particle-associated bacteria as in free-living bacteria (see text). Pooled data for inorganic and organic N and P substrates, grouped in samples withTNH4 longer than and shorter than 10 h. Means with standard deviation.
Substrate particle-associatedTNH4>10 hphytoplankton particle-associatedTNH4<10 hphytoplankton bacteria bacteria
DIN 16±7 67±9 18±7 78±8
DON 28±17 7±13 73±6 1±1
DIP 4±3 68±24 22±6 58±12
DOP 10±2 15±10 23±13 54±25
BGD
4, 3343–3375, 2007Algal-bacterial competition for N and
P
T. Løvdal et al.
Title Page
Abstract Introduction
Conclusions References
Tables Figures
◭ ◮
◭ ◮
Back Close
Full Screen / Esc
Printer-friendly Version
Interactive Discussion
EGU
Day
0
2
4
6
8 10 12 14 16 18 20
DI
N:
SR
P
0
4
8
12
16
20
24
28
32
Day
0
2
4
6
8
10 12 14 16 18 20
DI
N:
SR
P
0
4
8
12
16
20
24
28
32
PO
4added
BGD
4, 3343–3375, 2007Algal-bacterial competition for N and
P
T. Løvdal et al.
Title Page
Abstract Introduction
Conclusions References
Tables Figures
◭ ◮
◭ ◮
Back Close
Full Screen / Esc
Printer-friendly Version
Interactive Discussion
EGU
S-
α
PO4
Day
0 2 4 6 8 10 12 14 16 18 20
S
-APA (
h
-1 )
0,00 0,02 0,04 0,06
PO
4
(L
nm
ol
-P
-1 h -1 )
0 2e-3 4e-3 6e-3
0 2e-5 4e-5 6e-5 8e-5
S-APA
NH4
/NO3
(L
nm
ol
-N
-1 h -1 )
S-α
S-α
S-
α
ΝΟ3
S-
α
ΝΗ4
S-
α
PO4
Fig. 2. APA and affinity for PO3−
4 uptake, and affinity for NO
−
3 and NH
+
4 uptake, normalized for
the summed P-biomass of phytoplankton and bacteria and the summed N-biomass of phyto-plankton and bacteria, respectively.
BGD
4, 3343–3375, 2007Algal-bacterial competition for N and
P
T. Løvdal et al.
Title Page
Abstract Introduction
Conclusions References
Tables Figures
◭ ◮
◭ ◮
Back Close
Full Screen / Esc
Printer-friendly Version
Interactive Discussion
EGU
T
(h)
1 10 100 1000
NO3 NH4 Leucine
Day
0 2 4 6 8 10 12 14 16 18 20
T
(h)
1 10 100 1000
PO4 ATP dDNA
A
B
BGD
4, 3343–3375, 2007Algal-bacterial competition for N and
P
T. Løvdal et al.
Title Page
Abstract Introduction
Conclusions References
Tables Figures
◭ ◮
◭ ◮
Back Close
Full Screen / Esc
Printer-friendly Version
Interactive Discussion
EGU
0 5 10 15 20
Ra
ti
o of
[
33
P
] upt
ake
0,0 0,2 0,4 0,6 0,8 1,0
0.8 - 0.2 µm > 0.8 µm
15 NH4
Day
0 5 10 15 20
AT33P
0 5 10 15 20
[33P]DNA [15N]Leucine
33 PO4
Ra
ti
o of [
15
N
] upt
a
ke
0,0 0,2 0,4 0,6 0,8 1,0
15 NO3
Fig. 4.Relative proportions of incorporated label in the two size fractions.
BGD
4, 3343–3375, 2007Algal-bacterial competition for N and
P
T. Løvdal et al.
Title Page
Abstract Introduction
Conclusions References
Tables Figures
◭ ◮
◭ ◮
Back Close
Full Screen / Esc
Printer-friendly Version
Interactive Discussion
EGU
(L
nm
ol
-N
-1 h -1)
1e-7 1e-6 1e-5 1e-4 1e-3
0.8 - 0.2 µm > 0.8 µm Bacteria Phytoplankton
15
NH4 [15N]Leucine
12 14 16 18 20
(L
nm
ol
-P
-1 h -1)
1e-6 1e-5 1e-4 1e-3 1e-2
α
α
33
PO4
Day
12 14 16 18 20
AT33P
12 14 16 18 20
[33P]DNA
A B
C D E
Fig. 5. Biomass-specific affinity (logarithmic scale) for the uptake of(A)NH+4,(B)Leucine-N, (C)PO3−
4 ,(D)ATP-P, and(E)dDNA-P in the two size fractions (solid lines), and in bacteria and
BGD
4, 3343–3375, 2007Algal-bacterial competition for N and
P
T. Løvdal et al.
Title Page
Abstract Introduction
Conclusions References
Tables Figures
◭ ◮
◭ ◮
Back Close
Full Screen / Esc
Printer-friendly Version
Interactive Discussion
EGU
α
α
(L
nm
ol
-P
-1 h
-1 )
(L
nm
ol
-N
-1 h
-1 )
10-7
10-6
10-5
10-4
10-3
10-2
10-1
Bacteria Phytoplankton
0 1 2
10-5
10-4
10-3
10-2
10-1
100
NH4
PO4
Leucine
Cell radius (µm)
0 1 2
ATP
0 1 2
dDNA
A B
C D E
Fig. 6.Comparison of the mean estimated biomass-specific affinity values during the N-limited phase (±SD,n=5) of phytoplankton and bacteria vs. the theoretical maximum affinity by the
diffusion model. The assumption for the diffusion model is that the diffusion constant (D) for small molecules like NH+4 and PO3−
4 is 10
−5
cm2s−1
, D for leucine is 3.7×10⁻⁶cm2s−1
(Nimer et al., 2003), D for ATP is 3.0×10⁻⁶cm2s−1 (Diehl et al., 1991), and D for DNA is
4.9×10⁻⁶cm2s−1×(basepair size)−0.72(Lukacs et al., 2000). The solid and dotted lines denote
the theoretical maximum for bacteria and phytoplankton, respectively, assuming the cell density is 1.2 g cm−3
for bacteria and phytoplankton, dry weight is 50% of wet weight, C weight is 50% of dry weight, and the molar C:N:P ratio is 50:10:1 for bacteria and 106:16:1 for phytoplankton. The dashed line denotes the theoretical maximum forE. huxleyi, assuming minimum N and P cell quotas; e.g. 1.1 and 0.05 fmolµm−3
, respectively (cf. Riegman et al., 2000).