www.biogeosciences.net/5/1007/2008/
© Author(s) 2008. This work is distributed under the Creative Commons Attribution 3.0 License.
Biogeosciences
Coupling of heterotrophic bacteria to phytoplankton bloom
development at different
p
CO
2
levels: a mesocosm study
M. Allgaier1,*, U. Riebesell2, M. Vogt3, R. Thyrhaug4, and H.-P. Grossart1
1Leibniz-Institute of Freshwater Ecology and Inland Fisheries; Department Limnology of Stratified Lakes; Alte Fischerhuette 2; D-16775 Stechlin-Neuglobsow, Germany
2Leibniz- Institute for Marine Sciences, University of Kiel, Duesternbrooker Weg 20, D-24105 Kiel, Germany
3Laboratory for Global Marine and Atmospheric Chemistry, School of Environmental Sciences, University of East Anglia, Norwich NR 7TJ, UK
4Department of Biology, Jahnebakken 5, University of Bergen, Norway
*currant address: DOE Joint genome Inst., Microbial Ecology Program, 2800 Mitchell Drive, Walnut Creek, CA 94598, USA Received: 13 November 2007 – Published in Biogeosciences Discuss.: 29 January 2008
Revised: 18 June 2008 – Accepted: 19 June 2008 – Published: 21 July 2008
Abstract. The predicted rise in anthropogenic CO2
emis-sions will increase CO2 concentrations and decrease sea-water pH in the upper ocean. Recent studies have re-vealed effects ofpCO2induced changes in seawater chem-istry on a variety of marine life forms, in particular cal-cifying organisms. To test whether the predicted increase inpCO2 will directly or indirectly (via changes in phyto-plankton dynamics) affect abundance, activities, and com-munity composition of heterotrophic bacteria during phyto-plankton bloom development, we have aerated mesocosms with CO2 to obtain triplicates with three different partial pressures of CO2 (pCO2): 350µatm (1×CO2), 700µatm (2×CO2)and 1050µatm (3×CO2). The development of a phytoplankton bloom was initiated by the addition of nitrate and phosphate. In accordance to an elevated carbon to ni-trogen drawdown at increasingpCO2, bacterial production (BPP) of free-living and attached bacteria as well as cell-specific BPP (csBPP) of attached bacteria were related to the C:N ratio of suspended matter. These relationships signifi-cantly differed among treatments. However, bacterial abun-dance and activities were not statistically different among treatments. Solely community structure of free-living bac-teria changed withpCO2 whereas that of attached bacteria seemed to be independent of pCO2 but tightly coupled to phytoplankton bloom development. Our findings imply that changes inpCO2, although reflected by changes in
commu-Correspondence to:H.-P. Grossart ([email protected])
nity structure of free-living bacteria, do not directly affect bacterial activity. Furthermore, bacterial activity and dynam-ics of heterotrophic bacteria, especially of attached bacteria, were tightly correlated to phytoplankton development and, hence, may also potentially depend on changes inpCO2.
1 Introduction
there is hardly any comparable study available for marine ecosystems. In a previous mesocosm study (Grossart et al., 2006b) we indeed found a measurable but indirect effect of changes inpCO2on bacterial abundance and activities. This effect was mainly linked to algal and presumably particle dy-namics.
Senescent planktonic algae and aggregates are rapidly col-onized by bacteria (e.g. Smith et al., 1995; Simon et al., 2002) which have a repertoire of hydrolytic enzymes (Hoppe et al., 1993; Martinez et al., 1996) for efficient POM solu-bilisation to DOM (Smith et al., 1992; Grossart and Ploug, 2001). Even though DOM of algal origin can be rapidly used by bacteria (Grossart et al., 2006a), a seasonal accumulation of DOM in the oceanic photic zone is commonly observed (Williams, 1995) and may indicate a semi-labile nature of the released dissolved organic carbon (DOC; Søndergaard et al., 2000). A substantial fraction (25 to 35%) of DOC re-leased from phytoplankton can even resist microbial degra-dation for years (Fry et al., 1996). Alternatively to low bioavailability, temporary accumulation of POC and DOC has been explained by a “malfunctioning microbial loop”, e.g. when nutrient availability limits bacterial growth and vi-ral lysis as well as grazing the bacterial biomass (Thingstad et al., 1997; Williams, 1995). However, it has been suggested that viruses primarily influence bacterial community compo-sition, while grazers have a greater impact on total bacterial biomass (Thingstad, 2000).
On the other hand, DOM released by phytoplankton affect formation of particles, such as transparent exopolymer par-ticles (TEP) and aggregates (Grossart et al., 2006a). Most notably, TEP have been identified as an important agent for aggregation (Passow, 2002). Various studies have shown that TEP are produced by planktonic algae, but also by bacte-ria and from dissolved precursor matebacte-rial (Zhou et al., 1998; Passow, 2002; Engel et al., 2004). Those processes, how-ever, greatly depend on the physiological state of the algae (Grossart et al., 2006a).
Hence, the main purpose of the present study was to evaluate whether the expected future changes inpCO2will change abundance, activities, and community structure of heterotrophic bacteria during the build up and decline of a phytoplankton bloom. We wanted to test whether het-erotrophic bacteria are directly affected by changes inpCO2 or more indirectly react topCO2induced changes in phyto-plankton bloom development (as has been proposed by our earlier paper; Grossart et al., 2006b). This paper is part of a larger mesocosm study on the effects of CO2induced sea-water acidicication on complex plankton communities. An overview of all studies performed and their major results are given by Riebesell et al. (2008).
2 Materials and methods
2.1 Experimental set up and sampling
The mesocosm study was performed between 15 May and 9 June 2005 at the Espegrend Marine Biological Station (at Raunefjorden, 60.2◦N, 5.1◦E) of the University of Bergen, Norway. Nine polyethylene enclosures (∼27 m3, 9.5 m water depth) were moored to a raft equipped with a small floating laboratory. The enclosures were simultaneously filled with unfiltered, nutrient-poor, post-bloom fjord water from 13.5 m depth. To avoid disturbances by faecal matter of seabirds and to maintain headspaces at targetpCO2, the enclosures were covered by gas-tight tents made of ETFE foil, which allowed for 95% light transmission of the complete spectrum of sun-light. The mesocosms were aerated with CO2to obtain tripli-cates of three different levels, 350µatm (1×CO2), 700µatm (2×CO2)and 1050µatm (3×CO2)(for details see Riebesell et al., 2007; Schulz et al., 2008). Continuous flushing of the tents with air adjusted to target CO2concentrations ensured that starting values were kept in the headspace throughout the experiment. The addition and subsequent mixing of 800 litres of freshwater into the upper 5.5 m of the mesocosms, resulted in water column stratification with a salinity gra-dient of 1.5 between the surface mixed layer (S=30.5) and the underlying water column. A homogenous distribution of dissolved compounds was achieved by continuous mixing of the upper layer by peristaltic pumps (flow rate 450 l h−1). The development of a phytoplankton bloom was initiated by the addition of nitrate and phosphate (initial concentrations of 14µmol l−1 NO3 and 0.7µmol l−1 PO4). The experi-ment started at a post-bloom Si(OH)4level of 3.2µmol l−1. Development and decline of the phytoplankton bloom was monitored daily over a 24 day period. Depth-integrated wa-ter samples were taken daily at 10 a.m. by means of a 5 m long, 8 cm diameter tube which was lowered into the meso-cosms, closed at the top, pulled up onto the raft and emptied into sampling bottles. Bottles were stored until further pro-cessing in a cold room adjusted to the in situ temperature of the fjord. For comparison water samples were also taken from the adjacent fjord at the same depth.
2.2 Bacterial numbers
For enumeration of free and particle-associated bacteria 1 or 5 ml of seawater were filtered onto black 0.2 and 5.0µm pore size Nuclepore membranes, respectively. The filters were stained with SYBR Gold (Invitrogen) and stored frozen at –20◦C until counting. Bacteria were counted by epifluo-rescence microscopy (DR-MB, Leica, Germany) at 1000×
magnification. The number of free bacteria was calculated by subtracting the number of particle-associated bacteria (5.0µm filters) from that of total bacteria (0.2µm filters). Comparison with flow cytometry (Paulino et al., 2008) indi-cated that our numbers were overestimated due to the pres-ence of big viruses within a size range of 100 to 200 nm which could not be reliably distinguished from bacteria by epifluorescence microscopy. Therefore, the abundance of free-living bacteria has been corrected for the abundance of big viruses.
2.3 Bacterial production
Rates of bacterial protein production (BPP) were deter-mined by incorporation of 14[C]-leucine (14C-Leu, Simon and Azam, 1989). Triplicates and a formalin-killed con-trol were incubated with 14C-Leu (1.15×10¹⁰Bq mmol−1, Amersham, England) at a final concentration of 50 nmol l−1, which ensured saturation of uptake systems of both free and particle-associated bacteria. Incubation was performed in the dark at in situ temperature (9 to 11.5◦C) for 1 h. After fixa-tion with 2% formalin, samples were filtered onto 5.0µm (at-tached) and 0.2µm (total isotope incorporation) nitrocellu-lose filters (Sartorius, Germany) and extracted with ice-cold 5% trichloroacetic acid (TCA) for 5 min. Thereafter, filters were rinsed twice with ice-cold 5% TCA, once with ethanol (96% v/v), and dissolved with ethylacetate for measurement by liquid scintillation counting. Standard deviation of trip-licate measurements was usually<15%. BPP of free bacte-ria was calculated by subtraction of attached BPP from to-tal BPP. The amount of incorporated14C-Leu was converted into BPP by using an intracellular isotope dilution factor of 2. A conversion factor of 0.86 was used to convert the protein produced into carbon (Simon and Azam, 1989). Cell-specific BPP was calculated for both bacterial fractions by taking the respective cell numbers into account.
2.4 DNA extraction and PCR amplification of 16S rRNA gene fragments
Particle-associated and free-living bacteria were separated by sequential filtration of the water samples throughout 5.0 and 0.2µm Nuclepore polycarbonate filters, respectively. Particle-associated bacteria were retained by filtering 150 ml of sample onto a 5.0µm Nuclepore membrane, whereas free-living bacteria were collected by filtering 100 ml of the 5.0µm filtrate onto a 0.2µm Nuclepore membrane. Filters
were transferred into sterile Eppendorf tubes and kept frozen at –20◦C until pending DNA extraction. Extraction of ge-nomic DNA was performed, using a standard protocol with phenol/chloroform/isoamylalcohol, SDS, polyvinylpyrroli-done, and zirconium beads as described previously (Allgaier and Grossart, 2006a).
For denaturing gradient gel electrophoresis (DGGE) a 550 bp fragment of the 16S rRNA gene was amplified using the primer pair 341f and 907r (5′ – CCT ACG GGA GGC AGC AG – 3′ and 5′ – CCG TCA ATT CMT TTG AGT TT – 3′, Muyzer et al., 1998). At the 5′-end of the primer 341f an additional 40 bp GC-rich nucleotide sequence (GC-clamp) was added to stabilize migration of the DNA frag-ment in the DGGE (Muyzer et al., 1993). The PCR reaction mixture contained: 2 to 5µl template DNA, each primer at a concentration of 200 nM, each deoxyribonucleoside triphos-phate at a concentration of 250µM, 2 mM MgCl2, 5µl of 10×PCR reaction buffer, and 0.5 U of BIOTAQ Red DNA Polymerase (Bioline) in a total volume of 50µl. PCR ampli-fication was performed with a Gradient Cycler PT-200 (MJ Research) using the following conditions: initial denatura-tion at 95◦C (3 min), followed by 30 cycles of denaturation at 95◦C (1 min), annealing at 55◦C (1 min), and extension at 72◦C (2 min). A final extension at 72◦C for 10 min com-pleted the reaction.
2.5 Denaturing gradient gel electrophoresis (DGGE) and sequencing
DGGE was performed as described previously (Allgaier and Grossart, 2006b) in a 7% (v/v) polyacrylamide gel with a de-naturing gradient from 40 to 70% of urea and formamide. Prior loading of PCR products onto DGGE gels, DNA was quantified on agarose gels using a quantitative DNA ladder (Low DNA Mass Ladder, Invitrogen) and similar amounts of DNA were loaded onto the DGGE gels. DGGE gels were run in 1×TAE electrophoresis buffer (40 mM Tris-HCl (pH 8.3), 20 mM acetic acid, 1 mM EDTA) for 20 h at a con-stant voltage of 100 V and a concon-stant temperature of 60◦C. The gels were stained with 1 x SYBR Gold (Invitrogen) and documented using an AlphaImager 2200 Transilluminator (Biozym).
For sequencing, several DGGE bands were excised and in-cubated over night at 35◦C in elution buffer (0.5 M Ammo-nia acetate, 1 mM EDTA). Eluted DNA fragments were pre-cipitated using 0.3 vol. 7.5 M ammonia acetate and 0.7 vol. isopropanol and purified with 70% ethanol. DNA frag-ments were sequenced as described previously (Allgaier and Grossart, 2006a) using primers 341f and 907r.
2.6 Analyses of DGGE profiles
GelCompar II first a band based binary presence/absence table was calculated applying Dice similarity coefficient. This presence/absence table was imported into the software PRIMER 5 and used for hierarchical clustering analyses and analyses of similarity (ANOSIM). To avoid distortions orig-inating from non-normal distribution of the species data of the DGGE gels we used a Bray-Curtis similarity matrix for cluster analyses and ANOSIM rather than the original data matrix. For cluster analyses the complete linkeage rithm was used provided by the software package. This algo-rithm calculates distances between clusters (Clarke and Gor-ley, 2001).
2.7 Phylogenetic analysis
Phylogenetic analyses of the partial 16S rRNA gene se-quences were done using the ARB software package (http:// www.arb-home.de). The retrieved sequences were imported into an ARB database of 52 000 reference sequences in-cluding the closest related sequences determined by BLAST (http://www.ncbi.nlm.nih.gov/BLAST/). Sequences were first aligned automatically by the integrated alignment mod-ule within the ARB package and subsequently corrected manually. For stability of the phylogenetic tree a backbone tree was calculated comprising only sequences of≥1400 nu-cleotides. Sequences≤1400 nucleotides were added after-wards to the tree according to maximum parsimony crite-ria. Consistence of branching patterns was checked apply-ing the three phylogenetic reconstruction methods: neighbor-joining, maximum parsimony, and maximum likelihood to the appropriate set of sequences. The final tree was calcu-lated using the maximum likelihood algorithm.
2.8 Nucleotide sequence accession numbers
Partial sequences of 16S rRNA gene fragments obtained in this study have been deposited in GenBank with the follow-ing accession numbers: EU179278 – EU179311.
2.9 Statistical analysis
In order to determine if measured parameters over time dif-fered significantly betweenpCO2levels,statistical analyses were done by repeated measures ANOVA for analyzing the treatment effect using the software SPSS 9.0. If the spheric-ity of the variance-covariance matrix was violated the de-grees of freedom were altered according to the Mauchly test using Greenhouse Geisser Epsilon. Furthermore, we used the “linear regression” module of the SPSS 9.0 software. All re-gressions were tested for dependency onpCO2by applying the CHOW test with univariate GLM. This determines if the regression parameters are different between differentpCO2 levels. Dependencies of bacterial parameters from other en-vironmental parameters were tested by “stepwise” multiple regression analysis. Significance was given at values<0.05.
To test the significance of differences between the DGGE banding patterns ANOSIM (Clarke and Green, 1988) was ap-plied. ANOSIM generates a test statistic (R) which is an indication of the degree of separation between groups. A score of 1 indicates complete separation whereas a score of 0 indicates no separation. DGGE banding patterns were also analyzed by non-metric multidimensional scaling (NMS) or-dinations using the software package PC-ORD, Version 4.0 (MJM Software Design). Similar to ANOSIM a binary pres-ence/absence table was used for all NMS analyses. The ad-vantage of NMS over other multivariate statistical methods (e.g. canonical correspondence analysis, CCA) is that this method uses rank order information of a similarity matrix of the samples rather than the original data matrix. Thus, NMS avoids distortions originating from the non-normal dis-tribution of the species data of the DGGE gels (McCune and Grace, 2002).
3 Results
3.1 Bacterial abundance
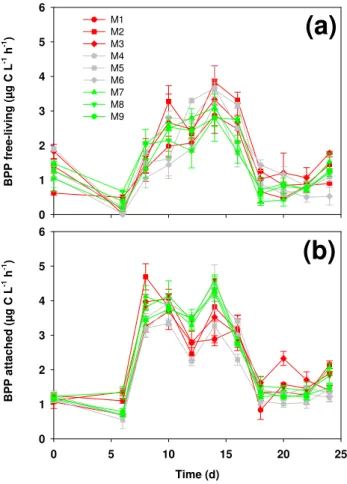
Abundances of either free-living or attached bacteria were almost identically among all mesocosms irrespective of their pCO2 (Fig. 1a and b). Except for high abundances at the beginning of the experiment, free-living bacteria reached a pronounced maximum of ca. 5 to 6×10⁶cells ml−1 be-tween days 12 and 16 (Fig. 1a) during the decline of the al-gal bloom. Abundances of free-living bacteria dropped to a low of ca. 1 to 3×10⁶cells ml−1between days 18 and 20 and thereafter increased to ca. 3 to 6×10⁶cells ml−1at the end of the experiment when dinoflagellate and cyanobac-terial abundances increased. Numbers of attached bacte-ria were lower and showed a different temporal pattern (Fig. 1b). Numbers of attached bacteria were relatively high at the beginning of the experiment but declined until day 6. Attached bacteria reached a maximum of 0.28 to 0.42×10⁶cells ml−1between days 10 to 14, slightly earlier than free-living bacteria. Thereafter, they slowly decreased to∼0.20 to 0.23×10⁶cells ml−1at the end of the experiment. 3.2 Bacterial protein production (BPP)
!
"
#
!
$ $ $ $ $ $
(a
(b
Fig. 1. (a)Abundance of free-living (≤5.0µm≥0.2µm) and(b)
attached bacteria (≥5.0µm). M1–M3 mesocosms with 3×CO2, M4–M6 mesocosms with 2×CO2, and M7–M9 mesocosms with
1×CO2.
to 4.6µg C l−1h−1. Similarly to free-living bacteria, BPP of attached bacteria was rather low (0.9 to 2.2µg C l−1h−1) be-tween days 18 and 22 and slightly increased at the end of the experiment.
3.3 Cell-specific bacterial protein production (csBPP) csBPP of both free-living and attached bacteria showed a similar temporal pattern but greatly differed in magni-tude (Fig. 3a and b). A pronounced maximum of cs-BPP of free-living bacteria occurred on days 6 to 8 (1.1 to 2.4 fg C cell−1h−1, Fig. 3a) almost in parallel to the first peak in primary production indicating a strong coupling be-tween phytoplankton growth and bacterial activity. How-ever, csBPP of free-living bacteria was rather low (0.6 to 0.8 fg C cell−1h−1)during and shortly after the second peak in primary production. Thereafter, csBPP of free-living bacteria continuously decreased towards the end of the ex-periment. CsBPP of attached bacteria increased in paral-lel to primary production and reached a first peak (16 to
BPP free-living (µ
g C L
-1 h -1 )
0 1 2 3 4 5 6
M1 M2 M3 M4 M5 M6 M7 M8 M9
Time (d)
0 5 10 15 20 25
BP
P attached (µ
g C L
-1 h -1 )
0 1 2 3 4 5 6
(a)
(b)
Fig. 2. Bacterial protein production (BPP) of (a) free-living
(≤5.0µm≥0.2µm) and(b)attached bacteria (≥5.0µm). M1–M3 mesocosms with 3×CO2, M4–M6 mesocosms with 2×CO2, and
M7–M9 mesocosms with 1×CO2.
36 fg C cell−1h−1) on days 6 to 8. In parallel to csBPP of free-living bacteria, csBPP of attached bacteria was also lower (7 to 14 fg C cell−1h−1)during and shortly after the second peak in primary production. CsBPP of attached bac-teria further dropped (to 3 to 10 fg C cell−1h−1) between days 18 and 24 when primary production and phytoplankton abundance was rather low.
3.4 Statistical analysis
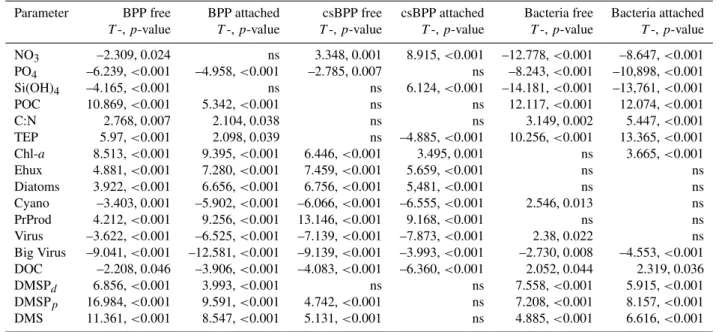
Table 1.Linear regression analysis between measured bacterial parameters and environmental variables. BPP free/attached (bacterial pro-duction of free and attached bacteria, respectively), cs BPP free/attached (cell-specific BPP of free and attached bacteria, respectively), Bacteria free/attached (abundance of free-living and attached bacteria, respectively), NO3, PO4, Si(OH)4, POC (particulate organic carbon),
C:N (C:N ratio of particulate matter), TEP (transparent exopolymer particles), Chl-a(chlorophyll-a), Ehux (coccolithophoreEmiliania hux-leyi), Diatoms (diatoms primarilySkeletonema costatumandNitzschia longissima), Cyano (cyanobacteria), PrProd (primary production), Virus (total virus), Big Virus (distinct group of big virus with a size of up to 200 nm), DOC (dissolved organic matter), DMSP (dimethyl-sulfoniopropionate), DMS (dimethylsulfide), ns (not significant), for TEPn=89, for POC and C:Nn=87, for NO3, PO4, Sin=80, for DOC n=72, for DMSPdn=88, for all other parametern=90.
Parameter BPP free BPP attached csBPP free csBPP attached Bacteria free Bacteria attached T-,p-value T-,p-value T-,p-value T-,p-value T-,p-value T-,p-value
NO3 –2.309, 0.024 ns 3.348, 0.001 8.915,<0.001 –12.778,<0.001 –8.647,<0.001
PO4 –6.239,<0.001 –4.958,<0.001 –2.785, 0.007 ns –8.243,<0.001 –10,898,<0.001
Si(OH)4 –4.165,<0.001 ns ns 6.124,<0.001 –14.181,<0.001 –13,761,<0.001 POC 10.869,<0.001 5.342,<0.001 ns ns 12.117,<0.001 12.074,<0.001
C:N 2.768, 0.007 2.104, 0.038 ns ns 3.149, 0.002 5.447,<0.001
TEP 5.97,<0.001 2.098, 0.039 ns –4.885,<0.001 10.256,<0.001 13.365,<0.001 Chl-a 8.513,<0.001 9.395,<0.001 6.446,<0.001 3.495, 0.001 ns 3.665,<0.001 Ehux 4.881,<0.001 7.280,<0.001 7.459,<0.001 5.659,<0.001 ns ns Diatoms 3.922,<0.001 6.656,<0.001 6.756,<0.001 5,481,<0.001 ns ns Cyano –3.403, 0.001 –5.902,<0.001 –6.066,<0.001 –6.555,<0.001 2.546, 0.013 ns PrProd 4.212,<0.001 9.256,<0.001 13.146,<0.001 9.168,<0.001 ns ns Virus –3.622,<0.001 –6.525,<0.001 –7.139,<0.001 –7.873,<0.001 2.38, 0.022 ns Big Virus –9.041,<0.001 –12.581,<0.001 –9.139,<0.001 –3.993,<0.001 –2.730, 0.008 –4.553,<0.001 DOC –2.208, 0.046 –3.906,<0.001 –4.083,<0.001 –6.360,<0.001 2.052, 0.044 2.319, 0.036 DMSPd 6.856,<0.001 3.993,<0.001 ns ns 7.558,<0.001 5.915,<0.001
DMSPp 16.984,<0.001 9.591,<0.001 4.742,<0.001 ns 7.208,<0.001 8.157,<0.001
DMS 11.361,<0.001 8.547,<0.001 5.131,<0.001 ns 4.885,<0.001 6.616,<0.001
and csBPP of both free-living and attached bacteria, how-ever, may indicate a direct dependency of bacterial activity on NO3availability.
BPP and csBPP of both free-living and attached bacte-ria were positively correlated to almost all algal parame-ters (chlorophyll-a (Chl-a), abundances of Emiliania hux-leyi (Ehux) and diatoms (Diatoms), primary production (PrProd), dissolved and particulate dimethylsulfoniopropi-onate (DMSPp and DMSPd, respectively), and dimethyl-sulfide (DMS) but negatively correlated to abundances of cyanobacteria (Cyano), total viruses (Virus), virus in the size range of 100 to 200 nm (Big Virus), and surprisingly to DOC. POC and C:N ratio of the suspended matter were positively correlated to BPP but not to csBPP of free-living and at-tached bacteria suggesting that increased POC and C:N ra-tios do not affect the activity of individual cells but set an activity level for total bacteria. CsBPP of attached bacteria was negatively correlated to TEP. Bacterial numbers (both free-living and attached), however, were positively related to POC, C:N, TEP, DOC, and DMSPp+d (and DMS) indicat-ing that the presence of potential bacterial substrates lead to increases in bacterial abundance.
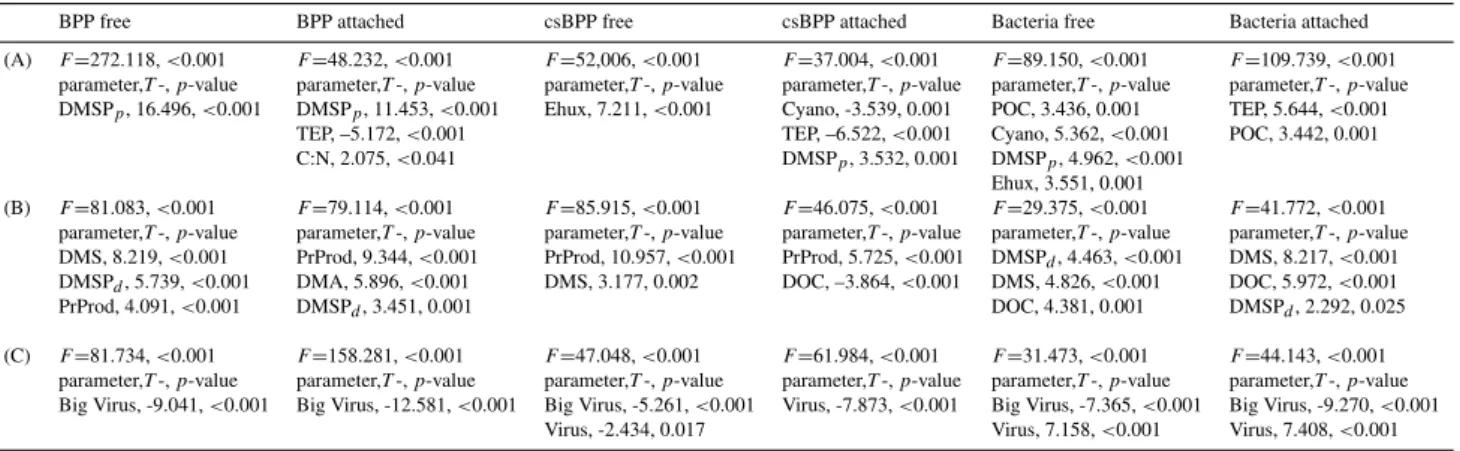
To reduce the number of significant correlations between measured bacterial and environmental variables we have used a stepwise multiple regression analysis (Table 2). For
particulates (Table 2a) the analysis revealed that BPP of free-living and attached bacteria was tightly correlated to DMSPp. Additionally, BPP of attached bacteria was neg-atively correlated with TEP and positively with C:N ratio of particulates. CsBPP of free-living was exclusively posi-tively correlated to Ehux whereas csBPP of attached bacteria was negatively related to the abundance of Cyano and TEP and positively to DMSPp. Abundance of free-living bacte-ria was positively related to POC, Cyano, DMSPp, and Ehux whereas abundance of attached bacteria was positively corre-lated with TEP and POC. The negative correlation between TEP, on one hand, and csBPP and abundance of attached bac-teria, on the other hand, indicates that TEP -due to its sticking properties- may be efficient in scavenging bacteria from the surrounding water but a poor bacterial substrate.
Table 2.Results of stepwise multiple regression analysis. Parameters correlated to(A)particulates (POC, C:N, TEP, DMSPp, Chl-a, Ehux,
Diatoms, Cyano),(B)dissolved organic matter and primary production (DOC, DMS, DMSPd, PrProd), and(C)virus (Virus, Big Virus). For
abbreviations and n see legend Table 1.
BPP free BPP attached csBPP free csBPP attached Bacteria free Bacteria attached
(A) F=272.118,<0.001 F=48.232,<0.001 F=52,006,<0.001 F=37.004,<0.001 F=89.150,<0.001 F=109.739,<0.001
parameter,T-,p-value parameter,T-,p-value parameter,T-,p-value parameter,T-,p-value parameter,T-,p-value parameter,T-,p-value
DMSPp, 16.496,<0.001 DMSPp, 11.453,<0.001 Ehux, 7.211,<0.001 Cyano, -3.539, 0.001 POC, 3.436, 0.001 TEP, 5.644,<0.001
TEP, –5.172,<0.001 TEP, –6.522,<0.001 Cyano, 5.362,<0.001 POC, 3.442, 0.001
C:N, 2.075,<0.041 DMSPp, 3.532, 0.001 DMSPp, 4.962,<0.001
Ehux, 3.551, 0.001
(B) F=81.083,<0.001 F=79.114,<0.001 F=85.915,<0.001 F=46.075,<0.001 F=29.375,<0.001 F=41.772,<0.001
parameter,T-,p-value parameter,T-,p-value parameter,T-,p-value parameter,T-,p-value parameter,T-,p-value parameter,T-,p-value
DMS, 8.219,<0.001 PrProd, 9.344,<0.001 PrProd, 10.957,<0.001 PrProd, 5.725,<0.001 DMSPd, 4.463,<0.001 DMS, 8.217,<0.001
DMSPd, 5.739,<0.001 DMA, 5.896,<0.001 DMS, 3.177, 0.002 DOC, –3.864,<0.001 DMS, 4.826,<0.001 DOC, 5.972,<0.001
PrProd, 4.091,<0.001 DMSPd, 3.451, 0.001 DOC, 4.381, 0.001 DMSPd, 2.292, 0.025
(C) F=81.734,<0.001 F=158.281,<0.001 F=47.048,<0.001 F=61.984,<0.001 F=31.473,<0.001 F=44.143,<0.001
parameter,T-,p-value parameter,T-,p-value parameter,T-,p-value parameter,T-,p-value parameter,T-,p-value parameter,T-,p-value
Big Virus, -9.041,<0.001 Big Virus, -12.581,<0.001 Big Virus, -5.261,<0.001 Virus, -7.873,<0.001 Big Virus, -7.365,<0.001 Big Virus, -9.270,<0.001
Virus, -2.434, 0.017 Virus, 7.158,<0.001 Virus, 7.408,<0.001
The stepwise multiple regression analysis for virus re-vealed a negative relationship between the abundance of big virus and most bacterial parameters (BPP and abundance of free-living and attached bacteria and csBPP of free-living bacteria). Interestingly, csBPP of free-living and attached bacteria were negatively but abundances of both free-living and attached bacteria positively correlated to total virus. To get a better estimate on virus production we have estimated viral production bynt−nt−1(wherebynt=viral abundance at a given time point andnt−1=viral abundance 1 day before sampling time point) and specific viral production by (nt -nt−1)/(nt+nt−1)/2. Our estimates revealed that solely num-bers of free-living and attached bacteria were positively cor-related with viral production and even better with specific viral production. In contrast, the production of big virus was negatively correlated with csBPP of free-living and at-tached bacteria but not with their abundance. This suggests that the role of virus in controlling bacterial dynamics can be contrary. In addition to bacteriophages, Larsen et al. (2008) found several phytoplankton viruses in the present experi-ment. Preferential lysis of algal cells may result in release of phytoplanktonic DOM and, hence, serves as an important DOM source for bacteria.
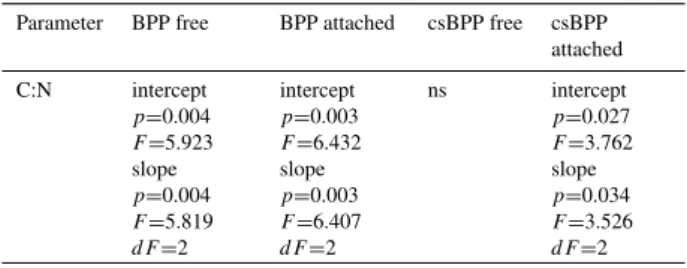
To further test for dependency on pCO2 we have per-formed the CHOW test with univariate GLM (Table 3). Solely, linear regressions between BPP of free-living bacte-ria, BPP of attached bacteria or csBPP of attached bacteria and the C:N ratio of suspended matter revealed a significant effect ofpCO2.
3.5 Molecular characterization of free-living and particle-associated bacterial communities
Structural diversity of bacterial communities was investi-gated by DGGE analyses of partial 16S rRNA gene frag-ments. DGGE analyses were performed for free-living and
Cell-sp
ecific BPP free-living (fg C cell -1 h -1 )
0 1 2 3 4 5 6
M1 M2 M3 M4 M5 M6 M7 M8 M9
Time (d)
0 5 10 15 20 25
Cel
l-sp
e
cifi
c BPP att
a
ched
(fg C cell
-1 h -1 )
0 5 10 15 20 25 30 35 40
(a)
(b)
Fig. 3.Cell-specific BPP of(a)free-living (≤5.0µm≥0.2µm) and
(b)attached bacteria (≥5.0µm). M1–M3 mesocosms with 3×CO2,
M4–M6 mesocosms with 2×CO2, and M7–M9 mesocosms with
Table 3.CHOW test with univariate GLM to test for dependencies onpCO2. For abbreviations see legend Table 1.n=87.
Parameter BPP free BPP attached csBPP free csBPP
attached
C:N intercept
p=0.004
F=5.923
slope
p=0.004
F=5.819
dF=2
intercept
p=0.003
F=6.432
slope
p=0.003
F=6.407
dF=2
ns intercept
p=0.027
F=3.762
slope
p=0.034
F=3.526
dF=2
particle-associated bacteria separately to obtain higher phy-logenetic resolution and to receive closer information on po-tential responses of bacterial communities to differences in CO2 concentrations. Investigation of bacterial community structure was conducted for mesocoms M2 (3×CO2), M5 (2×CO2), and M8 (1×CO2), each representing one of the three differentpCO2treatments. Samples were taken in in-tervals of 4 to 6 days from the beginning (day zero, T0) to the end (day 24, T24) of the experiment. In all mesocosms both free-living and particle-associated bacteria showed a relatively high phylogenetic diversity in respect to absolute numbers of DGGE bands. Numbers of DGGE bands varied between 11 and 21 (mean 15±2.7) and between 12 and 25 (mean 17±3.3) for free-living and particle-associated bac-teria, respectively. Even though free-living and particle-associated bacteria showed similar numbers of DGGE bands, distinct differences occurred in their respective banding pat-terns (Fig. 4). However, as determined by ANOSIM of the DGGE banding patterns differences between free-living and particle-associated bacteria communities were signifi-cant only within mesocosm M5 (p≤0.001). Differences be-tween the two bacterial fractions in mesocosms M2 and M8 were not statistically significant (p≥0.05).
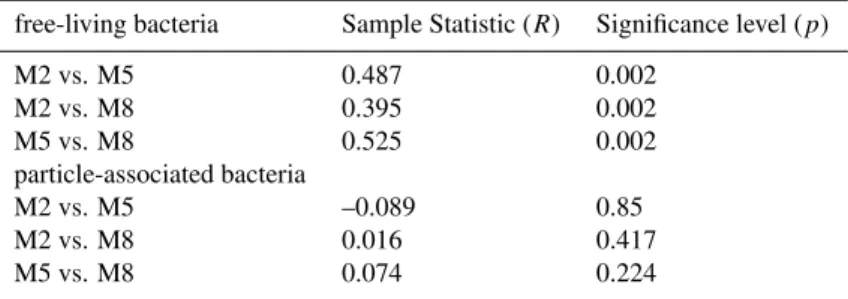
As indicated by cluster analyses of DGGE banding pat-terns and ANOSIM community composition of free-living bacteria significantly differed between mesocosms (Fig. 4, Table 4). In contrast, cluster analyses of particle-associated bacteria did not reveal any clustering between samples of the three mesocosms (Fig. 4) and no significant differences be-tween mesocosms were observed by ANOSIM (Table 4).
Cluster analyses of particle-associated bacteria, however, indicate temporal clusters which can be directly related to phytoplankton bloom development (Fig. 4). Three major clusters (Cluster 1 to 3) were identified, representing (a) initiation (T0) and end of the experiment (T24), (b) phy-toplankton bloom increase (T6) and decline (T18), and (c) maximum of the phytoplankton bloom (T10 and T14), re-spectively. DGGE banding patterns of both free-living and particle-associated bacteria from the fjord formed distinct clusters which were clearly separated from those in the meso-cosms (Fig. 4).
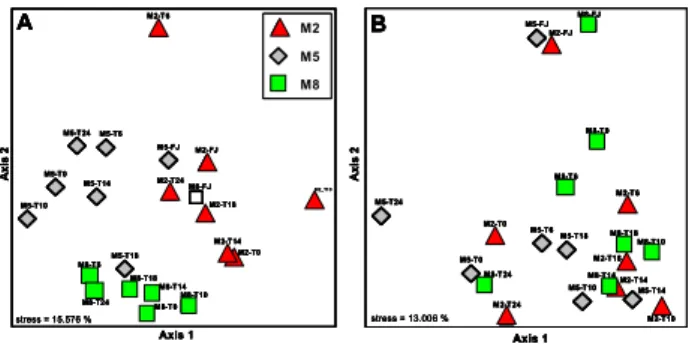
NMS analyses of DGGE banding patterns support the re-sults of our ANOSIM analyses and reveal rather distinct pop-ulations of free-living bacteria (Fig. 5A) but highly inter-mixed populations of particle-associated bacteria (Fig. 5B) at differentpCO2levels. In both bacterial fractions the samples from the fjord formed a narrow cluster which, especially for particle-associated bacteria, was different from those in the mesocosms. Samples M2-T6 and M5-T18 of the free-living bacteria were exceptional in their position in the NMS ordi-nation plot which may have been the result of their very weak banding pattern.
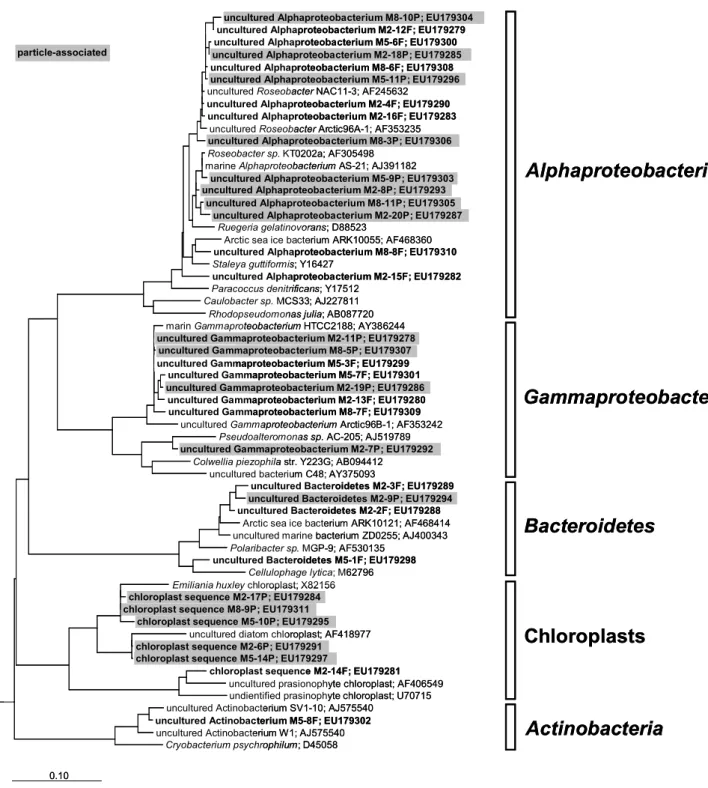
3.6 Phylogenetic analyses of sequenced DGGE bands Sequencing and phylogenetic characterization of selected DGGE bands indicated the occurrence ofα-proteobacteria, γ-proteobacteria, Bacteroidetes, and Actinobacteria in the three investigated mesocosms. We also detected several se-quences originating from chloroplasts of Emiliania huxley, uncultured diatoms, and members of the phylum Prasino-phyta(Fig. 6). Except for the single actinobacterial sequence belonging to freshwaterActinobacteria, all other sequences were phylogenetically affiliated to marine bacterial clusters. No distinct differences in bacterial community composition were observed on the phylogenetic level between the three mesocosms in respect to differentpCO2concentration and phytoplankton bloom development. We also did not observe any distinct phylogenetic differences between free-living and particle-associated bacteria. Sequences of free-living and particle-associated bacteria were distributed equally through-out the constructed phylogenetic tree withthrough-out indicating for-mation of fraction-specific clusters (Fig. 6).
4 Discussion
4.1 Dependency of microbial dynamics onpCO2
!"
# $
# $ %
!
# $
"
!" !"
# $
# $ %
!
# $
"
Fig. 4.Cluster analyses including the corresponding DGGE profiles of PCR-amplified 16S rRNA gene fragments of free-living and
particle-associated bacterial communities of the mesocosm M2 (3×CO2), M5 (2×CO2), and M8 (1×CO2). Sample identification numbers indicate
mesocosm and date of each sample. Samples designated with “Fjord” are water samples originating from the Fjord outside of the mesocosms which were used as external standard on each DGGE gel for comparison of the DGGE profiles across different gels.
Table 4.Comparison of DGGE banding patterns of free-living and particle-associated bacteria of mesocosms M2 (3×CO2), M5 (2×CO2),
and M8 (1×CO2)by using ANOSIM statistics.
free-living bacteria Sample Statistic (R) Significance level (p)
M2 vs. M5 0.487 0.002
M2 vs. M8 0.395 0.002
M5 vs. M8 0.525 0.002
particle-associated bacteria
M2 vs. M5 –0.089 0.85
M2 vs. M8 0.016 0.417
M5 vs. M8 0.074 0.224
The global tests revealed sample statistics of 0.468 for free-living bacteria and 0.452 for particle-associated bacteria with significance values ofp0.001 andp0.453, respectively.
veal significant differences of the parameters between differ-entpCO2levels. However, differently shaped relations be-tween bacterial production parameters and C:N at different pCO2levels may indicate different underlying mechanisms. For example, the C:N ratios of the suspended particulate or-ganic matter in the upper water layer may have been largely dominated by living algal biomass leading to a rather con-stant C:N ratio in all treatments. A higher loss of organic carbon from the upper layer of the stratified mesocosms at higherpCO2has been previously shown (Engel, 2002; Engel et al., 2004) and has been assigned to higher concentrations of TEP at higherpCO2. Higher abundances of TEP provide larger surfaces for bacterial attachment which may result in
higher bacterial activities (Grossart et al., 2007), and pro-mote aggregation and loss of C-rich particulate organic mat-ter (Passow, 2002). In our study, the stoichiometry of carbon to nitrogen drawdown (C:N) increased from a value of 6.0 under presentpCO2 to 8.1 at highpCO2 (Riebesell et al., 2007) which may indicatepCO2-dependent changes in car-bon and/or nitrogen consumption by heterotrophic bacteria, especially of attached bacteria.
Fig. 5. NMS ordination plots of DGGE banding patterns of (A)free-living (≤5.0≥0.2µm) and(B)particle-associated bacteria (≥5.0µm).
nitrogen and phosphorus content (Passow, 2002). In addi-tion, apCO2dependent algal carbon consumption may result in increased phytoplankton exudation (e.g. Obernosterer and Herndl, 1995; Biddanda and Benner, 1997) with high pro-portions of carbon rich DOM which is less accessible to mi-crobial degradation (Søndergaard et al., 2000; Thingstad et al., 1997). Since the drawdown of nutrients and phytoplank-ton community composition were similar in all mesocosms (Riebesell et al., 2007), we conclude that in addition to nutri-ent regime and phytoplankton community composition (Co-nan et al., 2007) carbon availability can greatly affect pro-duction and composition of new DOM. If so, an increasing pCO2 in the upper ocean must have profound implications for microbial utilization of the oceanic DOM pool. In our ex-periment, DOC and BPP as well as csBPP of both free-living and attached bacteria were negatively correlated which indi-cates that increasing concentrations of DOC throughout the bloom do not necessarily stimulate bacteria secondary pro-duction. As indicated by Tanaka et al. (2008) after the peak of the phytoplankton bloom the released labile DOC may have been rich in carbon such as glucose whereas P and N were depleted. This suggests that there is a slight but rather indirect effect of changes inpCO2on bacterial activities and community structure that is mainly related to phytoplankton carbon consumption, DOC exudation, as well as TEP for-mation and subsequent sedimentation (also see Tanaka et al., 2008).
We are aware of the fact that the sudden increase in pCO2levels does not reflect natural conditions where a more steady increase inpCO2 levels over longer time spans oc-curs. Hence, in the present study all organisms, especially at higher trophic levels, had rather little time to physiologically adapt to the new environmental conditions.
4.2 Coupling of heterotrophic bacteria to phytoplankton bloom development
Abundance and BPP of both free-living and attached bac-teria were tightly coupled to phytoplankton bloom develop-ment and did not show any significant differences between the treatments. The relatively high bacterial abundance at the beginning of the experiment, in particular of free-living bacteria, may have been caused by addition of freshwater to the upper water layers of each mesocosm, disruption of jelly fish during mesocosm filling, and bubbling. When ex-cluding the initial phase of the mesocosm experiment, abun-dance of free-living bacteria increased from day 6 on and peaked during the decline of the algal bloom whereas the second increase in numbers of free-living bacteria occurred in parallel to an increase in dinoflagellates and unicellular cyanobacteria towards the end of the experiment. In con-trast, the abundance of attached bacteria exhibited only one peak which occurred slightly earlier than the first peak of free-living bacteria and in parallel to phytoplankton devel-opment (Schulz et al., 2008). Numbers of attached bacte-ria were much lower than those of free-living bactebacte-ria. In a previous study (Grossart et al., 2006b) we also found that maxima in abundance of free-living bacteria surpassed that of attached bacteria by ca. 10-fold. Interestingly, numbers of free-living bacteria in the present study dramatically dropped several days before the phytoplankton bloom had reached its maximum. At the same time viral numbers and estimated production greatly increased (Larsen et al., 2008) suggest-ing viral lysis of free-livsuggest-ing bacteria. In contrast, attached bacteria continuously increased during the second half of the bloom and even during the declining phase. Since there were no pronounced differences in phytoplankton and bacte-rial dynamics between the different treatments of the present study, we conclude that coupling between phytoplankton and heterotrophic bacteria was similar for all mesocosms.
! " # !$
% # % # & ' #
( ) % #* "#
+ # #*#
, !
$ ! " - # . " # % ""
% "" + " !/
, 0 # !# 1 !$# . # ". ' # " # + # ! , !$ % ) # "## # $ 2 )#
# "
! # !$) . 3 # #*# ! # !$) # # ".
# # ". , ) # " ! ) $ !$# "
/
!""
# !"#
4', 5 . '6
$ "
#!
78 . '6
' # '5 . '6
" # '(5 . '9
.
' # # # " ' 7 . '6
# # ! "
. :
. : ,( . '9
. '
" # ;8,, . ':
#
!
!"
! #"
# !"
' # 5 . '6 ',5 . '9
/ : . ' # " , . ':
% & ! #
% & ##
' # # # " ' 7 . '6
" # # " < . '9 +5 . '6
% & #
.
$ ! . =
# " $ ! . '6
& & ' $ #
! # !$) $ ! . '6
# #*# ! # !$) $ ! . 3 ' # # " (> 5 . '9
# !"
' # # " ? . '9 .
/
# "( !"$
#( #
(
# !( !"
( !"!
#( !
# ( !" "( #
( #
# ( !"
( #
(
% & ( $
& & ' ( #$
& & ' # ( ! & & ' "(
& & ' ( & & ' $( &&
)
& &
! " # !$
% # % # & ' #
( ) % #* "#
+ # #*#
, !
$ ! " - # . " # % ""
% "" + " !/
, 0 # !# 1 !$# . # ". ' # " # + # ! , !$ % ) # "## # $ 2 )#
# "
! # !$) . 3 # #*# ! # !$) # # ".
# # ". , ) # " ! ) $ !$# "
/
!""
# !"#
4', 5 . '6
$ "
#!
78 . '6
' # '5 . '6
" # '(5 . '9
.
' # # # " ' 7 . '6
# # ! "
. :
. : ,( . '9
. '
" # ;8,, . ':
#
!
!"
! #"
# !"
' # 5 . '6 ',5 . '9
/ : . ' # " , . ':
% & ! #
% & ##
' # # # " ' 7 . '6
" # # " < . '9 +5 . '6
% & #
.
$ ! . =
# " $ ! . '6
& & ' $ #
! # !$) $ ! . '6
# #*# ! # !$) $ ! . 3 ' # # " (> 5 . '9
# !"
' # # " ? . '9 .
//
# "( !"$
#( #
(
# !( !"
( !"!
#( !
# ( !" "( #
( #
# ( !"
( #
(
% & ( $
& & ' ( #$
& & ' # ( ! & & ' "(
& & ' ( & & ' $( &&
&&
)
& &
Fig. 6. Maximum Likelihood tree of 16S rRNA gene sequences of free-living and particle-associated bacteria derived from DGGE bands
of the three mesocosms M2 (3×CO2), M5 (2×CO2), and M8 (1×CO2). Sequences of this study are shown in bold letters. Sequences
indicating a tight coupling between bacteria activity and phy-toplankton development, especially when P and N were de-pleted in the ambient water (Tanaka et al., 2008). The much higher csBPP of attached than of free-living bacteria may in-dicate a closer and more efficient coupling of phytoplankton-associated bacteria presumably due to a lower spatial dis-tance between algae and bacteria and a higher availability of nutrients. In addition, our statistics (Table 3a and b) shows that indeed both bacterial fractions were tightly coupled to algal parameters but in a different manner. Surprisingly, BPP of free-living bacteria was negatively correlated with diatoms, whereas csBPP of attached bacteria was negatively correlated with Cyano and TEP. In contrast, both csBPP of free-living and attached bacteria positively correlated with Ehux. Hence, the presence of different algal species leads to differences in the correlation between free-living and at-tached bacteria to phytoplankton bloom development. This notion points to differences in the functional role of free-living vs. attached bacteria for oceanic nutrient and energy cycling (Simon et al., 2002).
Another important point is that free-living and attached bacteria at certain times may have experienced great differ-ences in the availability of limiting nutrients, such as phopho-rus and nitrogen (Tanaka et al., 2008). It has been suggested by Thingstad et al. (2005) that specific bacteria, such as Vib-rio splendidus, obtain a competitive advantage for mineral nutrients by using a non-limiting carbon source to increase their size, without thereby increasing their cellular quota of the limiting element. According to these authors the ben-efit would be threefold: 1) increased affinity, 2) decreased predation pressure, and 3) storage of energy and carbon for potential later use under C-limited conditions. The specific environment required for such a beneficial strategy would be access to a pool of assimilable organic C in excess of that re-quired for growth. Similar conditions are given for bacteria clustering in the vicinity or being attached to phytoplank-ton cells and organic matter aggregates where a substantial release of C rich organic matter due to phytoplankton exu-dation or by bacterial ectoenzymatic activities has been ob-served (Kiørboe and Jackson 2001; Grossart et al., 2006a; Grossart et al., 2007). An increase in organic matter and nu-trient supply once a bacterium stays in the vicinity or has attached to a larger particle has been previously calculated by Kiørboe and Jackson (2001). In our study mainly mem-bers of theRoseobacterclade and ofγ-Proteobacteriaseem to follow the above mentioned strategy (see also bellow). 4.3 Cycling of DMSPd+pand DMS
Abundance and BPP of both free-living and attached bac-teria correlate well with the concentration of DMSPd and especially DMSPp (Tables 1, 2a and b). This also points to a tight coupling between bacteria and phytoplankton dy-namics. DMSPp is produced in some phytoplankton groups (Keller et al., 1989) as an osmolyte (e.g. Dickson and Kirst,
1986), cryoprotectant (Karsten et al., 1996), as an antioxi-dant (Sunda et al., 2002) or overflow mechanism (Stefels, 2000). Most DMSPp is transferred to the dissolved phase (DMSPd) upon demise of phytoplanktonic cells through grazing, autolysis, and viral lysis (Stefels et al., 2007). There, DMSPdis available for bacterial degradation and may serve as an important substrate and energy source for ma-rine bacteria (Kiene and Linn, 2000). Furthermore, ma-rine bacteria can satisfy almost all their sulphur demand through DMSP consumption (e.g. Kiene et al., 2000). By using a combination of microautoradiography and CARD-FISH Vila-Costa and coworkers (2007b) showed that mem-bers of α-proteobacteria(Roseobacter and SAR11) andγ -proteobacteria accounted for most of the bacterial DMSP-S assimilating cells during a seasonal cycle in the Mediter-ranean. These two groups are the major bacterial groups found in the present study (see below). The most common pathway of DMSP consumption, however, is the demethyla-tion/demethiolation pathway, which drives DMSP away from DMS production.
A Lagrangian study of a coccolithophore bloom in the North Sea revealed that microzooplankton grazing can ac-count for the majority of DMSPpdegradation (Archer et al., 2003). In addition, viruses have been implicated in the col-lapse of blooms ofE. huxleyi(Wilson et al., 2002), which was also the case in our study (Larsen et al., 2008). In a more recent study, however, Evans et al. (2007) found that forE. huxleyimicrozooplankton grazing is more important for DMS production than viral lysis – most likely because virally infected cells have lower lyases activities. Unfortu-nately, we do not have enough data on microzooplankton grazing to study its relevance for DMS production.
In the North Sea, Zubkov et al. (2001) found that free-living bacteria of the genusRoseobacterare actively involved into the pelagic sulphur cycling via degradation of DMSPd. In our study, this genus comprised a major fraction of α -proteobacteria, both free-living and attached and BPP and abundance of both bacterial fractions correlated well with DMSPd and even better with DMSPp. This suggests that these bacteria, either free-living or attached, are involved in DMSP cycling.
2002; Stefels et al., 1995) and by some bacteria (Ledyard and Dacey, 1994; Todd et al., 2007). Kiene et al. (2000) suggests that the bacterial yield of DMS from DMSP consumption depends upon bacterial sulphur demand and DMSP concen-tration. Besides photolysis bacterial degradation is the domi-nant loss process for DMS in the ocean (e.g. Kiene and Bates, 1990). Whereas most marine bacteria can assimilate DMSP (generalists), it has been suggested that DMS degraders are specialists, comprising approximately 33% of the bacterial community (Vila-Costa et al., 2007a).
The correlation of csBPP of free-living bacteria to DMS concentration in our study (Table 2b) implies that free-living bacteria participated in DMS consumption. Vila-Costa et al. (2007a) found that not only bacteria of theMethylophaga
group are prolific DMS consumers, but also that members of theRoseobactergroup are able to assimilate DMS to a cer-tain extent. In our study, members of theRoseobactergroup formed several dominant DGGE bands whereas members of theMethylophagagroup were not found (see below). 4.4 Community composition and phylogeny
Although differences in DGGE banding patterns of free-living and attached bacteria were minor, temporal succes-sion of both bacterial fractions was different. Whereas free-living bacteria formed distinct clusters among the different treatments throughout the whole study period, temporal dy-namics of attached bacteria closely followed that of phyto-plankton development. This was not reflected by our 16S rRNA gene based phylogeny of the excised DGGE bands which revealed that the majority of free-living as well as at-tached bacteria belonged to similar groups of theα- and γ -proteobacteria,and Bacteroidetes.α-proteobacteria, mainly of the Roseobacter group, γ-proteobacteria, in particular of thePseudoaltermonas group, and specificBacteroidetes
have been frequently found to be associated to various phy-toplankton species of different phylogenetic groups in labo-ratory cultures and in the sea (Grossart et al., 2005; Garces et al., 2007 and references therein). Whereas Grossart et al. (2005) found significant differences between free-living and attached bacterial communities in laboratory diatom cul-tures, differences between the two bacterial fractions in the present study were less obvious. Both Roseobacter and
Pseudoaltermonadsare highly motile and it has been shown that some Roseobacterspecies express high chemotaxis in the presence of organic matter such as marine broth and DMSP (Kiørboe et al., 2002). Furthermore, quorum sens-ing via acylated homoserine lactones (AHLs) seems to be a common feature ofRoseobacterspecies (Gram et al., 2002; Martens et al., 2007). In addition to their blooming during phytoplankton blooms, Roseobacterand presumably Pseu-doalteromonasandBacteroidetesseem to be well adapted to rapidly respond to phytoplankton development. It may be difficult to distinguish between free-living and attached bac-terial communities since many chemotactic species show
fre-quent attachment and subsefre-quent detachment (Kiørboe et al., 2002). Our results suggest that bacterial community analy-sis, solely based on the 16S rRNA gene, can provide valuable results on the interaction between heterotrophic bacteria and phytoplankton development and, hence, the functioning of the microbial food web.
5 Summary
Microbial dynamics in our mesocosm plankton communities was correlated with phytoplankton development. Changes in pCO2 led to significant changes in community struc-ture of free-living but not of attached bacteria which were more tightly correlated to phytoplankton dynamics. Statis-tical analysis solely revealed apCO2dependency for linear regressions between C:N ratio of suspended matter and BPP of free-living and attached bacteria as well as csBPP of at-tached bacteria. The differently shaped relations between bacterial production parameters and C:N at differentpCO2 levels may indicate different underlying mechanisms. Our results provide some indication thatpCO2induced changes in phytoplankton carbon fixation and community succession will have an impact on microbial energy consumption and carbon as well as sulphur cycling due to the rather tight cou-pling between phytoplankton and microbial dynamics in the pelagic ocean. In particular, chemotactic and attached bacte-ria may greatly benefit from a tight coupling to phytoplank-ton cells and organic aggregates since by doing so they may have a competitive advantage not only for organic carbon but also for mineral nutrients. Slight changes in organic matter cycling due to differences inpCO2may be hard to detect in short-term mesocosm experiments but may accumulate in the long-term. Hence, we suggest that further studies onpCO2 induced changes on microbial activities should take a longer time scale into account.
Acknowledgements. We would like to thank all participants of the PeECE III mesocosm experiment (http://peece.ifm-geomar.de) for their valuable technical assistance, data acquisition, and many fruitful discussions. The staff at the Marine Biological Station, University of Bergen, in particular Tomas Sørlie and Agnes Aadnesen, and the Bergen Marine Research infrastructure (RI) are gratefully ackowledged for support in mesocosm logistics. M. Steinke and S. Turner are thanked for assistance in DMS/DMSP measurements and numerous discussions. Kirsten Pohlmann is warmly acknowledged for help in statistical analyses and her com-ments on this manuscript. This work was supported by a grant of the German Science Foundation given to H.P.G. (GR 1540/8-2) and a grant of the German National Academic Foundation given to M.A.
References
Allgaier, M. and Grossart, H.-P.: Diversity and seasonal dynamics of Actinobacteria in four lakes in Northeastern Germany, Appl. Environ. Microbiol., 72, 3489–3497, 2006a.
Allgaier, M. and Grossart, H.-P.: Seasonal dynamics and phylo-genetic diversity of free-living and particle-associated bacterial communities in four lakes in northeastern Germany, Aquat. Mi-crob. Ecol., 45, 115–128, 2006b.
Archer, S. D., Stelfox-Widdicombe, C. E., Malin, G., and Burkill, P. H.: Is dimethyl sulphide production related to microzooplankton herbivory in the southern North Sea?, J. Plankton Res., 25, 235– 242, 2003.
Armstrong, R. A., Lee, C., Hedges, J. I., Honjo, S., and Wakeham, S. G.: A new, mechanistic model for organic carbon fluxes in the ocean based on the quantitative association of POC with ballast minerals, Deep-Sea Res. II, 49, 219–236, 2002.
Biddanda B. and Benner, R.: Carbon, nitrogen, and carbohydrate fluxes during the production of particulate and dissolved organic matter by marine phytoplankton, Limnol. Oceanogr., 42, 506– 518, 1997.
Burkhardt, S., Amoroso, G., Riebesell, U., and Sultemeyer, D.: CO2and HCO−3 uptake in marine diatoms acclimated to different
CO2concentrations, Limnol. Oceanogr., 46, 1378–1391, 2001.
Caldeira, K. and Wickett, M. E.: Anthropogenic carbon and ocean pH, Nature, 425, 365, 2003.
Charlson, R. J., Lovelock, J. E., Andreae, M. O., and Warren, S. G.: Oceanic phytoplankton, atmospheric sulphur, cloud albedo and climate, Nature, 326, 655–661, 1987.
Clarke, K. R. and Green, R. H.: Statistical design and analysis for a “biological effects” study, Mar. Ecol. Progr. Ser., 46, 213–226, 1988.
Clarke, K. R. and Gorley, R. N.: PRIMER v5: User manual/tutorial, PRIMER-E, Plymouth UK, 91 pp., 2001.
Conan, P., Søndergaard, M., Kragh, T., Thingstad, F., Pujo-Pay, M., Williams, P. J. le B., Markager, S., Cauwet, G., Borch, N. H., Evan, D., and Riemann, B.: Partitioning of organic production in marine plankton communities: The effects of inorganic nutri-ent ratios and community composition on new dissolved organic matter, Limnol. Oceanogr., 52, 753–765, 2007.
Dickson, D. M .J. and Kirst, G. O.: The role of b-dimethylsulfoniopropionate, glycine betaine and homarine in the osmoacclimation ofPlatymonas subcordiformis, Planta 167, 536–543, 1986.
Egge, J. K., Thingstad, T. F., Engel, A., Bellerby, R. G. J., and Riebesell, U.: Primary production during nutrient-induced blooms at elevated CO2 concentrations, Biogeosciences
Dis-cuss., 4, 4385–4410, 2007,
http://www.biogeosciences-discuss.net/4/4385/2007/.
Engel, A.: Direct relationship between CO2uptake and transpar-ent exopolymer particle production in natural phytoplankton, J. Plankton Res., 24, 49–53, 2002.
Engel, A., Thoms, S., Riebesell, U., Rochelle-Newall, E., and Zon-dervan, I.: Polysaccharide aggregation as a potential sink of marine dissolved organic carbon, Nature, 428(6986), 929–932, 2004.
Engel, A., Zondervan, I., Aerts, K., Beaufort, L., Benthien, A., Chou, L., Delille, B., Gattuso, J. P., Harlay, J., Heemann, C., Hoffman, L., Jacquet, S., Nejstgaard, J., Pizay, M.-D., Rochelle-Newall, E., Schneider, U., Terbrueggen, A., and Riebesell, U.:
Testing the direct effect of CO2concentration on a bloom of the coccolithophorid Emiliania huxleyiin mesocosm experiments, Limnol. Oceanogr., 50, 493–507, 2005.
Evans, C., Kadner, S. V., Darroch, L. J., Wilson, W. H., Liss, P. S., and Malin, G.: The relative significance of viral lysis and micro-zooplankton grazing as pathways of dimethylsulfoniopropionate (DMSP) cleavage: AnEmiliania huxleyiculture study, Limnol. Oceanogr., 53, 1036–1045, 2007.
Fry, B., Hopkinson, C. S., Nolin, A., and Zweifel, U. L.: Long-term decomposition of DOC from experimental diatom blooms, Limnol. Oceanogr., 41, 1344–1347, 1996.
Garces, E., Vila, M., Rene, A., Alonso-Saez, A. S., Luglie, A., Maso, M., and Gasol, J. M.: Natural bacterioplankton assem-blages composition during blooms of Alexandrium spp. (Dino-phyceae) in NW Mediterranean coastal waters, Aquat. Microb. Ecol., 46, 55–70, 2007.
Gram, L., Grossart, H.-P., Schlingloff, A., and Kiørboe, T.: Pro-duction of acylated homoserine lactones byRoseobacterstrains isolated from marine snow, Appl. Eviron. Microbiol., 68, 4111– 4116, 2002.
Grossart, H.-P. and Ploug, H.: Microbial Degradation of Organic Carbon and Nitrogen on Diatom Aggregates, Limnol. Oceanogr., 46, 267–277, 2001.
Grossart, H.-P., Levold, F., Allgaier, M., Simon, M., and Brinkhoff, T.: Marine diatom species harbour distinct bacterial communi-ties, Environ. Microbiol., 7, 860–873, 2005.
Grossart, H.-P., Czub, G., and Simon, M.: Specific interactions of planktonic algae and bacteria: Implications for aggregation and organic matter cycling in the sea, Environ. Microbiol., 8, 1074– 1084, 2006a.
Grossart, H.-P., Allgaier, M., Passow, U., and Riebesell, U.: Test-ing the effect of CO2 concentration on dynamics of marine
heterotrophic bacteriaoplankton, Limnol. Oceanogr., 51, 1–11, 2006b.
Grossart, H.-P., Tang, K. W., Kiørboe, T., and Ploug, H.: Com-parison of cell-specific activity between free-living and attached bacteria using isolates and natural assemblages, FEMS Micro-biol. Lett., 266, 194–200, 2007.
Hoppe, H. G., Ducklow, H., and Karrasch, B.: Evidence for depen-dency of bacterial-growth on enzymatic hydrolysis of particulate organic matter in the mesopelagic ocean, Mar. Ecol. Prog. Ser., 93(3), 277–283, 1993.
Howard, E. C., Henriksen, J. R., Buchan, A., Reisch, C. R., Buergmann, H., Welsh, R., Ye, W. Y., Gonzalez, J. M., Mace, K., Joye, S. B., Kiene, R. P., Whitman, W. B., Moran, M. A.: Bacterial taxa that limit sulfur flux from the ocean, Science, 314, 649–652, 2006.
Karsten, U., K¨uck, K., Vogt, C., Kirst, G. O.: Dimethylsulfonio-propionate production in phototrophic organisms and its physi-ological function as a cryoprotectant. In: Kiene, R.P., Visscher, P.T., Keller, M.D., Kirst, G.O. (Eds.). Biological and Environ-mental Chemistry of DMSP and Related Sulfonium Compounds, Plenum Press, New York, 143–153, 1996.
Keller, M. D., Bellows, W. K. And Guillard, R. R. L.: Dimethyl sulphide production in marine phytoplankton. ACS Symposium Series, 393, 167–182, 1989.
Kiene, R. P. and Bates, T. S.: Biological removal of dimethylsulfide from sea water. Nature, 345, 702–705, 1990.
roles for DMSP in marine microbial communities. J. Sea Res., 43, 209–224, 2000.
Kiene, R. P. and Linn, L. J.: Distribution and turnover of dis-solved DMSP and its relationship with bacterial production and dimethylsulfide in the Gulf of Mexico, Limnol. Oceanogr., 45, 849–861, 2000.
Kiørboe, T. and Jackson G. A. Marine snow, organic solute plumes, and optimal chemosensory behavior of bacteria, Lim-nol. Oceanogr. 46, 1309–1318, 2001.
Kiørboe, T., Grossart, H.-P., Ploug, H., and Kam T.: Bacterial col-onization of sinking aggregates: mechanisms and rates, Appl. Environ. Microbiol., 68, 3996–4006, 2002.
Klaas, C. and Archer, D.: Association of sinking organic matter with various types of mineral ballast in the deep sea: Implications for the rain ratio. Global Biochem. Cycles, 16, 1–14, 2002. Larsen, J. B., Larsen, A., Thyrhaug, R., Bratbak, G., and Sandaa,
R.-A.: Response of marine viral populations to a nutrient induced phytoplankton bloom at differentpCO2levels, Biogeosciences,
5, 523–533, 2008,
http://www.biogeosciences.net/5/523/2008/.
Ledyard, K. M. and Dacey, J. W. H.: Dimethylsulfide production from dimethylsulfonioprpionate by a marine bacterium, Mar. Ecol. Prog. Ser., 110, 95–103, 1994.
Martens, T., Kessler, D., Gram, L., Grossart, H.-P., Simon, M., and Brinkhoff, T.: Bacteria of the Roseobacter clade show high po-tential for secondary metabolite production, Microb. Ecol., 54, 31–42, 2007.
Martinez, J., Smith, D. C., Steward, G. F., and Azam, F.: Variabil-ity in ectohydrolytic enzyme activities of pelagic marine bacteria and its significance for substrate processing in the sea, Aquat. Microb. Ecol., 10, 223–230, 1996.
McCune, B. and Grace, J.B.: Analysis of Ecological Communities, MjM Software Design, Glenden Beach, OR, 2002.
Muyzer, G., Dewaal, E. C., and Uitterlinden, A. G.: Profiling of complex microbial populations by denaturing gradient gel electrophoresis analysis of polymerase chain reaction-amplifies genes coding for 16S ribosomal-RNA, Appl. Environ. Micro-biol., 59, 695–700, 1993.
Muyzer, G., Brinkhoff, T., N¨ubel, U., Santegoeds, C., Sch¨afer, H., and Wawer, C.: Denaturing gradient gel electrophoresis (DGGE) in microbial ecology, in: Molecular microbial ecology manual, edited by: Akkerman, A.D.L., van Elsas, J.D., and Bruijn, F.J., Kluwer Academic Publishers, Dordrecht, 1998.
Obernosterer, I. and Herndl, G. J.: Phytoplankton extracellular re-lease and bacterial growth: Dependence on the inorganic N:P ratio, Mar. Ecol. Progr. Ser., 116, 247–257, 1995.
Passow, U.: Production of transparent exopolymer particles (TEP) by phyto- and bacterioplankton, Mar. Ecol.-Prog. Ser., 236, 1– 12, 2002.
Paulino, A. I., Egge, J. K., and Larsen, A.: Effects of increased atmospheric CO2 on small and intermediate sized osmotrophs during a nutrient induced phytoplankton bloom, Biogeosciences, 5, 739–748, 2008,
http://www.biogeosciences.net/5/739/2008/.
Riebesell, U., Zondervan, I., Rost, B., Tortell, P. D., Zeebe, R. E., and Morel, F. M. M.: Reduced calcification in marine plankton in response to increased atmospheric CO2, Nature, 407, 634–637,
2000.
Riebesell, U., Schulz, K. G. , Bellerby, R. G. J., Fritsche, P.,
Mey-erh¨ofer, M., Neill, C., Nondal, G., Oschlies, A., Wohlers, J., and Z¨ollner, E.: Enhanced biological carbon consumption in a high CO2 ocean, Nature, 450, 545–458, doi:10.1038/nature06267, 2007.
Riebesell, U., Bellerby, R. G. J., Grossart, H.-P., and Thinstad, F.: Mesocosm CO2perturbation studies: from organism to
commu-nity level. Biogeosciences Discuss., 5, 641–659, 2008, http://www.biogeosciences-discuss.net/5/641/2008/.
Schulz, K. G., Riebesell, U., Bellerby, R. G. J., Biswas, H., Mey-erhfer, M., M¨uller, M. N., Egge, J. K., Nejstgaard, J. C., Neill, C., Wohlers, J., and Z¨ollner, E.: Build-up and decline of organic matter during PeECE III, Biogeosciences, 5, 707–718, 2008, http://www.biogeosciences.net/5/707/2008/.
Sim´o, R., Archer, S. D., Pedros-Alio, C., Gilpin, L., and Stelfox-Widdicombe, C. E.: Coupled dynamics of dimethylsulfoniopro-pionate and dimethylsulfide cycling and the microbial food web in surface waters of the North Atlantic, Limnol. Oceanogr., 47, 53–61, 2002.
Simon, M., Grossart, H.-P., Schweitzer, B., and Ploug, H.: Mi-crobial Ecology of Organic Aggregates in Aquatic Ecosystems, Aquat. Microb. Ecol, 28, 175–211, 2002.
Smith, D. C., Simon, M., Alldredge, A. L., and Azam, F.: Intense hydrolytic enzyme-activity on marine aggregates and implica-tions for rapid particle dissolution, Nature, 359, 139–142, 1992. Smith, D. C., Steward, G. F., Long, R. A., and Azam, F.: Bacterial
mediation of carbon fluxes during a diatom bloom in a meso-cosm, Deep-Sea Res., 42, 75–97, 1995.
Søndergaard, M., Williams P. J. le B., Cauwet, G., Riemann, B., Robinson, C., Terzic, S., Woodward E. M. S., and Worm, J.: Net accumulation and flux of dissolved organic carbon and dis-solved organic nitrogen in marine plankton communities, Lim-nol. Oceanogr., 45, 1097–1111, 2000.
Stefels, J., Dijkhuizen, L., and Gieskes, W. W. C.: DMSP-lyase activity in a spring phytoplankton bloom off the Dutch coast, re-lated toPhaeocystis sp.abundance, Mar. Ecol. Prog. Ser., 123, 235–243, 1995.
Stefels, J.: Physiological aspects of the production and conversion of DMSP in marine algae and higher plants, J. Sea Res., 43, 183– 197, 2000.
Stefels, J., Steinke, M., Turner, S., Malin, G., Belviso, S.: Envi-ronmental constraints on the production and removal of the cli-matically active gas dimethylsulfide (DMS) and implications for ecosystem modelling, Biogeochemistry, 83, 245–275, 2007. Steinke, M., Wolfe, G. V., and Kirst, G. O.: Partial
characterisa-tion of dimethylsulfoniopropionate (DMSP) lyase isozymes in 6 strains ofEmiliania huxleyi, Mar. Ecol. Prog. Ser., 175, 215–225, 1998.
Steinke, M., Malin, G., Archer, S. D., Burkill, P. H., and Liss, P. S.: DMS production in a coccolithophorid bloom: evidence for the importance of dinoflagellate DMSP lyases, Aquat. Microb. Ecol., 26, 259–270, 2002.
Sunda, W., Kieber, D. J., Kiene, R. P., and Huntsman, S.: An an-tioxidant function for DMSP and DMS in marine algae. Nature, 418, 317–320, 2002.
http://www.biogeosciences.net/5/669/2008/.
Thingstad, F. T., Hagstr¨om, A., and Rassoulzadegan, F.: Accumula-tion of degradable DOC in surface waters: Is it caused by a mal-functioning microbial loop?, Limnol. Oceanogr., 42, 398–404, 1997.
Thinstad, T. F.: Elements of a theory for the mechanisms controlling abundance, diversity, and biogeochemical role of lytic bacterial viruses in aquatic systems, Limnol. Oceanogr., 45, 1320–1328, 2000.
Todd, J. D., Rogers, R., Li, Y. G., Wexler, M., Bond, P. L., Sun, L., Curson, A. R. J., Malin, G., Steinke, M., and Johnston, A. W. B.: Structural and regulatory genes required to make the gas dimethyl sulfide in bacteria. Science, 315, 666–669, 2007. Tortell, P. D., Ditullio, G. R., Sigmann, D. M., and Morel, F. M. M.:
CO2 effects on taxonomic composition and nutrient utilization
in an Equatorial Pacific phytoplankton assemblage, Mar. Ecol. Prog. Ser., 236, 37-43, 2002.
Vila-Costa, M., del Valle, D., Gonz´alez, J. M., Slezak, D., Kiene, R. P., S´anchez, O., Sim´o, R.: Phylogenetic identification and metabolism of marine dimethylsulfide-consuming bacteria, En-viron. Microbiol., 8, 2189–2200, 2007a.
Vila-Costa, M., del Pinhassi, J., Alonso, C., Pernthaler, J., Sim´o, R.: An annual cycle of dimethylsulfoniopropionate-sulfur and leucine assimilating bacterioplankton in the coastal NW Mediter-ranean, Environ. Microbiol., 9, 2451–2463, 2007b.
Vogt, M., Steinke, M., Turner, S., Paulino, A., Meyerh¨ofer, M., Riebesell, U., LeQu¨er¨e, C., and Liss, P.: Dynamics of dimethyl-sulphoniopropionate and dimethylsulphide under different CO2 concentrations during a mesocosm experiment, Biogeosciences, 5, 407–419, 2008,
http://www.biogeosciences.net/5/407/2008/.
Williams, P. J. le B.: Evidence for the seasonal accumulation of carbon-rich dissolved organic material, its scale in comparison with changes in particulate material and the consequential effect on net C/N assimilation ratios, Mar. Chem., 51, 17–29, 1995. Wilson, W. H., Tarran, G. A., Schroeder, D., Cox, M., Oke, J., and
Malin, G.: Isolation of a virus responsible for the demise of an Emiliania huxleyibloom in the English Channel, J. Mar. Biol. Assoc. UK, 82, 369–377, 2002.
Wolf-Gladrow, D., Riebesell, U., Burkhardt, S., and Bijma, J.: Di-rect effect of CO2concentration on growth and isotopic
compo-sition of marine plankton, Tellus, 51B, 461–476, 1999.
Zak, D. R., Pregitzer, K. S., Curtis, P. S., and Holmes, W. E.: Atmo-spheric CO2and the composition of soil microbial communities, Ecol. Appl., 10: 47–59.
Zhou, J., Mopper, K., and Passow, U.: The role of surface-active carbohydrates in the formation of transparent exopolymer parti-cles by bubble adsorption of seawater, Limnol. Oceanogr., 43, 1860–1871, 1998.