Influence of river discharge on phytoplankton structure and nutrient
concentrations in four tropical semiarid estuaries
This study evaluated changes in phytoplankton
and nutrients after an increase in river discharge in
four estuaries of northeastern Brazil. Samples were
taken during a markedly freshwater-deprived period
(Nov/2010, dry season), and during a rainy season
(May/2011). While two estuaries are located in
urban areas (Ceará - CE and Cocó - CO), the others
are markedly freshwater-deprived (Pacoti - PAC and
Pirangi - PIR). Our indings indicate that increased
freshwater had opposing effects on estuaries impacted
by anthropogenic discharges (CO, CE and PIR)
compared with the other, less impacted (PAC). In
CO and CE, the freshwater low during the rainy
period had a nutrient diluting effect and controlled
phytoplankton blooms. In PIR, only phosphorus and
inorganic nitrogen decreased in the rainy season. In
contrast, an increase of all nutrients was observed in
PAC, and of TN in PIR, followed by an increase in
phytoplankton biomass. In the rainy season, eutrophic
freshwater species dominated in all the estuaries. In the
dry season, blooms of
Cryptomonas
/
Rhodomonas
and
Synechocystis aquatilis
were, respectively, observed in
CE and CO. Also in the dry season, PAC and PIR had
a predominance of marine species under a condition
of hypersalinity. Canonical correspondence analysis
suggested the variation observed for salinity, silica, and
TN are the main driver of phytoplankton structure.
A
bstrAct
Hortência de Sousa Barroso
1,2, Helena Becker
3, Vânia Maria Maciel Melo
1,2*
1 Laboratório de Ecologia Microbiana e Biotecnologia, Departamento de Biologia, Universidade Federal do Ceará, Av. Humberto Monte 2977, Pici, 60455-000 Fortaleza, Ceará, Brazil
2 Instituto de Ciências do Mar, Universidade Federal do Ceará, Av. da Abolição, 3207, Meireles, 60165-081, Fortaleza, Ceará, Brazil 3 Departamento de Química Analítica e Físico-química, Universidade Federal do Ceará, Av. Humberto Monte 2977, Pici, 60455-000 Fortaleza, Ceará, Brazil
*Corresponding author: vmmmelo@ufc.br
Descriptors:
Nitrogen, Phosphorous, Freshwater
low, Eutrophication, Hypersalinity.
Neste estudo foram avaliados os efeitos do aumento
da vazão luvial sobre o itoplâncton e os nutrientes
em quatro estuários do Nordeste do Brasil. Para isso,
foram coletadas amostras durante um período de
forte déicit hidrológico (Nov/2010, período seco),
e durante um período chuvoso (maio/2011). Dois
estuários estão localizados em áreas urbanas (Ceará
- CE e Cocó - CO) e dois têm forte déicit de água
doce (Pacoti - PAC e Priangi - PIR). Os efeitos do
aumento da descarga luvial foram diferentes entre
os que recebem descargas antrópicas (CO, CE e
PIR) e aquele menos impactado (PAC). No CO e
CE, o luxo luvial no período chuvoso diluiu os
nutrientes e controlou as lorações itoplanctônicas.
No PIR, o fósforo e o nitrogênio inorgânico
decresceram neste período. Foi observado um
aumento de todos os nutrientes no PAC, e de NT no
PIR, seguidos de um aumento do itoplâncton. No
período chuvoso, espécies dulcícolas de ambientes
eutróicos dominaram nos estuários. No período
seco, observaram-se lorações de
Cryptomonas
/
Rhodomonas
(CE) e
Synechocystis aquatilis
(CO).
No período seco, sob a condição de hipersalinidade,
predominaram espécies marinhas no PAC e PIR.
A Análise de Correspondência Canônica sugeriu
a salinidade, a sílica e o NT como os principais
responsáveis pela variação do itoplâncton.
r
esumo
Descritores:
Nitrogênio, Fósforo, Fluxo fluvial,
Eu-trofização, Hipersalinidade.
INTRODUCTION
Estuaries are transitional water bodies, characterized by pronounced gradients of physical, chemical and biological components, due to the mixing of fresh and marine waters (McLUSKY, 1993). They are among the most productive environments on the planet, and are extremely important for the maintenance of aquatic diversity. The phytoplankton assemblage is the main group of primary producers in most estuaries and includes several photosynthetic microorganisms (e.g., cyanobacteria, diatoms, green algae, cryptomonads and dinolagellates) (REYNOLDS, 2006), strongly inluenced by longitudinal and temporal changes of the estuarine abiotic environment (PAERL; JUSTIC, 2011).
In tropical and subtropical areas, high luvial discharge resulting from increased precipitation rates during rainy periods may be one of the major, if not the most important factor for controlling the structure and seasonal dynamics of estuarine phytoplankton assemblages (SASSI, 1991; EYRE, 2000; SAECK et al., 2013) due to its effect on turbidity, salinity, nutrient concentrations and water residence time (BASTOS et al., 2005; NORIEGA et al., 2013; SAECK et al., 2013). Generally, freshwater low carries nutrients into estuaries and consequently increases their concentrations (EYRE, 2000; EYRE; FERGUSON, 2005). However, low events also change water residence time and turbidity, which can have negative effects on phytoplankton productivity (BURFORD et al., 2012; PAERL; JUSTIC, 2011).
Similar to other estuaries worldwide (PAERL et al., 2006), many tropical semiarid estuaries are impacted by anthropogenic disturbance such as high nitrogen and phosphorus input from agriculture, aquaculture and domestic and industrial efluents (LACERDA et al., 2008; GUENTHER et al., 2015), and are especially modiied by dams that alter freshwater river discharge (MOLISANI et al., 2006). Due to natural water scarcity, the consequences of anthropogenic impacts on semiarid estuaries may be even more severe than on estuaries with high-luvial discharge in temperate zones.
Additionally, some areas with a predominantly semiarid climate, such as the state of Ceará (Northeastern Brazil), seem already to be affected by climate changes, with declining annual rainfall rates (MONCUNILL, 2006) likely acting synergistically with other anthropogenic changes in estuaries. However, little is known about the phytoplankton dynamics and nutrients in those estuaries.
A study in the Jaguaribe estuary (Ceará, Brazil) showed higher chlorophyll a concentration in the rainy season than in the dry season, and an inverse correlation between the chlorophyll a and phosphate concentration, indicating the rapid consumption of this nutrient (ESCHRIQUE et al., 2008).
In this scenario, the present study focused on changes in phytoplankton structure and nutrient concentrations caused by an increase in river discharge (rainy season), preceded by a strongly freshwater-deprived period (dry season). The objective was to compare two urban estuaries affected by chronic anthropogenic point source discharge and two strongly freshwater-deprived estuaries, seeking for a better understanding of the effects of freshwater discharge in watersheds of tropical/semiarid estuaries. Furthermore, freshwater-deprived estuaries are strategic environments for understanding the consequences of sea-level changes for primary productivity and functionality of estuarine ecosystems worldwide, considering that a decrease in freshwater discharge into estuaries is associated with an increased intrusion of marine waters.
MATERIAL AND METHODS
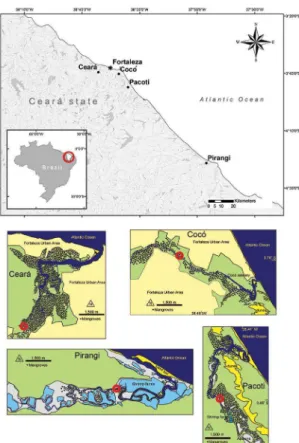
The estuaries of the rivers Cocó (CO), Ceará (CE), Pacoti (PAC) and Pirangi (PIR) are located in the state of Ceará in northeastern Brazil (Figure 1). A semi-arid climate prevails in most of the state, characterized by a short and irregular rainy season and a prolonged dry season. Annual precipitation rates are above 1500 mm in coastal areas with the highest concentration during the rainy season from February to April and the lowest concentration (nearly zero) during the dry season from August to November. The regional precipitation rate is controlled by the Intertropical Convergence Zone (ITCZ). The extent of the ITCZ displacement is affected by global phenomena, particularly the El Niño-Southern Oscillation (ENSO). In strong positive ENSO years, the annual precipitation in the region is even less (ZANELLA, 2007). In 2010, a year of moderate impact of El Niño (NOAA, 2015), the annual precipitation was only of 1014.2 mm year-1; and in 2011, a year of strong La Niña impact (NOAA, 2015) was 2273.9 mm year-1.
Figure 1. Location of the four studied estuaries (•) along the coast of Ceará State (NE Brazil), with Fortaleza, the capital of Ceará, indicated(*).
into estuaries is substantially reduced (MOLISANI et al., 2006). Precipitation, evaporation and temperature data were obtained from the Meteorological Station, Department of Agricultural Economics, Federal University of Ceará (Brazil).
CE, CO, PAC and PIR differ in hydrological regimes and impacts. CE, CO and PAC are located in the Fortaleza metropolitan region, while PIR is found nearly 100 km to the east (Figure 1). During the dry season, natural river input is low in all four estuaries which are regulated by dam constructions, similar to most rivers in Ceará (MOLISANI et al., 2006). Although the lower basins of the Cocó and the Ceará are the most highly urbanized and industrialized, the anthropogenic discharges of nitrogen and phosphorus exceeds that from natural sources in all the estuaries studied (LACERDA et al., 2008). Mangrove forests are still abundant in CE and PAC, but scarce in CO. They are almost completely absent in PIR, where the banks are occupied by shrimp farms (Figure 1).
Samples were taken during the dry (Nov/2010) and the rainy season (May/2011), comprising a total of eight
samples (n = 8). Considering the well-deined seasonality of the region (ESCHRIQUE et al., 2008), the number of samples was enough to reliably describe the changes in the phytoplankton structure and nutrient concentrations. All the samplings were taken at the peak of spring tide (high tide) on the upper stretch of the tidal excursion (indicated by the red circles in Figure 1) to avoid the interference of the tidal range with biogeochemical properties when comparing estuaries. The distances from sampling locations to the estuarine mouth were 10 km (03°44’28.3”, 038°37’51.9”) for CE, 7.2 km (03°45’15”S, 038°28’58.4”W) for CO, 6.6 km (03°51’02.8”S, 038°24’58.5”W) for PAC, and 9.9 km (4°24’5.82”S, 37°50’59.84”W) for PIR. These distances correspond to the tidal excursion of each estuary, which is the horizontal scale of the displacement of a water volume during the lood or ebb tidal phase. These calculations were based on data recorded by an Acoustic Doppler Current Proiler (ADCP) moored near the estuarine mouth for a complete semi-diurnal tidal cycle (13 hours) at spring tide. The value of the tidal excursion was calculated by integrating the depth-averaged velocity over the entire lood tidal phase. The choice of the sample locations sought to ensure that the water samples were fully characterized by estuarine conditions and were not mixed with coastal water.
All phytoplankton samples were obtained at the subsurface using a Van Dorn bottle (0.5 m). The samples were collected in duplicate, with one replicate preserved in lugol solution and the other in neutral formalin, both at a inal concentration of 1%. After sedimentation, the organisms (cells, colonies and ilaments) were quantiied by the Utermöhl method using an inverted microscope at a magniication of 400×. Both replicates were analyzed because some organisms are better viewed in lugol solution and others in neutral formalin. In each sample, at least 100 organisms per dominant taxon were recorded in order to reach a precision of ± 20% within 95% conidence limits (EDLER; ELBRÄCHTER, 2010).
In addition to phytoplankton sampling, physical and chemical parameters were measured, including temperature (T), pH, dissolved oxygen (DO), oxygen saturation (%) (OS) and salinity (Sal), using a multiparametric probe (Hanna HI 9828). Water samples were collected in triplicate and analyzed for the following variables: chlorophyll-a (Chlor. a); silicate (Si), soluble reactive phosphorus (SRP), total phosphorus (TP), nitrite (N-NO2-), nitrate (N-NO
3
-), ammoniacal nitrogen
solids (TSS), distinguishing organic (volatile suspended solids - VSS) and inorganic (ixed suspended solids - FSS) solids. Chlorophyll a (extracted by 90% acetone) and nutrients were analyzed by spectrophotometry using standard colorimetric methods for estuarine and marine waters (VALDERRAMA, 1981; STRICKLAND; PARSONS, 1972). Suspended solids were analyzed by gravimetric determination (APHA, 1999). Water transparency was estimated with a Secchi disk.
In order to evaluate the structure of the phytoplankton assemblage, the following indicators were used: density of organisms per L-1 (org L-1), biomass estimated by chlorophyll-a concentration, diversity according to the Shannon-Wiener index, taxon richness (number of taxa per sample), and relative abundance as a percentage. Relative abundance (%) of divisions and taxa were calculated based on phytoplankton density according to the formula:
Relative abundance (%) = D×100/TD, where: D = density (org L-1) of each taxon or division per sample;
TD = phytoplankton total density (org L-1) per sample. When a single division or taxon exceeded 50% of the total phytoplankton density in a sample, it was considered dominant.
Spearman rank correlations were used to determine the relationships between environmental variables and total phytoplankton density, chlorophyll-a and Shannon-Wiener diversity index, taking into account all four estuaries in both seasons (n = 8). Only signiicant correlations are presented (p < 0.05).
Bray-Curtis similarity based on fourth root transformation of the densities of descriptive taxa was used to compute the degree of similarity of phytoplankton assemblages among samples (estuary/seasons). Taxa contributing more than 1% of the total density in at least one sample were deined as descriptive taxa. Cluster analysis based on the Bray-Curtis similarity was performed using UPGMA, and the signiicance of groups was tested with the Similarity Proile test (SIMPROF). A similarity percentage analysis (SIMPER) was applied to obtain the contribution of each taxon in percent terms, provided by Bray-Curtis similarity measures.
The relationships between environmental variables and phytoplankton assemblages were assessed using Canonical Correspondence Analysis (CCA). Before performing CCA, environmental variables (average values) were log (x+1) transformed and densities of descriptive taxa were fourth root transformed.
An initial CCA was performed to evaluate the marginal effects of each environmental variable. A marginal effect represents the percentage of variance (λ1) explained by only one explanatory variable when the effects of other explanatory variables are ignored (TER BRAAK; SMILAUER, 2002). The signiicance (p < 0.05) of each variable was tested with Monte Carlo Permutations, using 499 permutations. Only signiicant variables were included in the inal CCA. Also in the inal CCA, the signiicance (p < 0.05) of the irst canonical axis and of all canonical axes together were tested with Monte Carlos with 499 permutations.
The PRIMER 6.0 software package was employed to calculate the Shannon-Wiener index and Bray-Curtis similarity, and to perform the SIMPER and SIMPROF cluster analyses. The Canoco 4.5 software package (Biometry, Wageningen, The Netherlands) was used for CCA and STATISTICA software (for Windows, version 7) for Spearman correlation tests.
RESULTS
H
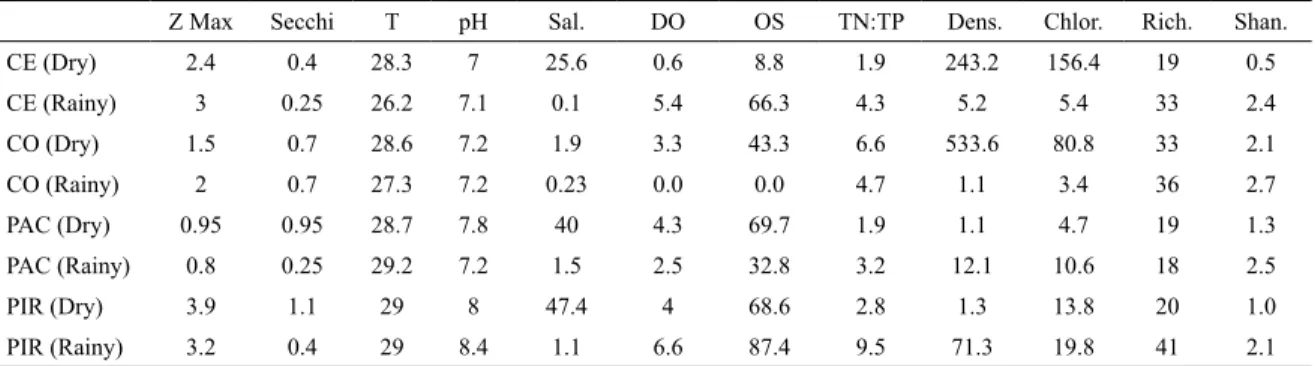
ydrOlOgicalvariablesThe seasonal luctuations of FSS (Figure 2a) and salinity (Table 1) were similar in all the four estuaries. FSS was higher in the rainy season, relecting larger river input, whereas higher salinity values were recorded in the dry season, relecting a stronger intrusion of salt water. With a coastal average salinity of 37, the estuaries were classiied as hypersaline (PIR and PAC), polyhaline (CE) and oligohaline (CO) in the dry season. All of them were oligohaline (salinity < 2) in the rainy season. Concentrations of Si, a tracer element of the continental contribution, were higher in the rainy season, except for CE (Figure 2b).
Water temperatures (26.2°C to 29°C) varied only slightly across seasons in all the estuaries (Table 1). The lowest pH values were measured in CO and CE. All the estuaries were shallow (< 4.0 m), and had low oxygen concentrations (< 5.0 mg.L-1), except for CE and PIR in the rainy season (Table 1). The euphotic zone (Zeu, estimated as 2.7 times the Secchi depth) (COLE, 1983) extended to at least 50% of the total water column depth in all the estuaries (Table 1), but not in CE or PIR in the rainy season.
Figure 2. (A) Concentrations of suspended solids, (B) Soluble reactive silicon, (C) phosphorous and (D) nitrogen forms in the four studied estuaries.
TSS (total suspended solids), FSS (Fixed suspended solids), VSS (volatile suspended solids), Soluble reactive phosphorous (SRP), TP (total phosphorous), TN (total nitrogen). CE: Ceará, CO: Cocó, PAC: Pacoti, PIR: Pirangi. Detection limit of SRP (≤ 0.01), N-NO2- (≤ 0.02), N-NO3- (≤
0.12 ) and N-Ammonical (≤ 0.29).
Table 1. Environmental and biotic variables in the four estuaries studied (dry and rainy seasons): Z Max (maximum dep -th), Secchi depth (m), T (°C) (temperature), DO (%) (dissolved oxygen) and OS (mg L-1) (oxygen saturation), Dens. (Org L-1) (Phytoplankton density), Chlor. (µg L-1) (Chlorophyll), Rich. (Richness), Shannon index. CE: Ceará, CO: Cocó, PAC: Pacoti, PIR: Pirangi.
Z Max Secchi T pH Sal. DO OS TN:TP Dens. Chlor. Rich. Shan.
CE (Dry) 2.4 0.4 28.3 7 25.6 0.6 8.8 1.9 243.2 156.4 19 0.5
CE (Rainy) 3 0.25 26.2 7.1 0.1 5.4 66.3 4.3 5.2 5.4 33 2.4
CO (Dry) 1.5 0.7 28.6 7.2 1.9 3.3 43.3 6.6 533.6 80.8 33 2.1
CO (Rainy) 2 0.7 27.3 7.2 0.23 0.0 0.0 4.7 1.1 3.4 36 2.7
PAC (Dry) 0.95 0.95 28.7 7.8 40 4.3 69.7 1.9 1.1 4.7 19 1.3
PAC (Rainy) 0.8 0.25 29.2 7.2 1.5 2.5 32.8 3.2 12.1 10.6 18 2.5
PIR (Dry) 3.9 1.1 29 8 47.4 4 68.6 2.8 1.3 13.8 20 1.0
PIR (Rainy) 3.2 0.4 29 8.4 1.1 6.6 87.4 9.5 71.3 19.8 41 2.1
(Figure 2c). TN concentrations in CO and CE were higher in the dry season, contrasting with PAC and PIR where TN concentrations were higher in the rainy season (Figure 2d). With regard to inorganic nitrogen, the predominant form was N-ammoniacal, except for CE and PIR in the rainy season, where oxygen concentrations were the highest of all the samples, which probably favored the nitriication process, with a predominance of N-NO3- (CE) and N-NO
2 - (PIR) (Figure 2d). The inorganic nitrogen forms were higher in the dry season in CE, CO and PIR, but not in PAC, where, as similarly for phosphorus (TP and SRP), inorganic nitrogen
concentrations were highest in the rainy season, suggesting an interaction between the river low and the concentrations of these nutrients. TN: TP molar ratios (< 9.5:1) were low in all the estuaries in both seasons, which indicated a potential nitrogen limitation to primary production (Table 1).
P
HytOPlanktOnassemblagestructure(green algae) (21%, 33 taxa), Cyanophyta (cyanoprokariotes) (19%, 30 taxa), Euglenophyta (euglenoids) (12%, 19 taxa), Dinophyta (dinolagellates) (9%, 14 taxa) and Cryptophyta (cryptomonads) (6%, 10 taxa). Four taxa (2.5%) were not identiied (NID).
Richness ranged from 18 in PAC to 41 in PIR (both in the rainy season, Table 1) and was positively correlated with TN:TP molar ratios (R = 0.8121; p < 0.05; n = 8). The Shannon-Wiener diversity index ranged from 0.5 in CE (dry) to 2.6 in CO (rainy) (Table 1) and was negatively correlated with salinity (Spearman correlation, R= - 0.7619; p < 0.05; n = 8).
Total phytoplankton density varied from 1.1 × 10⁵ org L-1 in CO (rainy season) and PAC (dry season) to 533.6 × 10⁵ org L-1 in CE (dry season) (Table 1). Following the seasonal pattern of TN (Figure 2d), the highest phytoplankton densities were recorded in the dry season in CO and CE, and in the rainy season in PAC and PIR (Table 1). Of all the abiotic variables analyzed only VSS (R = 0.9286; p < 0.05; n = 8) and N-NO2- (R = 0.8264; p < 0.05; n = 8) were positively and signiicantly correlated with total phytoplankton density.
Phytoplankton biomass estimated by chlorophyll a ranged from 3.4 µg L-1 in CO (rainy season) to 156.4 µg L-1 in CE (dry season), coinciding with the minimum and maximum values of total phytoplankton density (Table 1). Chlorophyll a and total phytoplankton density were positively correlated (R = 0.9848; p < 0.05; n = 8).
Cryptomonads and cyanoprokaryotes dominated the phytoplankton assemblage in the dry season (rela-tive abundance > 50%) in CE and CO, respec(rela-tively, while diatoms were dominant in PAC and PIR (Figure 3). In CE, a single cryptomonad taxon (Cryptomonas/ Rhodomonas 1) attained 91% of relative abundance in the dry season. In CO, the most abundant cyano-prokaryotes were Synechocystis aquatilis (48%) and Romeriagracilis (13%). In PAC and PIR the dominant taxon was a small pennate diatom aff. Phaeodactylum tricornutum (apical size 11 to 15 µm), which accounted for 63% (PAC) and 77% (PIR) of relative abundance in the dry season.
In the rainy season, diatoms and green algae dominated the phytoplankton assemblages of CE and PIR, representing 70% and 80% of total relative abundance, respectively (Figure 3). In CE the most abundant diatoms were Aulacoisera distans (24%), Cyclotellameneghiniana (12%) and Navicula sp1 (12%). In PAC, the most abundant green algae were Monoraphidium contortum (35%) and Monoraphidium kormakovae (33%).
In CO and PAC, a more even distribution of divisions was observed in the rainy season with respect to relative abundance. In CO, cyanoprokaryotes, green algae, diatoms and euglenoids accounted for 38%, 35%, 15% and 10%, respectively, of the total relative abundance (Figure 3). The most abundant species were the green algae Monoraphidium caribeum (15%) and Actinastrum aciculare (15%), and the cyanoprokaryotes Jaaginema subtilissimum (16%) and Pseudanabaena limnetica (11%). In PAC, relative abundance was mainly distributed between cyanoprokaryotes (44%), diatoms (25%), green algae (15%) and euglenoids (12%) (Figure 3). The most abundant species were the cyanoprokaryotes Planktothrix isothrix (23%) and Cylindrospermopsis raciborskii (12%).
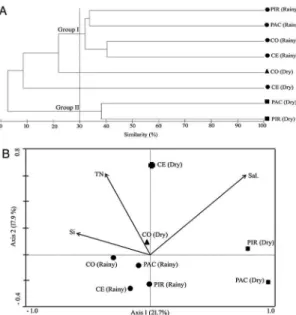
Cluster analysis based on Bray-Curtis similarity in-cluding only descriptive taxa (65 taxa) distinguished two ma -jor groups (I and II, Figure 4a). The SIMPROF test conirmed the signiicance of these groups (p < 0.05). Samples from the rainy season grouped closely together, indicating the great inluence of luvial input on the phytoplankton composition. According to the SIMPER procedure (cut-off 90%), the main species responsible for an average similarity of around 30% within group I were species commonly found in eutrophic environments: the euglenoid Trachelomonasvolvocina var. volvolcina (12.8%) (MOURA et al., 2007); the cyanopro -karyotes Jaaginemasubtilissimum (11.94%) (KOMÁREK; ANAGNOSTIDIS, 2005), Planktothrix isothrix (11.1%), Cylindrospermopsis raciborskii (5.07%) (BITTENCOURT-OLIVEIRA et al., 2014), Jaaginema sp1 (4.45%) and Pseudanabaena limnetica (5.78%) (CHOMÉRAT et al., 2007); the diatoms Cyclotella meneghiniana (8.16%) (PADISÁK et al., 2009), Aulacoseira granulata var. angustis-sima (6.3%), A. granulata var. granulata (4.27%), Nitzschia sp3 (2.61%) and Aulacoisera distans (2.16%) (PADISÁK et al., 2009) and Navicula cf. amphiceropsis (5.77%) (LAUX; TORGAN, 2011); and the green algae Monoraphidium kormakovae (2.78%), Closterium acutum (2.61%), Monoraphidium contortum (2.2%) and Monoraphidium ca-ribeum (2.09%) (PADISÁK et al., 2009).
Figure 3. Relative abundance (%) of phytoplankton divisions in the four study estuaries (dry and rainy seasons). CE: Ceará, CO: Cocó, PAC: Pacoti,
PIR: Pirangi; D: Dry season; R: Rainy Season; NID: Organisms not identiied.
Figure 4. A: Cluster analysis based on the density of the descriptive
phytoplankton species (relative abundance ≥ 1% in at least one sample). Group I and Group II were signiicant according SIMPROF
test (p < 0.05). B: Canonical Correspondence Analysis (CCA) showing the spatial and temporal variability of phytoplankton assemblage structure in the four studied estuaries (dry and rainy season). CE: Ceará, CO: Cocó, PAC: Pacoti, PIR: Pirangi. The variables TN (total
nitrogen), Si (soluble reactive silicon) and Sal. (salinity) signiicantly
affected phytoplankton assemblage structure (p < 0.05)
In the dry season, CE and CO were distinct from each other and also from other samples. In CE, three descriptive species were exclusively found in this sample: the cryptomonads Cryptomonas/Rhodomonas 1 and Cryptomonas/Rhodomonas 2; and the diatom Cyclotella striata, a euryhaline species commonly
found in estuaries (MOREIRA FILHO et al., 1999). CO was distinguished by the following descriptive species exclusively occurring in this location: the cyanoprokaryotes Synechocystisaquatilis, S. salina and Romeria gracilis; the green algae Micractiniumpusillum; and the diatom Thalassiosira weisslogii. Although S. aquatilis (CHOMÉRAT et al., 2007), R. gracilis (KOMÁREK; ANAGNOSTIDIS, 2005) and M.pusillum (PADISÁK et al., 2009; MARSHALL; BURCHARDT, 2004) are freshwater species, they can be found under oligohaline conditions in eutrophic estuaries. In contrast, S. salina is associated with oligohaline to euhaline conditions (KOMÁREK; ANAGNOSTIDIS, 2000) and
T. weisslogii with oligohaline to mesohaline conditions (TORGAN; SANTOS, 2006).
cca
analysisOf tHeinfluenceOf abiOticvari -ablesOnPHytOPlanktOnassemblagesThe initial CCA analysis indicated that salinity (λ1 = 0.752; F = 1.511; p = 0.018), and concentrations of Si (λ1 = 0.709; F = 1.404; p = 0.014) and TN (λ1 = 0.682; F = 1.337; p = 0.02) had signiicant marginal effects (p < 0.05) on phytoplankton variation, explaining 20%, 19% and 18% of the total inertia (= 3.72), respectively. The percentage of variance explained by each variable was individually obtained by dividing the respective eigenvalues by the total inertia.
of the 65 descriptive phytoplankton taxa) and 69.4% of the relationship between biotic and abiotic variables. Both the irst and all canonical axes were signiicant (F = 1.108, p = 0.0280 and F = 1.773, p = 0.002, respectively). Moreover, the correlation coeficients between the biotic and abiotic data were 0.984 for the irst axis and 0.985 for the second axis, indicating a strong correlation between phytoplankton and the abiotic variables salinity, Si and TN (Figure 4b).
The irst axis explained 21.7% of variance in the biotic data and was most positively correlated with salinity (r = 0.7540) and negatively with Si (r = -0.5835) (Figure 4b). This axis separated marine and luvial inluences on phytoplankton assemblages with more saline samples (CE, PAC and PIR in the dry season) on the positive side of axis 1, including hypersalinity-tolerant species in PAC and PIR.
The second axis accounted for 17.9% of the biotic variance and was most positively correlated with TN (r = 0.6127). CE and CO samples from the dry season were located on the positive side of axis 2 (Figure 4b). The high concentrations of TN (but also TP) in these samples indicate a strong correlation between anthropogenic eutrophication and the species found in CE and CO.
DISCUSSION
In the current study, increased luvial discharge seems distinctly to inluence nutrient concentrations and phytoplankton attributes in each estuary. The pattern observed in PAC, with higher nutrient concentrations (N-NO3-, N-NO
2
- and SRP) in the rainy season, was similar
to that of the Formoso estuary, a tropical system also in northeastern Brazil (SILVA et al., 2009). The same pattern has also been observed after storms in tropical systems in Australia and has been attributed to increased leaching of materials from watersheds and river channels (EYRE; TWIGG, 1997). For another estuarine tropical system in northeastern Brazil, NORIEGA et al. (2013) showed that all the dissolved nitrogenous nutrients were higher during the rainy season, comprising nearly 85% of the total material exported to the sea in this period.
In contrast, concentrations of the same nutrients decreased in CE, CO and PIR during the rainy period (except for N-NO3-, in CE). A decrease in nutrient concentrations as a consequence of increased freshwater input into estuaries has been attributed to the dilution of point source discharges (EYRE; FERGUSON, 2006). CO and CE are estuaries subjected to constant discharge of anthropogenic efluents, especially wastewaters (LACERDA et al., 2008). Although the predominant sources
of nitrogen and phosphorus in PIR are nonpoint sources, such as agriculture and husbandry (LACERDA et al., 2008), this estuary is also intensively occupied by shrimp farms, which can be considered a point source.
In CE and CO, TN contents were predominantly composed (from 57 to 93%) of inorganic forms (mainly ammoniacal-N) in both seasons. Similarly to other nutrients, their concentrations decreased in the rainy season, likely due to the dilution of point sources by higher river discharge.
In contrast, in PAC and PIR, where TN concentrations were largely made up of organic compounds (from 40 to 100%), higher concentrations were found in the rainy season, probably derived from materials of the watershed and the river channel. Similarly, SAECK et al. (2013), studying a river-estuary-bay continuum in an Australian subtropical system, observed that during high low events TN and TP concentrations signiicantly increased in the lower estuary (0 to 10 km), and were most frequently dominated by particulate and organic forms. The higher TP in PIR in the dry period can be mainly attributed to the point source as explained above.
Phytoplankton biomass/density followed the same seasonal pattern observed for TN in all the estuaries. In CO and CE, phytoplankton biomass was diluted by river discharge or even lushed out of the estuary during the rainy period, probably due to a decrease in water residence time (ACHARYYA et al., 2012; BURFORD et al., 2012). In addition, the decrease in phytoplankton biomass may be associated with a decrease in the inorganic forms of nitrogen and phosphorus.
SANTIAGO et al. (2010), who studied the phytoplankton dynamics in a highly eutrophic estuary in northeastern Brazil found that phytoplankton biomass and phosphate concentrations were higher in the dry season. In addition to the inluence of point sources, which according to SANTIAGO et al. (2010) are responsible for an enhanced eutrophication process in the dry season, the nutrients from runoff events in the rainy period may fuel phytoplankton blooms commonly occurring during the next dry season, when the river discharges decrease signiicantly. Particularly, in CO and CE, the large difference in nutrient concentrations between the dry and rainy periods suggest that the anthropogenic point source discharges of N and P are considerably higher in the dry season than during increased runoff events in the rainy period.
in tropical or subtropical estuaries (ACHARYYA et al., 2012; BURFORD et al., 2012). Although we observed low Secchi depths in the rainy season, light did not seem to be a limiting factor for phytoplankton, according to the CCA multivariate analysis. Associated with the sea-sonal pattern of TN concentration, phytoplankton den-sity and biomass were higher in PAC and PIR during the rainy period. Since in these estuaries a large proportion of TN was made up of organic compounds, it is possible that the phytoplankton utilized these organic forms of N. In other tropical estuaries, dissolved organic nitro-gen, i.e. urea, signiicantly contributes to fulilling the N requirements of the phytoplankton (e.g. BUFFORD et al., 2012).
Additionally, the increase of TN in PAC and PIR in the rainy season may relect land-use in the respective river basins. The increase was more evident in PAC, where the concentration during the rainy season was almost three times as high as in the dry season. According to LACERDA et al. (2008) the main source of nitrogen in these two estuaries is from anthropogenic activities, especially husbandry. Particularly, the N input from husbandry in PAC is at least twice as high as in the other estuaries (LACERDA et al., 2008).
The strong inluence of TN on the phytoplankton was also shown by CCA that suggested that salinity and silica, in addition to TN concentrations, were the main environmental factors inluencing phytoplankton composition in all the four estuaries studied. Nitrogen is the primary factor limiting productivity in most estuaries and coastal marine ecosystems worldwide (HOWARTH; MARINO, 2006), although some studies have also identiied phosphorus as the limiting nutrient (GREGORACCI et al., 2012). Apart from N and P, silica is an essential nutrient for diatoms and silicolagellates (LANCELOT; MUYLAERT, 2011). Differences in these three abiotic variables lead to two clearly deined phytoplankton assemblages: the irst characterized by the dominance of eutrophic freshwater taxa in all the estuaries during the rainy season (higher luvial inluence, Group I of the cluster analysis); and the second by the dominance of typical marine taxa in hypersaline estuaries during the dry season (Group II of the cluster analysis).
Of all the descriptive taxa that occurred in the rainy season in all the estuaries we highlight Planktothrix isothrix and Trachelomonas volvocina var. volvolcina, which only occurred in this season, as well as other eutrophic freshwater euglenoids, cyanoprokaryotes, diatoms and
green algae. Planktothrix isothrix has been referred to as a potentially toxic cyanoprokaryote in Brazilian water bodies (SANT’ANNA et al., 2008), thus indicating the need for further studies on cyanobacteria blooms in these estuaries.
The rainy season was further marked by higher phytoplankton richness and diversity. This is in agreement with indings for other tropical estuaries in northeastern Brazil where the phytoplankton composition in the rainy season is strongly inluenced by the input of freshwater species (SILVA et al., 2009; SANTIAGO et al., 2010).
The second group, which included PAC and PIR in the dry season, was distinguished by the presence of marine species likely carried into the estuary by the tide. The main descriptive taxa of this group (aff. Phaeodactylum tricornutum, Cylindrotheca closterium and Thalassionema nitzschioides) are marine diatoms of cosmopolitan distribution (HASLE; SYVERTSEN, 1996), commonly found on the northeastern coast of Brazil (MOREIRA FILHO et al., 1999).
A tidal effect can be excluded because all the samples were collected during high tide. Hypersaline conditions and the dominance of marine species observed in PAC and PIR in the dry season indicated an upstream movement of the estuarine brackish water in these locations. This clear tendency toward marinisation (i.e. an increased intrusion of marine waters, e.g. CHAALALI et al., 2013) of PAC and PIR in the dry season led to changes in the species composition, with an emergence of marine species and a decrease in phytoplankton biomass. LACERDA et al. (2007) reported that the PAC mangrove area doubled from 1958 (0.71 km2) to 2004 (1.44 km2) mostly due to alterations in freshwater supply and sediment accumulation in consequence of river damming. Changes due to climate changes were also not ruled out by these authors. Similarly, CHAALALI et al. (2013) reported changes in the longitudinal distribution of copepods as a consequence of marinisation in the Gironde estuary, the largest estuary in southwestern Europe. SILVA et al. (2004) also found changes in the copepod species composition associated with marinisation in an estuarine area (Suape bay) in northeastern Brazil. It is, therefore, reasonable to assume that changes in the longitudinal distribution of primary producers and/or zooplankton in estuaries undergoing a marinisation process may impact the upper levels of the estuarine food web.
MUYLAERT, 2011), and this has been conirmed by the current study. However, no clear relationship between salinity and phytoplankton diversity and density is known for estuaries in general. A decrease in diversity and density or biomass during periods when estuaries are more strongly inluenced by coastal waters (such as PAC and PIR in the dry season) may, therefore, be more strongly associated with nutrient limitation (especially nitrogen) than with increased salinity, especially on the oligotrophic east coast of northeastern Brazil (KNOPPERS et al., 2009). The TN: TP ratios in these two estuaries were lower in the dry season, indicating a potentially greater nitrogen limitation. However, the dominance of marine species in PAC and PIR in the dry season indicate the potential of these estuaries to sustain primary productivity even during periods of hypersalinity and lower nutrient concentrations (especially total nitrogen).
In contrast, the phytoplankton assemblage of CE was dominated by the cryptophyta Cryptomonas/Rhodomonas 1 in the dry season. Seasonal blooms of nanoplanktonic cryptomonads (< 20 µm) are common in polyhaline and mesohaline estuarine areas (e.g. MARSHALL et al., 2006). This group is favored by high turbidity (e.g. REYNOLDS et al, 2002), hypoxia and increased concentrations of inorganic nutrients (e.g. ROTHENBERGER et al., 2014), conditions observed in CE.
CO was dominated by non-nitrogen-ixing cyanobac -teria in the dry season. The most representative species was S. aquatilis, which accounted for about 50% of the total phytoplankton density in this sample. S. aquatilis has previously been identiied as a potentially micro -cystin-producing species in Brazil (SANT’ANNA et al., 2008). The occurrence and dominance of S. aquatilis in estuaries is associated with its tolerance to salinity (SHEN et al., 2010), which explains its success in CO under oligohaline conditions.
Although the high densities and phytoplankton biomass found in CO and CE in the dry season were associated with higher inorganic nutrient concentrations, the predominant species in these samples may have been well adapted to assimilate these nutrients under lower TN: TP (< 7N: 1P) ratios. Although the TN: TP atomic ratios required by phytoplankton are about 16N: 1P (REDFIELD, 1958), the nutritional requirements of each species may vary according to its rates of absorption, assimilation and nutrient storage capacity (VUORIO et al., 2005). In our study, the CCA suggested that TN concentration rather than the N: P ratio was the key factor to stimulate growth and taxonomic
composition of phytoplankton assemblages in all the four estuaries in both seasons. Therefore, both the N: P ratio and total supply of nitrogen nutrients should be controlled in strategic aquatic environments such as estuaries.
In brief, our indings show that increased freshwater input has differential effects in pristine and eutrophic tropical semiarid estuaries. Overall, freshwater low was probably the main factor for nutrient dilution, as well as for controlling phytoplankton blooms in eutrophic estuaries, thus mitigating the effects of the eutrophication process. Additionally, the variation observed for salinity, silica, and total nitrogen was suggested to be the main main driver of phytoplankton structure.
Cryptomonads and cyanobacteria blooms in urban estuaries and the inluence of saline intrusion on the phytoplankton structure in freshwater-deprived estuaries emerge as the main changes detected in this study and point to the risks to the functioning and health of these ecosystems.
ACKNOWLEDGEMENTS
The authors wish to thank the CNPq (Proc. 558188/2009-5) and CAPES (Marine Science Project, Proc. 0532/2009) for their inancial support. We also thank the Fundação Cearense de Apoio ao Desenvolvimento Cientíico e Tecnológico (FUNCAP) for the research grant to HSB (BFP program).
REFERENCES
ACHARYYA, T.; SARMA, V. V. S. S.; SRIDEVI, B.; VENKATARAMANA, V.; BHARATHI, M. D.; NAIDU, S. A.; KUMAR, B. S. K.; PRASAD, V. R.; BANDYOPADHYAY, D.; REDDY, N. P. C.; KUMAR, M. D. Reduced river discharge
intensiies phytoplankton bloom in Godavari estuary, India.
Mar. Chem., v. 132-133, p. 15-22, 2012.
AMERICAN PUBLIC HEALTH ASSOCIATION (APHA).
Standard Methods for the examination of water and
wastewater. Washington: American Public Health Association, 1999.
BASTOS, R. B.; FEITOSA, F. A. N.; MUNIZ, K. Variabilidade
espaço-temporal da biomassa itoplanctônica e hidrologia no
estuário do rio Una (Pernambuco - Brasil). Trop. Oceanogr., v. 33, n. 1, p. 1-18, 2005.
BITTENCOURT-OLIVEIRA, M. C.; PICCIN-SANTOS, V.; MOURA, A. N.; ARAGÃO-TAVARES, N. K. C.; CORDEIRO-ARAÚJO, M. K. Cyanobacteria, microcystins and cylindrospermopsin in public drinking supply reservoirs of Brazil. An. Acad. Bras. Ciênc., v. 86, n. 1, p. 297-310, 2014. BURFORD, M. A.; WEBSTER, I. T.; REVILL, A. T.;
CHAALALI, A.; CHEVILLOT, X.; BEAUGRAND, G.;
DAVID, V.; LUCZAK, C.; BOËT, P.; SOTTOLICHIO, A.; SAUTOUR, B. Changes in the distribution of copepods in the Gironde estuary: A warming and marinisation consequence? Estuar. Coast. Shelf Sci., v. 134, p. 150-161, 2013.
CHOMÉRAT, N.; GARNIER, R.; BERTRAND, C.;
CAZAUBON, A. Seasonal succession of cyanoprokaryotes in a hypereutrophic oligo-mesohaline lagoon from the South of France. Estuar. Coast. Shelf Sci., v. 72, p. 591-602, 2007.
COLE, G. A. Textbook of limnology. 3rd ed. Long Grove:
Waveland Press, 1983.
EDLER, L; ELBRÄCHTER, M. The Utermöhl method for quantitative phytoplankton analysis. In: KARLSON, B.; CUSACK, C.; BRESNAN, E. (Eds.). Microscopic and molecular methods for quantitative phytoplankton analysis.
Paris: UNESCO, 2010. p. 13-20.
EYRE, B.; TWIGG, C. Nutrient behaviour during post-lood
recovery of the Richmond River Estuary, Northern NSW, Australia. Estuar. Coast. Shelf Sci., v. 44, n. 3, p. 311-326, 1997
EYRE, B. D. Regional evaluation of nutrient transformation and phytoplankton growth in nine river-dominated sub-tropical east Australian estuaries. Mar. Ecol. Prog. Ser., v. 205, p. 61-83, 2000. EYRE, B. D.; FERGUSON, A. J. P. Benthic metabolism and
nitrogen cycling in a subtropical east Australian estuary (Brunswick): Temporal variability and controlling factors. Limnol. Oceanogr., v. 50, n. 1, p. 81-96, 2005.
EYRE, B. D.; FERGUSON, A. J. P. Impact of a lood event on
benthic and pelagic coupling in a sub-tropical east Australian estuary (Brunswick). Estuar. Coast. and Shelf Sci., v. 66, n.1, p. 111-122, 2006.
ESCHRIQUE, S. A.; MARINS, R. V.; MOREIRA, M. O. P.; ALMEIDA, M. D. Hidrogeoquímica do Fósforo no Estuário do Jaguaribe (CE). In: BRAGA, E. S. (Org.). Volume
Especial do IIISBO: Oceanograia e Mudanças Globais. 1. ed. São Paulo: Instituto Oceanográico da Universidade de São
Paulo, 2008. p. 629-647.
GUENTHER, M.; ARAÚJO, M.; FLORES-MONTES, M.; GONZALEZ-RODRIGUEZ, E.; NEUMANN-LEITÃO, S. Eutrophication effects on phytoplankton size-fractioned biomass and production at a tropical estuary. Mar. Poll. Bull., v. 91, n. 2, p. 537-547, 2015.
GREGORACCI, G. B.; NASCIMENTO, J. R.; CABRAL, A. S.; PARANHOS, R.; VALENTIN, J. L.; THOMPSON, C. C.; THOMPSON, F. L. Structuring of bacterioplankton diversity in a large tropical bay. PLoS ONE, v. 7, n. 2, e31408, 2012. HASLE, G.; SYVERTSEN, E. E. Marine diatoms. In: TOMAS,
C. (Ed.) Identifying Marine Diatoms and Dinolagellates.
New York: Academic Press, 1996. p. 5-385.
HOWARTH, R. W.; MARINO, R. Nitrogen as the limiting nutrient for eutrophication in coastal marine ecosystems: Evolving views over three decades. Limnol. Oceanogr., v. 51, p. 364-376, 2006.
KNOPPERS, B.; SOUZA, W. F. L.; EKAU, W.; FIGUEIREDO, A. G.; SOARES-GOMES, A., 2009. A interface terra-mar do Brasil. In PEREIRA, R. C. and SOARES-GOMES, A. (Eds.). Biologia Marinha. Rio de Janeiro: Editora Interciência, 2009, cap. 22, p. 529-553.
KOMÁREK, J.; ANAGNOSTIDIS, K. Cyanoprokaryota.1.
Teil: Chroococcales. Berlin: Spektrum, Akademische Verlag
(Sübwasserlora von Mitteleuropa; Band 19/1), 2000. 548 p.
KOMÁREK, J.; ANAGNOSTIDIS, K. Cyanoprokaryota 2.
Teil: Oscillatoriales. In: BÜDEL, B.; KRIENITZ, L.;
GÄRTNER, G.; SCHAGERL, M. (Eds). Süsswasserlora von
Mitteleuropa 19.München: Elsevier Spektrum Akademischer Verlag, 2005. 759 p.
LACERDA, L. D.; MENEZES, M. O. T.; MOLISANI, M. M.
Changes in mangrove extension at the Pacoti River estuary,
CE, NE Brazil due to regional environmental changes between 1958 and 2004. Biota Neotrop., v. 7, n. 3, p. 67-72, 2007. LACERDA, L. D.; MOLISANI, M. M.; SENA, D.; MAIA, L.
P. Estimating the importance of natural and anthropogenic sources on N and P emission to estuaries along the Ceará State Coast NE Brazil. Environ. Monit. Assess., v. 141, n. 1, p. 149-164, 2008.
LANCELOT, C.; MUYLAERT, K. Trends in Estuarine Phytoplankton Ecology. In: WOLANSKI, E.; MCLUSKY, D. S. (Eds.). Treatise on Estuarine and Coastal Science. Waltham: Academic Press, 2011. p. 5-15.
LAUX, M.; TORGAN, L. C. Diatomáceas com plastídios no plâncton da foz dos rios do Delta do Jacuí, sul do Brasil: um complemento à taxonomia tradicional. Iheringia, Sér. Bot., v.
66, n. 1, p. 109-132, 2011.
MARSHALL, H. G.; LACOUTURE, R. V.; BUCHANAN, C.; JOHNSON, J. M. Phytoplankton assemblages associated with water quality and salinity regions in Chesapeake Bay, USA. Estuar. Coast. Shelf Sci., v. 69, n. 1/2, p. 10-18, 2006. MARSHALL, H. G.; BURCHARDT, L. Phytoplankton
composition within the tidal freshwater-oligohaline regions of the Rappahannock and Pamunkey Rivers in Virginia. Castanea, v. 69, n. 4, p. 272-283, 2004.
McLUSKY, D. S. Marine and estuarine gradients - An overview. Neth. J. Aquat. Ecol., v. 27, n. 2/4, p. 489-493, 1993. MONCUNILL, D. F. The rainfall trend over Ceará and its
implications. Anais da 8ª Conferência Internacional de
Meteorologia e Oceanograia do Hemisfério Sul, Foz do
Iguaçu, 2006. p. 315-323. Available at: <http://mtc-m16b. sid.inpe.br/col/cptec.inpe.br/adm_conf/2005/10.31.21.38/ doc/315-324.pdf>. Accessed: 23 Feb. 2015.
MOLISANI, M. M.; CRUZ, A. L. V.; MAIA, L. P. Estimation of the freshwater river discharge to estuaries in Ceará State, Brazil. Arq. Ciênc. Mar., v. 39, p. 53-60, 2006.
MOREIRA FILHO, H.; ESKINAZI-LEÇA, E.;
VALENTE-MOREIRA, I. M.; CUNHA, J. A. Avaliação taxonômica e
ecológica das diatomáceas (Chrysophyta-Bacillariophyceae) marinhas e estuarinas nos estados de Pernambuco, Paraiba, Rio Grande do Norte, Ceará, Piauí, Maranhão, Pará e Amapá, Brasil. Trab. Oceanog. Univ. Fed. Pernamb., v. 27, p. 55-90, 1999. MOURA, A. D. N.; BITTENCOURT-OLIVEIRA, M. D.
C.; DANTAS, Ê. W.; ARRUDA NETO, J. D. D. T. Phytoplanktonic associations: a tool to understanding dominance events in a tropical Brazilian reservoir. Acta Bot. Bras., v. 21, n. 3, p. 641-648, 2007.
NOAA. National Oceanic and Atmospheric Administration. National Weather Services. Available at: <http://www. weather.gov/>. Accessed 24 Feb. 2015.
PADISÁK, J.; CROSSETTI, L. O.; NASELLI-FLORES, L. Use
and misuse in the application of the phytoplankton functional
classiication: a critical review with updates. Hydrobiologia,
v. 621, n. 1, p. 1-19, 2009.
PAERL, H. W.; JUSTIC, D. Primary Producers: Phytoplankton Ecology and Trophic Dynamics in Coastal Waters. In: WOLANSKI, E.; MCLUSKY, D. S. (Eds.). Treatise on Estuarine and Coastal Science, Waltham: Academic Press, 2011. p. 23-42.
PAERL, H. W.; VALDES, L. M.; PEIERLS, B. L.; ADOLF, J.
E.; HARDING, L. W. Anthropogenic and climatic inluences
on the eutrophication of large estuarine ecosystems. Limnol. Oceanogr., v. 51, n. 1, p. 448-462, 2006.
REDFIELD, A. C. The biological control of chemical factors in the environment. Am. Sci., v. 46, p. 205-222, 1958.
REYNOLDS, C. S.; HUSZAR, V.; KRUK, C.;
NASELLI-FLORES, L.; MELO, S. Towards a functional classiication
of the freshwater phytoplankton. J. Plankton Res., v. 24, n. 5, p. 417-428, 2002.
REYNOLDS, C. S. The ecology of phytoplankton. New York: Cambridge University Press, 2006. 535 p.
ROTHENBERGER, M. B.; SWAFFIELD, T.; CALOMENI, A. J.; CABREY, C. D. Multivariate analysis of water quality and plankton assemblages in an urban estuary. Estuar. Coast., v. 37, n. 3, p. 695-711, 2014
SAECK, E. A.; HADWEN, W. L.; RISSIK, D.; O’BRIEN, K. R.; BURFORD, M. A. Flow events drive patterns of phytoplankton distribution along a river-estuary-bay continuum. Mar. Fresh. Res., v. 64, n. 7, p. 655-670, 2013. SANTIAGO, M. F.; SILVA-CUNHA, M. G. G.;
NEUMANN-LEITÃO, S.; COSTA, K. M. P.; PALMEIRA, G. C. B.; PORTO NETO, F. F.; NUNES, F. S. Phytoplankton dynamics in a highly eutrophic estuary in tropical Brazil. Braz. J. Oceanogr., v. 58, n. 3, p. 189-205, 2010.
SANT’ANNA, C. L.; AZEVEDO, M. T. P.; WERNER, V. R.; DOGO, C. R.; RIOS, F. R.; CARVALHO, L. R. Review of
toxic species of Cyanobacteria in Brazil. Algol. Stud., v. 126,
n. 1, p. 251-265, 2008.
SASSI, R. Phytoplankton and environmental factors in the Paraíba do Norte river estuary, northeastern Brazil: composition, distribution and qualitative remarks. Bol. Inst. Oceanogr., v. 39, n. 2, p. 93-115, 1991.
SHEN, P. P.; TAN, Y. H.; HUANG, L. M.; ZHANG, J. L.; YIN, J. Q. Occurrence of brackish water phytoplankton species at a closed coral reef in Nansha Islands, South China Sea. Mar. Pollut. Bull., v. 60, n. 10, p. 1718-1725, 2010.
SILVA, A. P.; NEUMANN-LEITÃO, S.; SCHWAMBORN, R.; GUSMÃO, L. M. D. O. Mesozooplankton of an impacted bay in North Eastern Brazil. Braz. Arch. Biol. Tech., v. 47, n. 3, p. 485-493, 2004.
SILVA, M. H.; SILVA-CUNHA, M. D. G. G.; PASSAVANTE, J. Z. O.; GREGO, C. K. S.; MUNIZ, K. Estrutura sazonal e espacial
do microitoplâncton no estuário tropical do rio Formoso, PE,
Brasil. Acta Bot. Bras., v. 23, n. 2, p. 355-368, 2009.
STRICKLAND, J. D. H.; PARSONS, T. R. A practical handbook of seawater analysis. Ottawa: Fisheries Research Board of Canada, 1972.
TER BRAAK, C. J. F.; SMILAUER, P. CANOCO Reference Manual and CanoDraw for Windows User’s Guide: Software for Canonical Community Ordination (version 4.5). Ithaca: Microcomputer Power, 2002.
TORGAN, L. C.; SANTOS, C. B. Thalassiosira weisslogii
(Coscinodiscophyceae, Bacillariophyta) em ambientes lacustres na Planície Costeira do sul do Brasil. Iheringia, Sér. Bot., v. 61, n. 1/2, p. 135-138, 2006.
VALDERRAMA, J. C. The simultaneous analysis of total nitrogen and total phosphorus in natural waters. Mar. Chem., v. 10, p. 109-122, 1981.
VUORIO, K.; LAGUS, A.; LEHTIMÄKI, J. M.; SUOMELA, J.; HELMINEN, H. Phytoplankton community responses to nutrient and iron enrichment under different nitrogen to
phosphorus ratios in the northern Baltic Sea. J. Exp. Mar.
Biol. Ecol., v. 322, n. 1, p. 39-52, 2005.
ZANELLA, M. E. As características climáticas e os recursos hídricos do Ceará. In: SILVA, J. B.; CAVALCANTE, T. C.;
DANTAS, E. W. C. (Org.). Ceará: um novo olhar geográico.