K
Ш
BULLETIN OF THE SERBIAN GEOGRAPHICAL SOCIETY
2013.
XCIII-
. 4
YEAR 2013
TOME XCIII - N 4
Original scientific paper UDC: 551.311.21(497.11)
DOI: 10.2298/GSGD1304023M
DYNAMICS OF SUSPENDED SEDIMENT LOAD IN THE UPPER PART OF THE RASINA RIVER BASIN IN 2010
SANJA MUSTAFIĆ1*,PREDRAG MANOJLOVIĆ1,PREDRAG KOSTIĆ1
1University of Belgrade-Faculty of Geography, Studentski trg 3/3, Belgrade, Serbia
Abstract: The papertreats the issue of the suspended sediment load transport in the upper part of the Rasina River Basin, upstream from the ''Ćelije" reservoir during the year of 2010. Measurements of the suspended sediment concentrations were being done at two hydrological profiles Brus and Ravni. Total quantity of the suspended sediment load that was transported at the profile of Brus in 2010 amounted to 3,437.3 t, which gave the specific transport of 16.4 t/km2/year. At the downstream profile of Ravni, 43,165 t of the suspended sediment load was transported, that is, 95.7 t/km2/year. The basin on the whole is characterized by the exsistance of two seasons, which by their characteristics in the load transport represent the extreme variants. During the winter-spring season, 74-85.8 % of the total annual load was transported, nd during the summer-autumn season between 14.2 and 26 %.
Key words: suspended sediment, seasonal variability, extreme hydrological conditions, Rasina, Serbia.
Introduction
Soil erosion falls into the group of processes that has direct repercussions on the dynamics of siltation of water reservoirs. In addition to siltation of reservoirs with suspended sediment load and deterioration of water quality, erosion and suspended sediment load transport may be limiting factors for development of area which gravitates towards the
reservoir (Mustafić S., Kostadinov S., Manojlović P., 2008). Therefore, the study of soil
erosion is imposed as a fundamental problem which solving implies determination of all of its forms: chemical erosion, mechanical water erosion, mapping of degraded areas and the
like. Taking into acccount the importance of the water reservoir "Ćelije" and its role in
water supply, previous researches have established the amount and spatial distribution of
water capacities ( anojlović P et. al., 2013), analysed the changes in erosion intensity in the
period 1971-2011 (Kostadinov S. et al., 2014), as well as the condition and quality of soil
resources (Belanović S. et. al., 2012, Kadović R. et al., 2012). In this paper the problems
related to dynamics and suspended sediment load transport were treated. Considering that during 2010, the area of Central and Eastern Europe was under the influence of extreme climate events that strongly reprecussed on the condition and quality of the environment (Loczy D., 2012), the researches presented in this paper offered the possibility of determining the suspended sediment load transport during extreme hydrological conditions.
* -mail: [email protected]
Physical and geographical characteristics of the basin
The Rasina River is the right tributary of the Zapadna Morava (West Morava). The
basin covers an area of 1,054 km2, and 611,3 km2 to the "Ćelije" reservoir. In the Rasina
River Basin, 744 mm of precipitation is excreted on the average, which is a slightly higher value than the average value for Serbia which amounts to 739 mm (Bajat et al. 2012). The seasonal distribution of precipitation is such that the maximal amount is excreted during summer (30.1 %), while only June participates with 12.3 % of the annual distribution. Spring follows with 27.1 %, with a dominant month of May, within which 11.6 % of the annual precipitation amount is excreted. Autumn months participate with 23.8 % and winter with 19.5 % of the annual distribution of precipitation. By increasing the altitude, the
average increase in precipitation is 77 mm/100 m (Živković N., Anđjelković G.,2004).
The average weighted specific runoff in the Rasina River Basin to the "Ćelije"
reservoir is higher than the average for Serbia (7,06 l/s/km2, Manojlović P., Živković N.,
1997 ) and amounts to 9 l/s/km2. The specific runoff values range from 3 l/s/km2 in the most
downstream sector at the dam, to 27.9 l/s/km2 which is the value in the highest mountainous
part of the basin. The greatest aboundance of water in the basin, with the participation of
65.3 % in the total runoff formation, is located at the altitude of 700 m ( anojlović P. et. al.,
2013).
The largest area cover the flysch rocks with 41 %, which are the most common in the middle part of the basin in the altitudinal zone between 300 and 900 m. This rocky complex participates with 39.6 % in the total water runoff in the basin. The second by representation are the magmatites and metamorphites, which cover 39 % of the basin area, with 42.8 % of the total runoff. 16.5 % of the basin area belong to the unbound sediments, sands and alluvium, and the least distributed (3.5 %) are the limestones and dolomites
( anojlović P et. al., 2013).
Methodology
Water sampling for the use of determining the concentration of suspended sediment load was carried out on two hydrological profiles Brus and Ravni. The samples were being taken during the calendar year of 2010. The concentration of suspended sediment load in the water was being determined by filtration of the liter samples with the aid of a vacuum pump Sartorius, and then by measuring the weight of a filter paper on the digital scale after drying in the dryer at 105 °C, and the desiccator before and after decantation. A filter paper Whatman 359 was used. All analytical procedures were done in the Laboratory of Physical Geography, Faculty of Geography, Belgrade.
Daily discharge values on the hydrological profiles of Brus and Ravni, as well as the data on the amount of precipitation at the stations Kopaonik and Brus, were obtained from the Republic Hydrometeorological Service of Serbia (RHSS, 2010).
Results and Researches
Basic characteristics of runoffs, suspended sediment concentrations and suspended sediment load transport
The average annual value of the suspended sediment concentration (SSC) at the
hydrological station of Brus is 0.0215 g/l at the average annual discharge of 2.24 m3/s (q=
10.6 l/s/km2). The minimal daily measured SSC was only 0.0001 g/l and was determined
25
lowest discharge values. The maximal recorded value of the SSC was 0.2726 g/l and was measured after the July showery precipitation. The ratio between the daily extremes is 1:2726.
On a monthly level, the large differences and deviations of one month in respect to the other are observed, as well as in respect to the annual average. The lowest average monthly value by far had September with 0.0004 g/l, at the average monthly discharge of
0.37 m3/s (q= 1,73 l/s/km2). The average monthly maximum was recorded in December
with 0.0493 g/l, at the average monthly discharge of 3.15 m3/s (q= 7,65 l/s/km2). Thus, the
ratio between the extreme average monthly suspended sediment concentrations is 1:12. At first glance, it can be seen that the values of both, the discharges and the concentration, are significantly higher on the hydrological profile of Ravni than at Brus. The average annual value of the SSC on the more downstream profile, at the average annual
discharge of 6.7 m3/s (q= 14.84 l/s/km2), is 0.0604 g/l. The daily maximum was as high as
1.2927 g/l, and that was even during February, at the discharge of 80.4 m3/s (q= 41.66
l/s/km2), while the daily minimum of the SSC was recorded in June, when it amounted
0.0003 g/l, at the discharge of 1.39 m3/s (q= 3.08 l/s/km2). The ratio between the daily
extremes was 1:4,309.
The average monthly values of the SSC were in the range from 0.067 g/l in May
(Q= 5.35 m3/s; q=11.85 l/s/km2) to 0.1453 g/l which was the amount in February (Q= 18.79
m3/s; q=41.66 l/s/km2), so the ratio between the average montly concentrations was 1:22.
The distribution of specific runoffs according to established classes is given in Figure 1. The comparative analysis of the hydrological profiles shows the dominance of low waters on the upstream profile of Brus: 33.2 % belong to the runoffs up to 3 l/s/km2. The distribution of runoffs on the downstream profile of Ravni has the characteristics of a
normal distribution. The runoffs in the class 10-20 l/s/km2 are dominant, which lasted for
nearly a quarter of the time period. The extreme conditions of runoffs, i.e., the runoffs
greater than 50 l/s/km2 were recorded on the profile of Brus for 10 days, and 15 days at
Ravni.
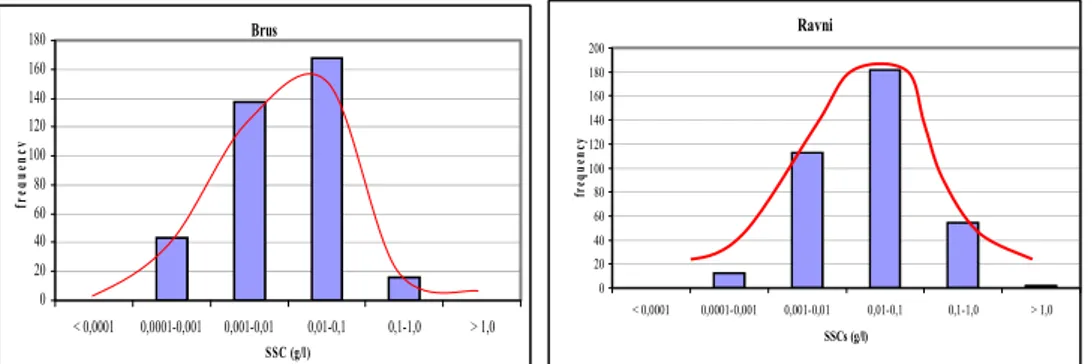
The distribution of suspended sediment concentration is divided into five, that is, six classes (Figure 2). For the most part of the year (46 % of the time at Brus, 50 % of the time at Ravni), the suspended sediment concentrations were in the range from 0.01 to 0.1 g/l. Then, the suspended sediment concentrations in the class from 0.001 to 0.01 g/l were dominant, which lasted for 38 % of the time at the upstream profile, and 31 % at the downstream profile. The dominance of low waters on the profile of Brus reflected in the fact that in this sector, the SSC in the class from 0.0001 to 0.001 g/l was 3.3 times higher than in the more downstream station. On the other hand, two times higher dominance of runoffs in
the classes over 20 l/s/km2 on the downstream profile of Ravni, influenced the three times
greater emergence of the suspended sediment concentrations larger than 0.1 g/l. On this profile, also one case (February 20th) of the suspended sediment concentrations of 1.2927 g/l was recorded.
The total amount of suspended sediment load that was transported in 2010 at the profile of Brus was 3437.3 t, giving a specific suspended sediment load transport of 16.4
t/km2/year. The absolute daily maximum was reached on 20.04.2010., when the calculated
transport was even 225.1 t, at the discharge of 22.7 m3/s (106.6 l/s/km2). The absolute
minimum was measured on 31.08.2010., when only 3 kg/day of the suspended sediment load was transported. The more downstream profile of Ravni covers a larger area, and therefore much greater values of the suspended sediment load transport. For that year,
43,165 t of the suspended sediment load, that is, 95.7 t/km2/year was transported. The daily
amplitudes of the suspended sediment load transport ranged from 3 kg/day to 8,980 t/day.
The minimal values were recorded on 20., 21. and 22.06.2010. at the discharges of 1.39 m3/s
l/s/km2). According to the distinguished classes on the above mentioned profiles (Figure 3), at Brus, in the annual distribution, the load to 1 t (53 % of the time) is dominant, while at Ravni, in this class, there is three times less load. On the other hand, at Ravni, 29 % of the time belongs to the transport which is in the range from 10 to 100 t, which is two times longer period of time than on the upstream profile. Also, the extreme values of the suspended sediment load transport on the downstream profile, more than 100 t/day, lasted much longer. It was recorded 7 such days at Brus, and even 41 days at Ravni.
0,0 5,0 10,0 15,0 20,0 25,0 30,0 35,0
< 3 3-5 5-10 10-20 20-30 30-50 50-100 > 100
q (l/s/k m2)
% f r e q ue nc y Brus Ravni
Figure 1. Distribution of specific runoff (q l/s/km2)
on the hydrological profiles of Brus and Ravni
Brus 0 20 40 60 80 100 120 140 160 180
< 0,0001 0,0001-0,001 0,001-0,01 0,01-0,1 0,1-1,0 > 1,0
SSC (g/l) fr e q ue nc y Ravni 0 20 40 60 80 100 120 140 160 180 200
< 0,0001 0,0001-0,001 0,001-0,01 0,01-0,1 0,1-1,0 > 1,0
SSCs (g/l)
fr
eque
nc
y
Figure 2. Distribution of suspended sediment concentrations (SSC g/l) on the hydrological profiles of Brus and Ravni
Brus 0 50 100 150 200
< 1 1-10 10-100 100-500 > 500
Q s (t)
fr e q ue nc y Ravni 0 50 100 150 200
< 1 1-10 10-100 100-500 > 500
Q s (t)
fr e que n c y
27
onthly ans seasonal distribution of runoffs, suspended sediment concentrations and suspended sediment load transport
Adequate study of the mechanical water erosion involves a comparative assessment of the runoff regime, suspended sediment concentration and suspended sediment load transport. The study of the water regime of rivers, especially the high water phases, gives a seal to that regime, and at the same time is the most important for the regime of the suspended sediment load transport. One of the simple, but also the most transparent ways, is displaying of the data shown by the ratio of the average monthly toward the average annual
values (Živković N., Gavrilović Lj., 2009).
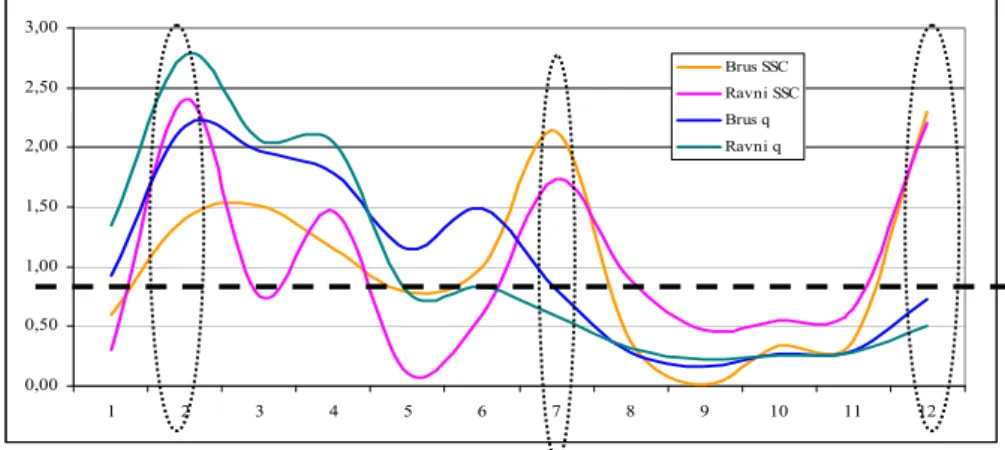
In Figures 4 and 5, the modular values of q, SSC, and Qs are shown. Generally, for both hydrological profiles, the growing branch of the annual runoff distribution begins in October and culminates in February. From February starts declining tendency of runoffs, so in September, it reaches its lowest level. A very important indicator of the water regime is the distribution of monthly runoff values that are above, that is, below the annual average. Thus, the period of time in which the monthly values of the specific runoff are higher than its annual average at Brus 5 months (February-June), and at Ravni 4 months (April-January).
0,00 0,50 1,00 1,50 2,00 2,50 3,00
1 2 3 4 5 6 7 8 9 10 11 12
Brus SSC Ravni SSC Brus q Ravni q
Figure 4. Average monthy suspended sediment concentrations (SSC) and average monthly specific ranoffs (q) shown modularly (av. mon./av. ann.) on the hydrological stations of Brus and Ravni
-1,00 0,00 1,00 2,00 3,00 4,00 5,00 6,00
1 2 3 4 5 6 7 8 9 10 11 12
Brus Qs Ravni Qs
The growing branch of the SSC, generally starts from October and lasts until February, when it takes the character of decline. However, the inter-annual distribution of the suspended sediment concentration does not completely follow the inter-annual distribution of the runoffs. This is especially observed in the distribution of the average monthly suspended sediment concentrations, which values are greater than the average annual. Thus, unlike the distribution of the runoffs characterized by a single period, at the inter-annual distribution of the suspended sediment concentrations this is not the case. On the hydrological profile of Brus, as above-average months, distinguish the following: February, March, April, June, July and December. At the hydrological profile of Ravni, those are February, April, June and December.
As it can be seen in Figure 4, in the area of the Rasina River Basin, there are some specificities in the regime of the suspended sediment concentrations on the distinguished profiles. The characteristic for both hydrological profiles is the existence of extreme single events related to the annual distribution of the SSC. It is the appearance of above-average values of the suspended sediment concentrations in February, July and December. Their extreme value is the consequence of different precipitation, temperature and vegetation conditions.
February 2010. High values of the suspended sediment concentrations measured during February are the consenquence of the combination of precipitation and temperature conditions that occured in the wider area of Serbia. The researches in the area of the Nišava River Basin showed the extent to which the values of the suspended sediment concentration were determined by the advent of high air temperatures during February. So, the connection between the daily idle air temperature and the discharge on one side, and the air temperature and the suspended sediment concentration on the other hand, is described by the exponential
regression with the determination coefficient of 0.79 (Mustafić S. et al., 2013). Average
monthly air temperature higher than 1 during January and February in the station of Brus
(absolute maximal daily temperature of 17.2 recorded on Februaty 20th), as well as the
amount of precipitation of 52.6 mm (48 % larger than the fifty years' average), caused the extremely high daily suspended sediment concentrations.
Јuly 2010. According to all characteristics of the monthly regimes of precipitation
29
December 2010. Although the monthly amount of precipitation recorded in this
month at the station of Brus was below the long-term average, in the mountainous hinterland in December excreted 80.7 mm of precipitation (which was about 18 % higher value than the average) for 19 precipitation days, of which two days were with the precipitation of 10-12 mm. The average monthly air temperature above zero, with high maximum daily
temperatures (08.12.2010. the maximal daily temperature was as high as 20 oC at the station
of Brus and 8.2 oC at the station of Kopaonik) caused the rapid melting of snow cover and
the occurrence of high discharges. Taking into account the state of the vegetation cover and the nakedness of the substrate and the high values of the terrain slope, the occurrence of high discharges caused the emergence of high suspended sediment concentrations.
Correspondent with the specific runoffs and the corresponding suspended sediment concentrations, generally the inter-annual distribution of the suspended sediment load transport (Qs) shows a certain regularity (Figure 5). The growing branch of the annual distribution of the suspended sediment load transport begins in late summer and early autumn, i.e., in October. The line of a growing trend reaches its maximum in late winter and early spring. In particular, in 2010, on both hydrological profiles, it reached a maximum in February, wherein Qs was 5.4 times (profile of Ravni), that is, 3 times (profile of Brus) higher than the annual average. The declining branch of the annual distribution Qs starts from March and reaches its minimum in September, when the suspended sediment load transport equals the annual average. Its duration at both measuring points is 7 months. However, in the annual distribution of Qs, the above average values are differently represented on the hydrological profiles of Brus and Ravni. So, at Brus, a single period from February to July can be noticed (with the exception of May), as well as December with values that are above the annual average. During these six months, 90.7 % of the annual amount of the suspended sediment load was transported. On the other hand, at the hydrological station of Ravni, only two months (February and April) recorded the above average values, while during this period 75 % of the annual suspended sediment load was transported.
The suspended sediment load transport determined according to the season is given in Table 5. From the enclosed, it can be concluded that on both hydrological profiles, the largest part of the annual transport is realized during the winter, and that is 38.1 % on the profile of Brus and even 50.3 % on the downstream profile of Ravni. The spring follows, during which approximately the same amount of the load is transported on both hydrological profiles. However, the biggest difference is during the summer. In fact, in the annual distribution at the upstream profile, two times more of the suspended sediment load is transported than in the downstream part. The big difference between the profiles is also observed in the value of the specific suspended sediment load transport in the scope of all distinguished seasons. At the downstream station, the specific suspended sediment load transport is greater in comparison with the upstream profile from 3 to 8.3 times.
The influence of all direct and indirect factors that determine the suspended sediment load transport, and which are incorporated in the notion of the season, sum up in the fact that they are primarily determined by the amount of runoff water. The relation between specific runoffs and suspended sediment concentration, and specific runoffs and suspended sediment load transport at the level of the seasons are presented in Figures 6 and 7. In the analysis process, the average decade values of the q, SSC and Qs were taken into
account. The upper part of the Rasina River Basin, according to the suspended sediment
Brus
0,000 0,001 0,010 0,100 1,000 10,000
1,0 10,0 100,0
q (l/s/km2)
Q
s (t/
k
m
2 ) Winter
Spring Summer Autumn
Ravni
0,00 0,01 0,10 1,00 10,00 100,00
1,0 10,0 100,0
q (l/s/km2)
Q
s (t/
k
m
2) Winter
Spring Summer Aut umn
Ravni
0,0001 0,0010 0,0100 0,1000 1,0000
1,0 10,0 100,0
q (l/s/km2)
S
S
C
(
g
/l)
Winter
Spring
Summer Autumn
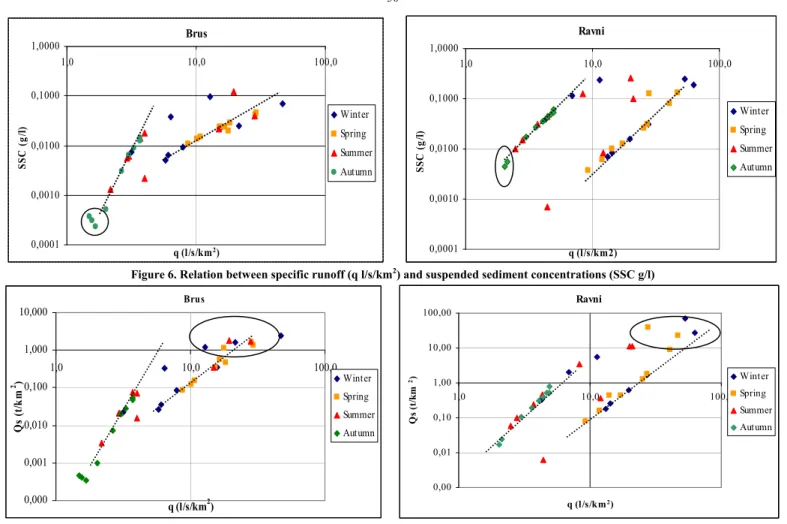
Figure 6. Relation between specific runoff (q l/s/km2) and suspended sediment concentrations (SSC g/l)
Brus
0,0001 0,0010 0,0100 0,1000 1,0000
1,0 10,0 100,0
q (l/s/km2)
SSC
(
g
/l
)
Autumn Summer Winter
31
Figure 7. Relation between specific runoff (q l/s/km2) and specific suspended sediment load transport (Qss t/km2)
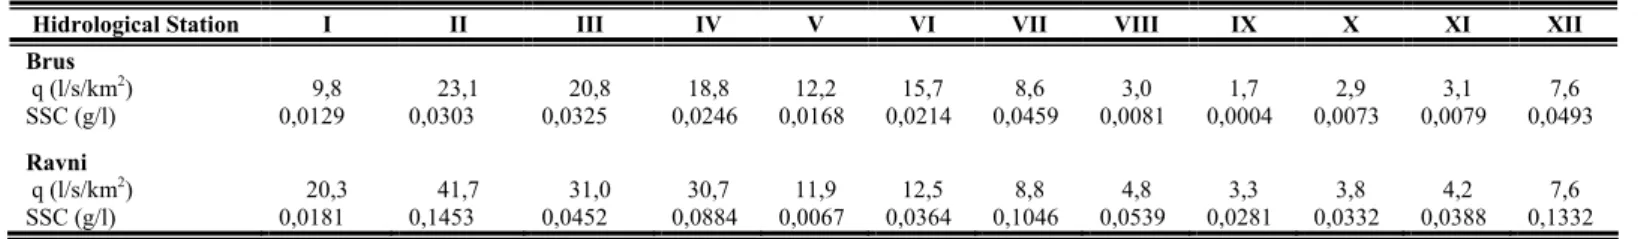
ble 1. Average monthly specific runoff (q) and average monthly suspended sediment concentration (SSC) on the hydrological profiles of Brus and Ravni in 2010
Hidrological Station I II III IV V VI VII VIII IX X XI XII
Brus
q (l/s/km2) 9,8 23,1 20,8 18,8 12,2 15,7 8,6 3,0 1,7 2,9 3,1 7,6
SSC (g/l) 0,0129 0,0303 0,0325 0,0246 0,0168 0,0214 0,0459 0,0081 0,0004 0,0073 0,0079 0,0493
Ravni
q (l/s/km2) 20,3 41,7 31,0 30,7 11,9 12,5 8,8 4,8 3,3 3,8 4,2 7,6
SSC (g/l) 0,0181 0,1453 0,0452 0,0884 0,0067 0,0364 0,1046 0,0539 0,0281 0,0332 0,0388 0,1332
ble 2. Monthly suspended sediment load transport (Qs) and specific suspended sediment load transport (Qss) on the hydrological profiles of Brus and Ravni in 2010
Hidrological Station I II III IV V VI VII VIII IX X XI XII
Brus
Qs (t) 96,9 875,6 461,8 604,0 170,1 436,3 403,0 19,2 0,4 16,1 16,8 337,2
Qss (t/km2) 0,45 4,11 2,17 2,84 0,80 2,05 1,89 0,09 0,002 0,08 0,08 1,58
Ravni
Qs (t) 518,7 19567,6 2409,2 12773,5 138,8 2338,3 2432,5 767,5 188,5 188,0 207,8 1634,9
Qss (t/km2) 1,15 43,39 5,34 28,32 0,31 5,18 5,39 1,70 0,42 0,42 0,46 3,63
ble 3. Monthly and annual amount of precipitation (X) in the stations of Kopaonik and Brus
Station I II III IV V VI VII VIII IX X XI XII Annual
Kopaonik
X (mm) 1961/2010 63,3 57,9 68,1 85,1 114,2 121,5 91,9 87,2 87,8 64,6 72,9 68,1 982,6
X (mm) 2010 86,1 81,1 94,4 140,9 131,0 172,9 48,9 53,0 53,7 86,9 69,2 80,7 1098,8
Brus
X (mm) 1961/2010 41,1 35,4 42,4 52,6 77,1 78,9 63,8 52,4 50,8 46,0 56,2 49,7 646,3
ble 4. Regressiom model of the exponential type at the level of connection SSC = f(q)
HS Period Regression model R2
Brus winter-spring y = 0,0075e 0,0627x 0,91
Ravni winter-spring y = 0,0025e 0,0923x 0,83
Brus summer-autumn y = 0,0023e 2,3477x 0,98
Ravni summer-autumn y = 0,001e 0,8481x 0,96
ble 5. Seasonal distribution of suspended sediment load transport in 2010
HS Winter Spring Summer Autumn Annual Denudation rate (mm/yr)
Brus
Qs (t) 1309,7 1235,9 858,4 33,3 3437,3 0,042
Qss (t/km2) 6,1 5,8 4,0 0,2 16,4
% Qs 38,1 36,0 25,0 1,0 100
Ravni
Qs (t) 21721,15 15321,54 5538,36 584,21 43165,3 0,254
Qss (t/km2) 48,16 33,97 12,28 1,30 95,7
% Qs 50,3 35,5 12,8 1,4 100
Grouping of data is defined by the regression model of the exponential type at the level of the connection SSC = f (q) (Table 4), which is characterized by a high coefficient of determination, that for the winter-spring season amounts 0.83 (profile of Ravni) and 0.91 (profile of Brus); and for the summer-autumn 0.98, i.e., 0.96 respectively. From the accompanying Figures and given exponential model, it is noticed that the polarization of the seasons in two seasons is more pronounced on the downstream profile, as indicated by the slope of the trend line.
In the Figure, a different position of the extreme seasonal values of the SSC and Qs for approximately the same specific runoffs on the given profiles is also observed. That is why the extreme autumn SSC for the discharges of 1.5- 2 l/s/km2 on the hydrological profile of Brus are below the value of 0.0005 g/l, while at the hydrological profile of Ravni, for the same specific discharges, the value of the SSC is approximately 0.05 g/l , i.e., ten times higher. For the same values of the specific runoffs, also the suspended sediment load transport records big differencs. So, at Brus, approximately 0.1 t of the suspended sediment load is transported, and at Ravni about 10 t.
On the other hand, the polarization of the extreme maximal seasonal SSC and Qs is more distinguished at the downstream profile, in terms of their determination to cold-wet and warm-dry period. In fact, the maximal values of the specific sediment load transport Qs
for the specific runoff values higher than 10 l/s/km2 at the profile of Brus are in the quadrant
of 1-10 t/km2, where in that range, the extreme values of all seasons, except the autumn
season, are represented. However, the extreme seasonal values of the specific suspended sediment load transport Qs at the hydrological profile of Ravni are defined by the quadrant
of 10-100 t/km2, but only occur in the winter and spring season, while the maximal summer
values are exactly on the limit of 10 t/km2.
33
Conclusion
The total amount of the suspended sediment load that is transported in 2010 at the profile of Brus, was 3,437.3 t, giving a specific suspended sediment load transport of 16.4
t/km2/year. At the downstream profile of Ravni, 43,165 t of the suspended sediment load
was transported, that is, 95.7 t/km2/year. The big difference between the profiles is also
observed in the value of the specific suspended sediment load transport within all distinguished seasons. At the downstream station, the specific suspended sediment load transport is greater in comparison with the upstream profile from 3 times during the summer to 8.3 times during the winter.
The basin as a whole is characterized by the exsistance of two seasons, which, by their characteristics in the suspended sediment load transport, represent the extreme variants: during the winter-spring season, from 74 to 85.8 % of the total load was transported, and during the summer-autumn season from 14.2 to 26 %. The polarization of the seasons in two seasons, is more pronounced on the downstream profile of Ravni. The average rate of reduction of the topographic surface up to Brus is 0.042 mm/year, while to the profile of Ravni is significantly higher (0.254 mm/year), which is the consenquence of large distribution of the flysch rocks.
References
Bajat, B., Pejović, M., Luković, J., Manojlović, P., Ducić, V. and Mustafić, S. (2012). Mapping average annual precipitation in Serbia (1961-1990) by regression kriging. Theoretical and Applied Climatology, 112 (2), 1-13, DOI 10.1007/s00704-012-0702-2
Belanović, S., Beloica, Ј., Perović, V., Alnaass, N., Knežević, M. and Kadović, R. (2012). Current state and threats of soil resources in the catchment of the Rasina above the "Celije" water reservoir. International Conference On `Land Conservation`-Landcon 1209: Sustainable Land Management And Climate Changes, September 17-21,2012, Danube Region, Republic of Serbia, 28-28
Gregory, K.J. and Walling, D.E. (1973). Drainage Basin Form and Processes - A Geomorphological Approach. Edward Arnold, London, UK.
Kadović, R., Belanović, S., Kostadinov, S., Beloica J., Todosijević M. (2012). The Influence of soil organic carbon on soil erodibility of forest soils in the catchment of the Rasina. International Conference On `Land Conservation`- Landcon 1209: Sustainable Land Management And Climate Changes, September 17-21,2012, Danube Region, Republic of Serbia, 48-48
Kostadinov, S., Zlatić, M., Dragićević, S., Novković, I., Košanin, O., Borisavljević, A., Lakićević, M. and Mladjan, D. (2014). Anthropogenic Influence On Erosion Intensity Changes In The Rasina River Watershed - Central Serbia. Fresenius Environmental Bulletin, 23 (1),
Loczy D. (2012). Geomorphological Impacts of ExtrmeWeather. In (ed. Loczy D), ''Geomorphological Impacts off Ekstreme Weather. Case Studies from Central and Eastern Europe''. Springer
Manojlović, P. and Živković N., (1997). The Map of Runoff in Serbia. Collection of the papers Faculty of Geography Universitu of Belgrade, 48, 15-25
anojlović, P., Srejić, M., Djokić, I., Mustafić, S. and Dobrosavljević, T. (2013). Altitudinal Zonation Of Runoff In The Rasina River Basin. Glasnik Srpskog geografskog društva, 93 (2), 41-54
Mustafić, S., Kostadinov, S., Manojlović, P. (2008). Risk of Artificial lake “Zavoj” to Processes of Erosion- methodological, knowing and protecting aspect. Glasnik Srpskog geografskog društva, 88 (1), 29-42
Mustafić, S., Manojlović P. and Milošević M. (2013). Extreme Erosion Rates in the Nisava River Basin (Eastern Serbia) in 2010. In (ed. Loczy D), ''Geomorphological Impacts off Ekstreme Weather. Case Studies from Central and Eastern Europe''. Springer, 171-187
Živković N. and Andjelković G. (2004). Altitude Precipitation Gradient in Serbia. Glasnik Srpskog geografskog društva, 84 (2), 31-36
Њ 2010.
1*
, Ј 1
, 1
1 Б - , 3/3, Б , ј
:
'' " 2010. .
.
2010. 3437,3 ,
16,4 t/km2/ . 43165 t , 95,7 t/km2/ .
. - 74-85,8 %
, - ђ 14,2-26 %.
: , , , ,
.
.
,
(Mustafić S., Kostadinov S.,
Manojlović P., 2008).
ђ :
, , .
" " ,
ђ
( anojlović P et. al., 2013),
1971-2011. (Kostadinov S. et al., 2014),
(Belanović S. et. al., 2012, Kadović R. et al., 2012).
. 2010.
ђ
(Loczy D., 2012),
ђ
.
-.
1054 km2, " " 611,3 km2.
744 mm, 739 mm (Bajat
et al. 2012).
(30,1 %), 12,3 % .
27,1 %, 11,6 %
. Ј 23,8 %, 19,5 %
.
77 mm/100 m (Živković N., Anđjelković G.,2004).
35
'' '' (7,06 l/s/km2, Manojlović P., Živković N., 1997 )
9 l/s/km2. 3 l/s/km2
, 27,9 l/s/km2
. , 65,3 %
, 700 m ( anojlović P et. al., 2013).
41 %,
ђ 300-900 m.
39,6 % .
, 39 % , 42,8 %
. , 16,5 %
, (3,5 %) ( anojlović P
et. al., 2013).
ђ
.
2010. . ђ
Sartorius,
- 105 C
ђ . Watman 359.
ђ
.
,
,
( , 2010).
,
(SSC) 0,0215 g/l
2,24 m3/s (q= 10,6 l/s/km2). SSC 0,0001
g/l ђ .
.
SSC 0,2726 g/l
. ђ 1:2726.
, .
- 0,0004 g/l,
0,37 m3/s (q= 1,73 l/s/km2). 0,0493 g/l
3,15 m3/s (q= 7,65 l/s/km2). ђ
1:12.
.
SSC , 6,7 m3/s
, 80,4 m3/s (q= 41,66 l/s/km2),
SSC , 0,0003 g/l, 1,39 m3/s (q=
3,08 l/s/km2). ђ 1:4309.
SSC 0,067 g/l
(Q= 5,35 m3/s; q=11,85 l/s/km2) do 0,1453 g/l (Q= 18,79
m3/s; q=41,66 l/s/km2), ђ
1:22.
ђ
1.
: 33,2 % 3 l/s/km2.
.
10-20 l/s/km2, .
, . 50 l/s/km2
10 , 15 .
,
( 2). (46 % , 50
% )
0,01-0,1 g/l.. 0,001-0,01 g/l,
38 % 31 % .
SSC 0,0001-0,001
g/l 3,3 . ,
20 l/s/km2
0,1 g/l.
(20. )
1,2927 g/l.
2010. 3437,3 , 16,4
t/km2/ . 20.04.
225,1 t, 22,7 m3/s (106,6 l/s/km2).
31.08. 3 kg/ . ,
.
43165 t , 95,7 t/km2/ .
3 kg/ 8980
t/dan. 20,. 21. 22. 1,39
m3/s (3,08 l/s/km2), 20.02. 80,47 m3/s, (178,3 l/s/km2).
( 3),
1 t (53 % ),
3 . , 29 %
10-100 t,
. ђ , ,
100 t/ , . 7 ,
41 .
1. (q l/s/km2)
.
2. (SSC g/l)
.
3. (Qs t)
37
,
,
. ,
, . Ј
, ,
(Živković N.,
Gavrilović Lj., 2009).
4. 5. q, SSC Qs.
,
.
, .
,
.
5 (
-), 4 ( - ).
4. (SSC)
(q) ( . / . ) .
5. (Qs) ( . . / . )
.
SSC, , ,
. ђ ,
.
. ,
, .
, , , , .
, , .
4 ,
. ,
ђ SSC.
, ј .
, .
2010. .
(
.
. ђ
,
,
0,79 (Mustafić S. et al., 2013).
1
52,6 mm (48 % ) .
Ј 2010. .
, SSC .
,
(48,9 mm) (21,9 mm), 1,9,
2,9 . ђ , 10 mm
, ,
. ђ ,
ђ ,
ђ
.
SSC 0,2726 g/l 6. , 0,2655 g/l
,
,
. SSC
28. .
28 mm , 24 % ;
54 mm, . 50,3 % . ,
2. 11 mm
, ,
.
SSC .
2010. .
, ђ
80,7 mm ( 18 %
) 19 ,
10-12 mm. ,
(08.12. 20 ,
8,2 )
.
,
. ,
(Qs) ђ ( 5).
, .
.
. , 2010.
, Qs 5,4 ( ), 3
( ) . O Qs
,
. 7
. ђ , Qs
.
( ),
. 6
90,7 % . ,
( )
39
5.
, 38,1 % 50,3 %
.
. ђ ,
. ,
. ђ
.
3 8,3 .
1. (q)
(SSC) 2010.
2. (Qs)
(Qss) 2010. .
3 . (X) .
4. SSC = f(q)
5. 2010.
, ш ,
. ђ
,
6 7.
q, SSC i Qs.
ш ј :
( - ) ( -ј ) .
SSC = f(q) ( 4),
, - 0,83 (
), 0,91 ( ); - 0,98, . 0,96 .
ј
ш ј ,
.
ђ ,
SSC Qs .
ј SSC 1,5-2 l/s/km2
0,0005 g/l, SSC
0,05 g/l, . .
.
0,1 t , 10 t.
, SSC Qs
,
- . ,
Qs 10 l/s/km2
1-10 t/km2,
. ђ ,
t/km2, , 10 t/km2.
Gregory Walling, 1973. 0,254
mm/ , 0,042
mm/ .
2010. 3437,3 , 16,4
t/km2/ . 43165 t ,
95,7 t/km2/ . ђ
.
3
8,3 .
,
:
74-85,8 % ,
-ђ 14,2-26 %.
.
0,042 mm/ , (0,254 mm/ ),
.