Molecular and Morphological Analyses
Reveal Phylogenetic Relationships of
Stingrays Focusing on the Family Dasyatidae
(Myliobatiformes)
Kean Chong Lim1, Phaik-Eem Lim1,2, Ving Ching Chong1,2*, Kar-Hoe Loh2
1Institute of Biological Sciences, University of Malaya, Kuala Lumpur, Malaysia,2Institute of Ocean and Earth Sciences, University of Malaya, Kuala Lumpur, Malaysia
Abstract
Elucidating the phylogenetic relationships of the current but problematic Dasyatidae (Order Myliobatiformes) was the first priority of the current study. Here, we studied three molecular gene markers of 43 species (COI gene), 33 species (ND2 gene) and 34 species (RAG1 gene) of stingrays to draft out the phylogenetic tree of the order. Nine character states were identified and used to confirm the molecularly constructed phylogenetic trees. Eight or more clades (at different hierarchical level) were identified for COI, ND2 and RAG1 genes in the Myliobatiformes including four clades containing members of the present Dasyatidae, thus rendering the latter non-monophyletic. The uncorrected p-distance between these four
‘Dasytidae’clades when compared to the distance between formally known families con-firmed that these four clades should be elevated to four separate families. We suggest a re-vision of the present classification, retaining the Dasyatidae (DasyatisandTaeniurops species) but adding three new families namely, Neotrygonidae (NeotrygonandTaeniura species), Himanturidae (Himanturaspecies) and Pastinachidae (Pastinachusspecies). Our result indicated the need to further review the classification ofDasyatis microps. By resolv-ing the non-monophyletic problem, the suite of nine character states enables the natural classification of the Myliobatiformes into at least thirteen families based on morphology.
Introduction
The family Dasyatidae in the Order Myliobatiformes is one of the biggest families of batoid fishes. According to Carpenter & Niem [1], the body of members of the dasyatids is character-ized by a large, oval, circular or rhomboidal disc usually covered with denticles, thorns and tu-bercles on the dorsal surface and sometimes on the tail. Given the large number of species described in the Dasyatidae, the classification and status of the described species are still in flux owing to taxonomic uncertainties especially at the family level. The few comprehensive studies on the classification within the Dasyatidae are based either on morphology, including their
OPEN ACCESS
Citation:Lim KC, Lim P-E, Chong VC, Loh K-H (2015) Molecular and Morphological Analyses Reveal Phylogenetic Relationships of Stingrays Focusing on the Family Dasyatidae (Myliobatiformes). PLoS ONE 10(4): e0120518. doi:10.1371/journal.pone.0120518
Academic Editor:Ulrike Gertrud Munderloh, University of Minnesota, UNITED STATES
Received:July 24, 2014
Accepted:January 29, 2015
Published:April 13, 2015
Copyright:© 2015 Lim et al. This is an open access article distributed under the terms of theCreative Commons Attribution License, which permits unrestricted use, distribution, and reproduction in any medium, provided the original author and source are credited.
Data Availability Statement:All relevant data are within the paper and its Supporting Information files.
Funding:We thank Japan International Centre for Agricultural Sciences (JIRCAS) 57-02-03-1005, UM Research Grant (UMRG) RG191-121SUS and UM IPPP Grant-PG103-2012B for the financial support of the study. The funders had no role in study design, data collection and analysis, decision to publish, or preparation of the manuscript.
external morphological structures, squamation, tooth root vascularization and structure, lateral line canal, skeletal structure and cephalic and branchial musculature [2], or molecular markers including mtGenome, RAG1 and SCFD2 [3,4]. Nevertheless, these approaches fail to classify the Dasyatidae such as the species ofHimanturaandPastinachusinto defined clusters since some still remain asincertae sedisor uncertain placements. The binary differentiation based on the absence and presence of placoid scales (or more often terms such as thorns and denticles) as adopted by McEachran & Aschliman [2] is thought to be too general because there are in-stances of variable patterns of thorns and denticles among the dasyatids. On the other hand, some distinct characters such as the ventral tail fold and body and tail pigmentations, not in-cluded in McEachran & Aschliman [2], may be used to resolve the taxonomic uncertainties be-tweenHimanturaandPastinachus[5].
DNA barcoding using the Cytochrome Oxidase I (COI) gene has been widely used to identi-fy fishes and other organisms at the species level [6–10]. In addition, COI gene also enables re-searchers to separate phylogeographically distinct populations within species [6]. Another mitochondrial gene, NADH dehydrogenase 2 (ND2), has also been used to construct a phylo-genetic tree of sharks and rays with high taxonomic certainty [11]. Thus, the present search of the nucleotides sequences available in NCBI GenBank has indicated that both COI and ND2 genes constitute the highest number of sequences among batoids. The search also found two available nuclear DNA genes for batoids, Sec1 Family Domain-Containing Protein 2 (SCFD2) and Recombination Activating Gene 1 (RAG1), but only the latter is available for a reasonable number of batoid species to be of use in a phylogenetic analysis. Given the availability of these sequences, a molecular approach based on COI, ND2 and RAG1 genes may be useful to evalu-ate the batoids at the family level, and resolve the uncertainties that clouded the current taxon-omy of the Dasyatidae.
The aims of the present study were therefore to elucidate the phylogenetic relationships of the Dasyatidae stingrays using COI, ND2 and RAG1 genes, and to re-examine the morphologi-cal characters used by Lastet al. [5] for species differentiation.
Methods
Ethics Statement
No specific permits were required for the described field studies. The stingrays were collected from fish markets and none of the collected specimens were in‘Endangered’category of IUCN Red List. The specimens collected at fish market were dead upon purchasing.
Sampling
Stingray samples belonging to the Order Myliobatiformes were collected from fish markets in Sandakan, Tawau, Semporna and Kuala Selangor, Malaysia. Twenty-two species of stingrays which included 16 species of dasyatids were identified based on Lastet al. [5]. Three to five fin clips or tissue samples from each species were taken and immediately put into 99.8% ethanol for genetical/DNA analysis. All voucher specimens of small individuals were kept in B201 En-vironmental Laboratory, Institute of Postgraduate Studies, University of Malaya, as reference collections.
Laboratory procedures
DNA was extracted using G-spin Total DNA Extraction Mini Kit (iNtRON Biotechnology, Inc, Korea). Both COI and ND2 genes were amplified by polymerase chain reaction (PCR) using the universal primer FishF2 (5’TCG ACT AAT CAT AAA GAT ATC GGC AC3’) and FishR2 (5’ACT TCA GGG TGA CCG AAG AAT CAG AA 3’) for COI gene [7] and ILEM (5’ AAG GAG CAG TTT GAT AGA GT 3’) and ASNM (5’AAC GCT TAG CTG TTA ATT AA 3’) for ND2 gene [11]. The PCR cocktail containing 2μL of 10x PCR buffer, 2μL of dNTPs mix-ture (2.5mM each), 1μL of 10pmol primer (both primers), 1.0 unit ofTaqDNA polymerase, 50pg to 1.0μg DNA templates, and UHQ water was added to a final volume of 20μL. The PCR cycles for COI gene comprised of 4 min initial denaturation at 94°C, followed by 30 cycles of 1 min at 94°C, 0.45 min at 50°C, 1 min at 72°C and with final extension of 10 min at 72°C. For ND2, the modification on the PCR cycles included 30 cycles of 30 sec at 94°C, 30 sec at 50°C, 1min at 72°C and with final extension of 10 min at 72°C. The PCR products were examined using 1% agarose in TAE buffer. All samples that showed good PCR amplifications were sent for sequencing after purification using LaboPass Gel & PCR Purification Kit (Cosmo Genetech, South Korea). The obtained sequencing results were preliminary checked for confirmation of species using Blastn tool of NCBI. Sequences used for the phylogenetic analysis were submitted to GenBank database with accession numbers as inS1 Table.
Sequences analysis
DNA sequences were aligned and trimmed using ClustalX [12] and BioEdit software [13] re-spectively. The aligned sequences were subjected to the best model search for Bayesian Infer-ence (BI) and Maximum Likelihood (ML) analyses using Kakusan v. 3 [14]. The generated files were subsequently used for phylogenetic trees construction using Mr Bayes for BI [15] and Treefinder for ML [16]. The selected model for ML was J1 + Gamma (COI gene), J2 + Gamma (ND2 gene) and J1 + Gamma (RAG1 gene) based on Akaike Information Criterion (AIC). ML analyses were performed with 1000 bootstrap replicates. The selected model for BI was HKY85 + Gamma (COI, ND2 and RAG1 genes) based on Bayesian Information Criterion (BIC). Bayesian analyses were initiated with a random starting tree and two parallel runs, each of which consisted of running four chains of Markov chain Monte Carlo (MCMC) iterations for 2000000 generations. The trees in each chain were sampled every 200th generation. Likelihood values for all post-analysis trees and parameters were evaluated for convergence and burn-in using the“sump”command in MrBayes and 200 trees were discarded as burn-in (where the likelihood values were stabilized prior before the burn in), and the remaining trees after burn-in were used to calculate posterior probabilities usburn-ing the“sumt”command.
The resulting ML and BI phylogenetic trees were processed via Figtree v1.3.1 (http://tree. bio.ed.ac.uk/software/figtree/). In the phylogenetic analyses, the sharks,Carcharhinus plum-beus(EU398639 for COI, JQ518632 for ND2 and AY462152 for RAG1) andCarcharhinus amblyrhynchos(EF609308 for COI and JQ519095 for ND2) from GenBank were used as out-groups. For all genes, phylograms were constructed if feasible, if not, a cladogram. Some other sequences of same or closely related species of stingrays (in the Order Myliobatiformes) from GenBank were also used in the tree construction for comparison. The accession number of se-quences from NCBI Genbank and other information regarding number and percentage of spe-cies sampled for this study are given inS2 Table. Uncorrected p-distance was calculated using PAUP4.0b10 software [17] to observe the genetic divergence between stingray clusters.
Character identification
selected and modified according to the findings from the present study. Selection of representa-tive species from all families within Order Myliobatiformes was based on the species descrip-tions available in the literatures (S2 Table) [1,2,5,18–24]. The selected morphological characters used in the present study included body or disc shape, body thorns and denticles, head position and elevation, snout or rostral fin form, gill openings, tail types, tail colour pat-tern, ventral tail fold and caudal fin. Nine character states were constructed. Each state was as-signed numeric codes (0–3) to define a set of distinguishing morphological characters. The character score of each representative species was recorded based on the available descriptions of published works [1,5,18–24]. The scored character states were then used to construct a character matrix. Both morphology (based on the character matrix) and molecular information (based on the constructed phylogenetic tree) were then combined to obtain a robust dichoto-mous key that attempts to improve the current classification key to the families of the Mylioba-tiformes stingrays [1].
To test the robustness and functionality of the constructed classification key, 17 other spe-cies not used in the construction of the character matrix were sampled from the Dasyatidae [5, 18,20–23,25,26]. The required character states were then extracted from these species to form the test character matrix which was then used to test the accuracy of the classification key.
Morphometric analysis
Morphometric data of 27 characters that were used to describe members of the Dasyatidae (in-cluding proposed new families) were compiled from various references [21,27–31] including new measurements from the present sampling (seeS4 Table). The available morphometric data included those from 19 species. The percentage to disc width (DW) of each measurement for each family was calculated to provide the maximum, minimum, mean and standard devia-tion of the measurement. These values were compared between families to aid in their classification.
Fifteen morphometric characters that were present in the four examined‘dasyatid’families were further analysed using forward stepwise discriminant analysis (SDFA) in the software Sta-tistica version 8.0 [32]. The SFDA extracts the minimum number of morphometric characters that will effectively distinguish the families. Default tolerance setting was retained at 0.10, with F to enter = 3 and F to exit = 2.
Results
Phylogenetic analysis
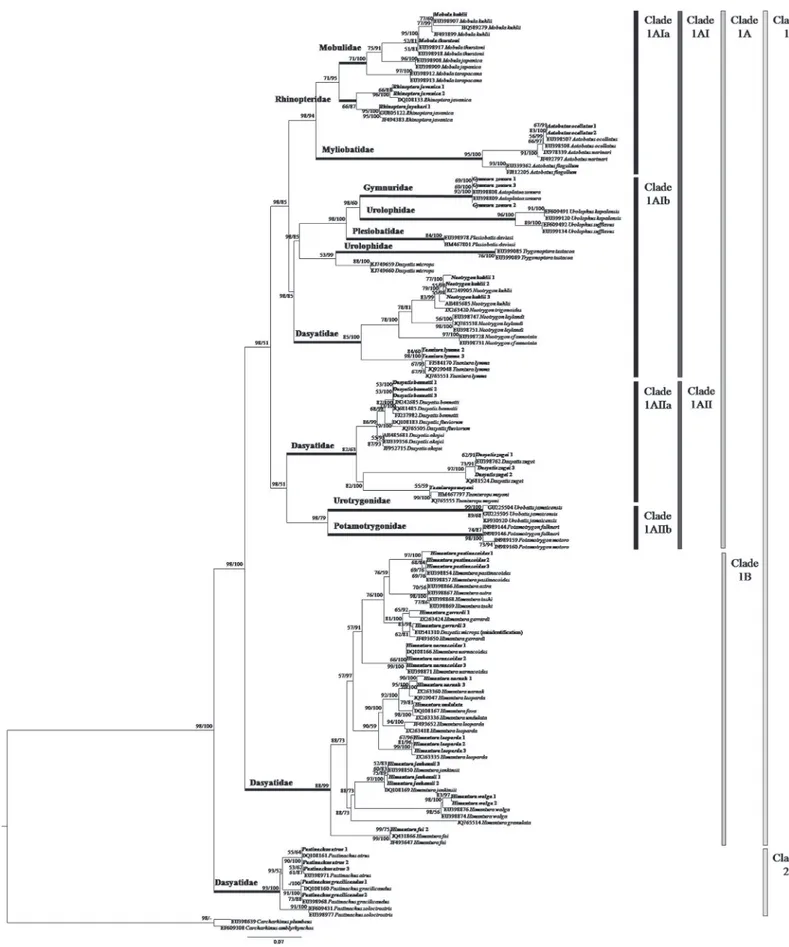
A total of 47 tissue samples belonging to 5 families and 22 species of stingrays were used for the COI analysis. For ND2 gene, the analysis aimed to clarify the current‘Dasyatidae’at the famil-ial level which involved 13 tissue samples from four possible clusters within the family. Anoth-er 42 species (COI gene) and 32 species (ND2 gene) of similar or closely related species within the Order Myliobatiformes were included in the phylogenetic analysis (Figs1&2). As for RAG1 gene, the phylogenetic analysis was based on NCBI Genbank sequences of 34 species of stingrays within the Order Myliobatiformes (Fig 3). As shown in all phylogenetic trees, families of the stingrays were not monophyletic (Figs1and2&3).
Urolophidae, Plesiobatidae, Urotrygonidae, Potamotrygonidae, Dasyatidae (Neotrygon, Tae-niura,DasyatisandTaeniuropsspecies)) and Clade 1B (Himanturaspecies) with high and full support bootstrap value (98/100%). Clade 1A was further subdivided into Clade 1AI (Mylioba-tidae, Gymnuridae, Mobulidae, Rhinopteridae, Urolophidae, Plesioba(Mylioba-tidae, and Dasyatidae
(NeotrygonandTaeniuraspecies)) and Clade 1AII (Urotrygonidae, Potamotrygonidae, Dasya-tisandTaeniuropsspecies) with high and weak support bootstrap value (98/51%). Clade 1AI was subdivided into Clade 1AIa (Myliobatidae, Mobulidae, and Rhinopteridae) and Clade 1AIb (Gymnuridae, Urolophidae, Plesiobatidae,NeotrygonandTaeniuraspecies) with high and moderate support bootstrap value (98/85%). Clade 1AII was further subdivided into Clade 1AIIa (DasyatisandTaeniuropsspecies) and Clade 1AIIb (Urotrygonidae and Potamotrygoni-dae) with high and weak support bootstrap value (98/51%).
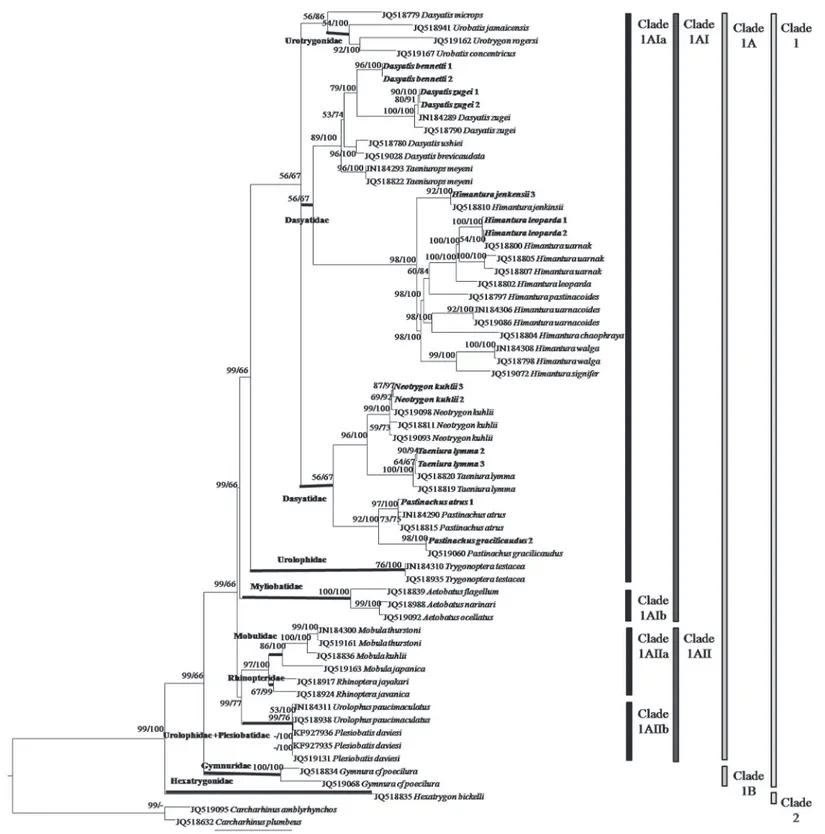
The ML and BI combined tree for ND2 gene (Fig 2) showed that the Myliobatiformes mem-bers could be divided into two clades: Clade 1 (Mobulidae, Myliobatidae, Rhinopteridae, Ple-siobatidae, Urolophidae, Urotrygonidae, Gymnuridae, and Dasyatidae) and Clade 2
(Hexatrygonidae), had high and full support bootstrap values (ML/BI = 99/100%). Clade 1 was subdivided into Clade 1A (Mobulidae, Myliobatidae, Rhinopteridae, Plesiobatidae, Urolophi-dae, UrotrygoniUrolophi-dae, and Dasyatidae) and Clade 1B (Gymnuridae), with high and weak support bootstrap values (99/66%). Clade 1A was further subdivided into Clade 1AI (Myliobatidae, Urotrygonidae, Urolophidae (Trygonopteraspecies) and Dasyatidae) and Clade 1AII (Mobuli-dae, Rhinopteri(Mobuli-dae, Plesiobatidae and Urolophidae (Urolophusspecies) with high and weak support bootstrap values (99/66%). Clade 1AI was then subdivided into Clade 1AIa (Urotrygo-nidae, Urolophidae (Trygonopteraspecies), and Dasyatidae) and Clade 1AIb (Myliobatidae) with high and weak support bootstrap values (99/66%).
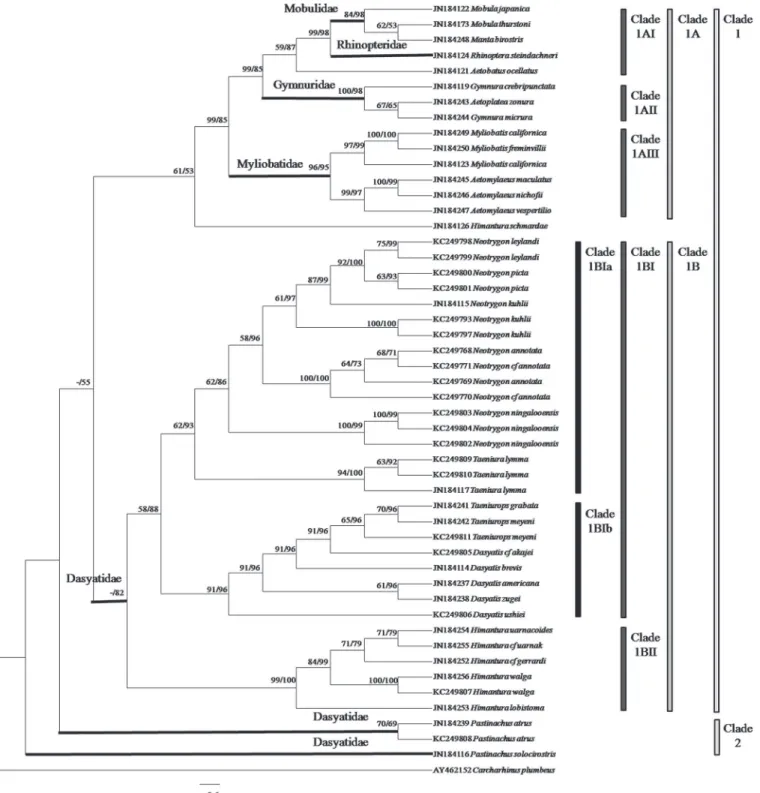
For RAG1 gene, a cladogram was used since the distances among the taxa were small result-ing in a crowded phylogenetic tree (not shown). The ML and BI combined tree for RAG1 gene (Fig 3) showed that the Myliobatiformes members could be divided into two major clades: Clade 1 (Mobulidae, Rhinopteridae, Gymnuridae, Myliobatidae and Dasyatidae (Neotrygon, Taeniura,Dasyatis,Taeniurops and Himanturaspecies)) and Clade 2 (Pastinachus). Clade 1 was divided into two subclades: Clade 1A (Mobulidae, Rhinopteridae, Gymnuridae and Mylio-batidae) and Clade 1B (Neotrygon,Taeniura,Dasyatis,TaeniuropsandHimanturaspecies) with slightly weak support bootstrap value (-/55%). Clade 1A was further subdivided into Clade 1AI (Mobulidae and Rhinopteridae), Clade 1AII (Gymnuridae) and Clade 1AIII (Mylio-batidae) with high support bootstrap value (99/85%). Clade 1B was subdivided into Clade 1BI (Neotrygon,Taeniura,DasyatisandTaeniuropsspecies) and Clade 1BII (Himanturaspecies) with high support bootstrap value (-/82%). Lastly, Clade 1BI was divided into two subclades: Clade 1BIa (NeotrygonandTaeniuraspecies) and Clade 1BIb (DasyatisandTaeniurops spe-cies) with weak and high support bootstrap value (58/88%).
The phylogenetic trees clearly showed that members of Dasyatidae were not monophyletic forming four clades in COI and RAG1 genes, and two main clades each with two subclades in ND2. The four clades or subclades include: a.NeotrygonandTaeniuraspecies, b.Dasyatisand Taeniuropsspecies, c.Himanturaspecies, and d.Pastinachusspecies. From the COI phyloge-netic tree, the two generaNeotrygonandTaeniurashowed sister relationships and were grouped with three other families of Myliobatiformes including Gymnuridae, Urolophidae and Plesiobatidae.
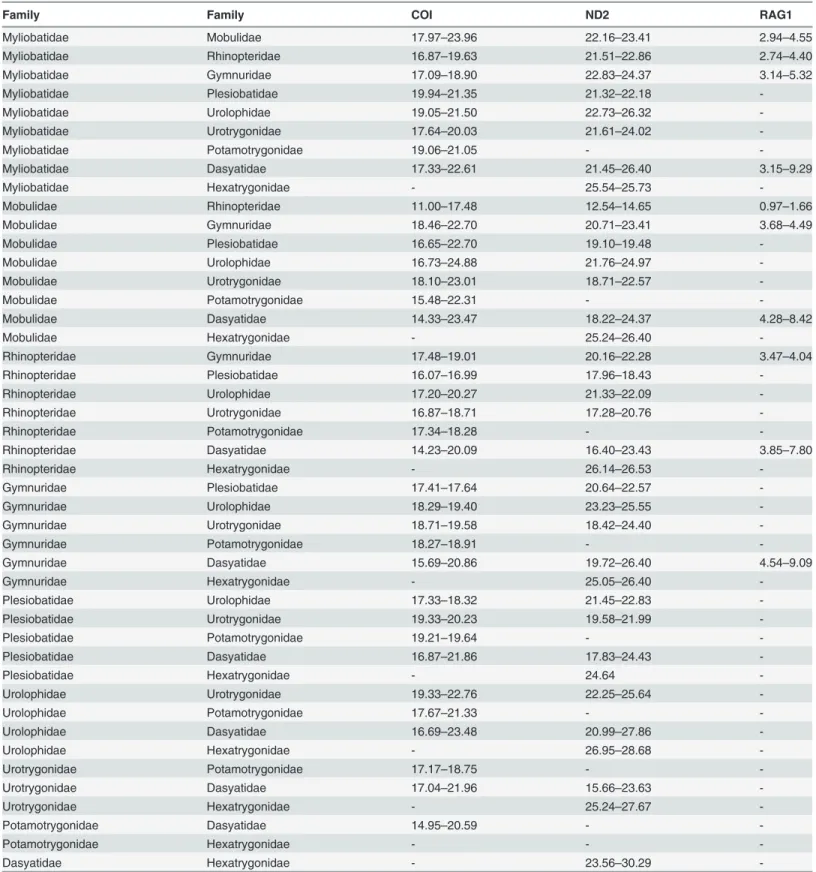
Table 1. Range of uncorrected p-distances for COI, ND2 and RAG1 genes among families in the Order Myliobatiformes.
Family Family COI ND2 RAG1
Myliobatidae Mobulidae 17.97–23.96 22.16–23.41 2.94–4.55
Myliobatidae Rhinopteridae 16.87–19.63 21.51–22.86 2.74–4.40
Myliobatidae Gymnuridae 17.09–18.90 22.83–24.37 3.14–5.32
Myliobatidae Plesiobatidae 19.94–21.35 21.32–22.18
-Myliobatidae Urolophidae 19.05–21.50 22.73–26.32
-Myliobatidae Urotrygonidae 17.64–20.03 21.61–24.02
-Myliobatidae Potamotrygonidae 19.06–21.05 -
-Myliobatidae Dasyatidae 17.33–22.61 21.45–26.40 3.15–9.29
Myliobatidae Hexatrygonidae - 25.54–25.73
-Mobulidae Rhinopteridae 11.00–17.48 12.54–14.65 0.97–1.66
Mobulidae Gymnuridae 18.46–22.70 20.71–23.41 3.68–4.49
Mobulidae Plesiobatidae 16.65–22.70 19.10–19.48
-Mobulidae Urolophidae 16.73–24.88 21.76–24.97
-Mobulidae Urotrygonidae 18.10–23.01 18.71–22.57
-Mobulidae Potamotrygonidae 15.48–22.31 -
-Mobulidae Dasyatidae 14.33–23.47 18.22–24.37 4.28–8.42
Mobulidae Hexatrygonidae - 25.24–26.40
-Rhinopteridae Gymnuridae 17.48–19.01 20.16–22.28 3.47–4.04
Rhinopteridae Plesiobatidae 16.07–16.99 17.96–18.43
-Rhinopteridae Urolophidae 17.20–20.27 21.33–22.09
-Rhinopteridae Urotrygonidae 16.87–18.71 17.28–20.76
-Rhinopteridae Potamotrygonidae 17.34–18.28 -
-Rhinopteridae Dasyatidae 14.23–20.09 16.40–23.43 3.85–7.80
Rhinopteridae Hexatrygonidae - 26.14–26.53
-Gymnuridae Plesiobatidae 17.41–17.64 20.64–22.57
-Gymnuridae Urolophidae 18.29–19.40 23.23–25.55
-Gymnuridae Urotrygonidae 18.71–19.58 18.42–24.40
-Gymnuridae Potamotrygonidae 18.27–18.91 -
-Gymnuridae Dasyatidae 15.69–20.86 19.72–26.40 4.54–9.09
Gymnuridae Hexatrygonidae - 25.05–26.40
-Plesiobatidae Urolophidae 17.33–18.32 21.45–22.83
-Plesiobatidae Urotrygonidae 19.33–20.23 19.58–21.99
-Plesiobatidae Potamotrygonidae 19.21–19.64 -
-Plesiobatidae Dasyatidae 16.87–21.86 17.83–24.43
-Plesiobatidae Hexatrygonidae - 24.64
-Urolophidae Urotrygonidae 19.33–22.76 22.25–25.64
-Urolophidae Potamotrygonidae 17.67–21.33 -
-Urolophidae Dasyatidae 16.69–23.48 20.99–27.86
-Urolophidae Hexatrygonidae - 26.95–28.68
-Urotrygonidae Potamotrygonidae 17.17–18.75 -
-Urotrygonidae Dasyatidae 17.04–21.96 15.66–23.63
-Urotrygonidae Hexatrygonidae - 25.24–27.67
-Potamotrygonidae Dasyatidae 14.95–20.59 -
-Potamotrygonidae Hexatrygonidae - -
-Dasyatidae Hexatrygonidae - 23.56–30.29
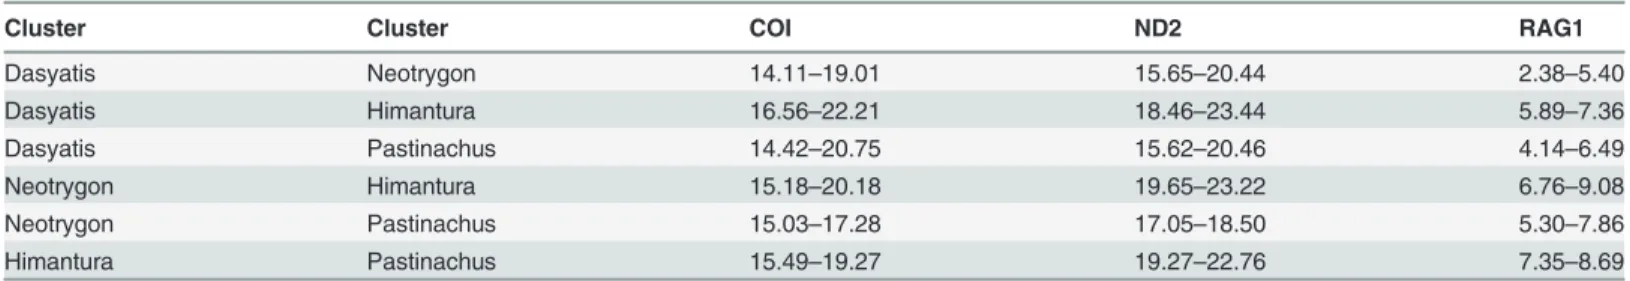
whether each of these clusters should be considered as single family (Table 2). The p-distances of the four clusters ranged from 14.11 to 22.21%, 15.62 to 23.44% and 2.38 to 9.08% for COI, ND2 and RAG1 genes, respectively. These distances were comparable to the range of p-dis-tances computed for the known families of the Myliobatiformes (Table 1), and therefore, the current Dasyatidae should be split into four families. The available sequences ofDasyatis micropsin COI gene (accession number KJ749659, KJ749660 and EU541310 (misidentified)) and ND2 gene (accession number JQ518779) were found to be distant from other members of Dasyatis, with p-distances that ranged from 14.42 to 17.38% and 16.03 to 19.68% for COI and ND2 genes, respectively. Its distance from other members of Myliobatiformes was also found to be high, ranging from 13.08 to 18.25% and 17.85 to 24.00% for COI and ND2 genes, respec-tively. In addition, the position ofD.micropsin both COI and ND2 genes was placed away from otherDasyatisbut formed the cluster with Urolophidae (Trygonopteraspecies) in COI gene and Urotrygonidae in ND2 gene. Therefore, the current taxonomic classification ofD. micropsshould be revised.
Proposed new families and reclassification of Order Myliobatiformes
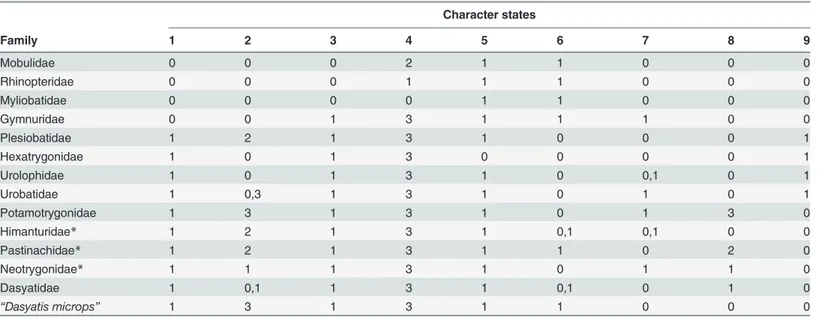
The derived family character matrix that uniquely distinguishes the thirteen families in the Myliobatiformes included three newly proposed families (Table 3). The family character matrix was constructed from the character states of 47 sampled species (S3 Table). We have included Dasyatis micropsas a separate, additional‘family’due to its uniqueness. Hence, the nine char-acter states which distinguish the families could be used to construct a classification key to the stingray families as given below.Morphometric analysis and descriptions of Dasyatidae with proposed
new families
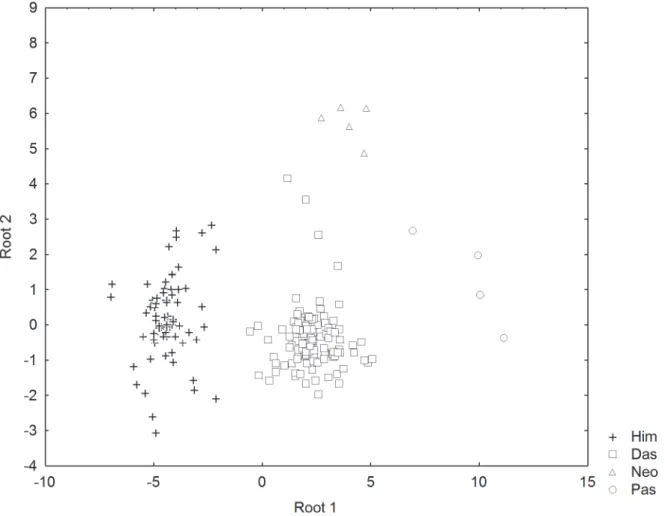
The SDFA of the morphometric measurements indicated that the four families of dasyatids could be distinguished based on the first two canonical roots which explained 96.0% of the total variation. Nine character measurements were identified as the most useful in the SDFA model, including relative total length (TL), disc length (DL), tail width (TW), tail height (TH), eye diameter (ED), spiracle length (SPL), interspiracular length (ISL), distance between fifth gill slits (I5) and ventral tail fold length (VFL). The biplot of canonical scores of these charac-ters on the first two roots show four separable cluscharac-ters each belonging to a family (Fig 4). On root 1 (eigen value,λ= 12.7314), Pastinachidae are separated from the rest by their relatively longer ventral tail fold, whereas Himanturidae have no fin fold and the longest disc length. On root 2 (λ= 1.0282), Neotrygonidae are separated from the other families by their relatively large eye diameter. Specimens were all correctly predicted to their family in the classification matrix except for one individual of Dasyatidae classified as Neotrygonidae.
Table 2. Range of uncorrected p-distances among the four clusters in the Dasyatidae (sensu Carpenter & Niem, 1999) based on COI, ND2 and RAG1 genes.
Cluster Cluster COI ND2 RAG1
Dasyatis Neotrygon 14.11–19.01 15.65–20.44 2.38–5.40
Dasyatis Himantura 16.56–22.21 18.46–23.44 5.89–7.36
Dasyatis Pastinachus 14.42–20.75 15.62–20.46 4.14–6.49
Neotrygon Himantura 15.18–20.18 19.65–23.22 6.76–9.08
Neotrygon Pastinachus 15.03–17.28 17.05–18.50 5.30–7.86
Himantura Pastinachus 15.49–19.27 19.27–22.76 7.35–8.69
Dasyatidae
Type genus
DasyatisRafinesque, 1810, by original designation
Type species
Dasyatis pastinaca(Linnaeus, 1758)
Description
Body not wing-like, disc length slightly longer than width 101.0% (79.9–112.9%) DW, snout to cloaca length 87.9% (66.4–103.3%) DW, no denticles, thorns confined to midline of disc; tail whip-like, total length 277.2% (75.2–346.1%) DW, long but low ventral skin fold, ventral skin fold length 56.1% (31.7–99.3%) DW, tail slightly depressed at base, tail width 8.5% (3.7–12.3%) DW, tail height 5.0% (2.8–6.8%) DW, plain colour of either dark brown or black; subtriangular pelvic fin length 17.8% (11.1–23.1%) DW; eye diameter 3.8% (1.8–6.6%) DW; spiracle length 7.5% (5.1–10.4%) DW, interspiracular length 18.1% (12.5–22.1%) DW; distance between first pair of gill slits 21.4% (11.7–25.0%) DW, distance between fifth pair of gill slits 13.7% (8.3– 16.0%) DW. Genera:DasyatisandTaeniurops.Taeniurops meyenihas short tail, without body thorns.
Table 3. Character matrix for thirteen major families (includingDasyatis microps) of the Myliobatiformes (present study) based on nine character states.
Character states
Family 1 2 3 4 5 6 7 8 9
Mobulidae 0 0 0 2 1 1 0 0 0
Rhinopteridae 0 0 0 1 1 1 0 0 0
Myliobatidae 0 0 0 0 1 1 0 0 0
Gymnuridae 0 0 1 3 1 1 1 0 0
Plesiobatidae 1 2 1 3 1 0 0 0 1
Hexatrygonidae 1 0 1 3 0 0 0 0 1
Urolophidae 1 0 1 3 1 0 0,1 0 1
Urobatidae 1 0,3 1 3 1 0 1 0 1
Potamotrygonidae 1 3 1 3 1 0 1 3 0
Himanturidae* 1 2 1 3 1 0,1 0,1 0 0
Pastinachidae* 1 2 1 3 1 1 0 2 0
Neotrygonidae* 1 1 1 3 1 0 1 1 0
Dasyatidae 1 0,1 1 3 1 0,1 0 1 0
“Dasyatis microps” 1 3 1 3 1 1 0 0 0
*Proposed new families
Neotrygonidae(newly proposed)
Type genus
NeotrygonCastelnau, 1873, by original designation
Type species
Neotrygon trigonoides(Castelnau, 1873)
Description
Body not wing-like; disc length shorter than width 84.4% (79.2–87.3%) DW, snout to cloaca length 70.5% (68.2–73.4%) DW, no denticles, thorns confined to midline of disc; tail short, not whip-like, total length 197.3% (163.6–238.8%) DW, long but low ventral skin fold, ventral skin fold length 65.4% (54.8–77.6%) DW, tail slightly depressed at base, tail width 7.7% (6.6–8.2%) DW, tail height 5.2% (4.4–6.2%) DW, light colour or banded; subtriangular pelvic fin length 19.8% (14.2–22.4%) DW; eye diameter 5.5% (5.1–6.2%) DW; spiracle length 5.9% (5.2–6.7%) DW, interspiracular length 13.8% (12.7–15.4%) DW; distance between first pair of gill slits 16.4% (15.2–18.1%) DW, distance between fifth pair of gill slits 9.1% (8.5–10.2%) DW. Genera: NeotrygonandTaeniura. Most species have colourful spots on their body.
Fig 4. Plots of canonical scores derived from forward stepwise discriminant analysis of morphometric measurements of four stingray families. Squares = Dasyatidae; triangles = Neotrygonidae; crosses = Himanturidae; circles = Pastinachidae.
Himanturidae(newly proposed)
Type genus
HimanturaMüller & Henle, 1837, by monotypy
Type species
Himantura uarnak(Gmelin, 1789)
Description
Body not wing-like; disc length slightly longer than width 104.1% (82.3–120.0%) DW, snout to cloaca length 88.5% (67.7–107.0%) DW, wide margin of granular or flat denticles, with or without thorns on midline, thorns granular (like pearl) or sharp if present; tail usually whip-like, total length 270.2% (154.7–468.0%) DW, without ventral skin fold, tail slightly depressed at base, tail width 9.2% (4.1–12.3%) DW, tail height 5.9% (3.4–9.0%) DW, plain in colour or with patterns; subtriangular pelvic fin length 16.1% (11.9–26.0%) DW; eye diameter 4.3% (1.0– 6.7%) DW; spiracle length 6.9% (4.7–12.1%) DW, interspiracular length 18.5% (12.9–25.8%) DW; distance between first pair of gill slits 23.8% (14.6–30.8%) DW, distance between fifth pair of gill slits 15.8% (9.0–19.2%) DW. Genus:Himantura. Adult femaleHimantura walga however has short and bulbous tail.
Pastinachidae(newly proposed)
Type genus
PastinachusRüppell, 1829, by monotypy
Type species
Pastinachus sephen(Forsskål 1775)
Description
Body not wing-like; disc length slightly shorter than width 90.4% (82.6–97.6%) DW, snout to cloaca length 74.6% (68.9–78.7%) DW, wide margin of granular or flat denticles, pearl thorns on mid disc; tail whip-like, total length 338.5% (297.4–402.9%) DW, with long and large ventral skin fold, ventral skin fold length 102.7% (74.0–123.4%) DW, tail slightly de-pressed at base, tail width 10.9% (9.1–11.9%) DW, tail height 6.5% (5.7–7.2%) DW, plain in colour; subtriangular pelvic fin length 23.2% (20.5–26.9%) DW; eye diameter 2.6% (1.8–3.1%) DW; spiracle length 6.9% (5.9–7.7%) DW, interspiracular length 16.8% (14.3–18.7%) DW; dis-tance between first pair of gill slits 19.8% (17.8–21.9%) DW, disdis-tance between fifth pair of gill slits 13.1% (12.2–13.8%) DW. Genus:Pastinachus.
Key to the families of Order Myliobatiformes
1a. Disc broad and laterally expanded with wing like pectoral fin, disc width less than 1.3 times disc length (Fig 5A & 5B). . .. . .2
1b. Disc not greatly expanded, diamond or round shaped, disc width more than 1.3 times disc length (Fig 6). . .. . .3
2b. Head elevated, extended anterior to the pectoral fin with separate rostral fin or paired ce-phalic fins or horns (Fig 5A, 5C & 5D). . .. . .12
3a. Short and thick tail with well-developed caudal fin or with dorsal and ventral skin fold at rear end of tail, tail not whip like (Fig 5G). . .. . .4
3b. Caudal fin absent. Tail with or without ventral skin fold on midline of tail usually not reach-ing rear end of tail. Tail usually long and whip like (Fig 5H & 5I). . .. . .8
4a. Six pairs of gill openings with spiracles separated from the eyes (Fig 5E). . .. . . Hexatrygonidae
4b. Five pairs of gill openings with spiracles close to eyes. . .. . .5
5a. Preorbital length of snout more than 6 times orbit diameter, disc surface with small granu-lar denticles (Fig 5F). . .. . .Plesiobatidae
5b. Preorbital length of snout much lesser than 6 times orbit diameter, disc surface with or without denticles. . .. . .6
6a. Disc surface with spiny or star like denticles over a wide margin, caudal fin reduced to dor-sal and ventral skin flaps at rear end of tail. Body shape usually round or oval, non-angular at the side. Exclusively freshwater. . .. . .Potamotrygonidae
6b. Disc surface smooth (rarely with spiny denticles), tail with well developed caudal fin. Body shape either round, oval or rhomboidal. Never found in freshwater. . .. . .7
7a. Member of Eastern hemisphere (UrolophusandTrygonopteraspecies). . .. . .Urolophidae
7b. Member of Western hemisphere (UrotrygonandUrobatisspecies)...Urotrygonidae
8a. No prominent denticle. Low ventral skin fold (Fig 5H & 5J). . .. . .9
8b. Denticle band very broad (not observable in juvenile). Skin fold not as above (Fig 5K)...10
9a. Tail uniformly coloured, dorsal surface of disc uniform in colour, exceptTaeniurops meyeni (Fig 6A). . .. . .Dasyatidae
9b. Tail with either banded patterns or stripes, dorsal surface of disc with pattern of mostly spots (Fig 6B & 6C). . .. . .Neotrygonidae(proposed)
10a. Spiny denticles with no thorns on the body (not observable in juvenile), tail very broad based, tapering rapidly beyond sting to appear as 2 distinct portions, disc very broad (width more than 1.2 times length). . .. . .(Dasyatis microps)
10b. Granular or flat denticles, thorns on the body can be sharp or flat (not observable in juve-nile), tail broad based or tapering evenly but not appearing as distinct portions, disc width less than 1.2 times length. . .. . .11
11a. Tail with no ventral skin fold (Fig 6D). . .. . .Himanturidae(proposed)
11b. Tail with large ventral skin fold terminating well before tail tip (Fig 6E). . .. . . Pastinachi-dae(proposed)
Fig 5. Morphological characters used in key to the families of Order Myliobatiformes.Wing-like body shape of Mobulidae (A) and Gymnuridae (B), Head of Myliobatidae (C), Head of Rhinopteridae (D), Gill openings of Hexatrigonidae (E), Plesiobatidae with long preorbital length (F), Short tail with caudal fin (G), Whip-like tail with low ventral skin fold (H), Whip-like tail with large ventral skin fold (I), Body thorns without denticles (J), and Body with thorns and denticles (K). Drawings adapted from photos and figures in Carpenter & Niem [1] and Lastet al. [5].
12a. Snout in the form of prehensile, elongate, bilobate cephalic fins, laterally based on head (Fig 5A). . .. . .Mobulidae
12b. Snout in the form of single convex or low bilobate pair of rostral fins. . .. . .13
13a. Rostral fin single and convex (Fig 5C). . .. . .Myliobatidae
13b. Rostral fin bilobate and broadly notched medially (Fig 5D). . .. . .Rhinopteridae
Testing the functionality of the classification key for Myliobatiformes
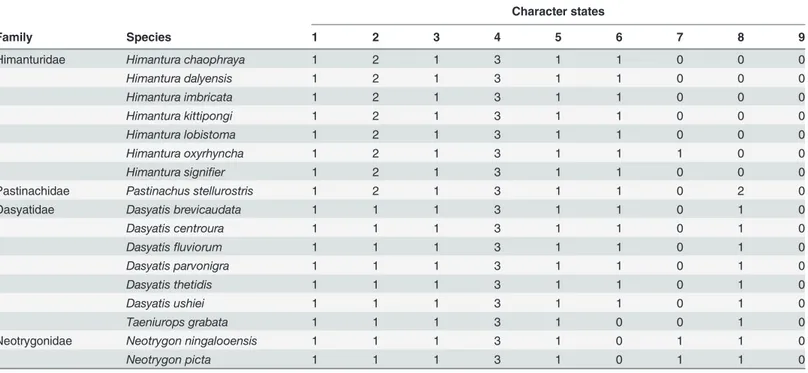
The nine character states scored for the 17 test species of the current dasyatids formed the test character matrix inTable 4. None of these species were used to construct the family character matrix of the Myliobatiformes (Table 3) although some species were used to construct the phy-logenetic trees. As observed, the test character matrix perfectly agrees with the derived charac-ter matrix for families of the Myliobatiformes; all 17 species were correctly identified to the four families.Discussion
The COI, ND2 and RAG1 genes that were used in the present study had revealed the non-monophyletic nature of the present Dasyatidae. All genes are successfully used in the present study to resolve the specific relationships of the problematic current Dasyatidae and the famil-ial relationships of the Myliobatiformes. Neither of these genes nor other available genes has ever been studied at the family level in elasmobranchs. Our study using additional morphologi-cal information has erected a natural classification key for the Myliobatiformes by removing previously used characters the cause ofincertae sedisand past misclassifications.
The results of our study agree with Cerutti-Pereyraet al. [10] study using COI gene showing clear taxonomic classification in Myliobatiformes with four major clusters in Dasyatidae. As shown in the phylogenetic tree, sequences of samples belonging to the same species formed the smallest clusters at the distal end of the trees, e.g.Dasyatis zugei,Neotrygon kuhlii,Himantura pastinacoides,Pastinachus atrusand similarly for sequences of the same genus. The clusters and their subclusters shown in the phylogenetic trees of COI, ND2 and RAG1 genes were sup-ported by the uncorrected p-distance with the smallest intraspecific distance (0 to 4.91% in COI and 0 to 3.66% in ND2). For RAG1 gene, the currently available sequences were insuffi-cient to present conclusive result at intraspecific level. However, based on the present available data, the uncorrected p-distances ranged from 0 to 1.28%.
At the genus level, the uncorrected p-distance was higher than that of species level i.e. 1.87 to 18.46% for COI, 4.53 to 19.86% for ND2 and 0 to 4.81% for RAG1. For COI gene, the mean distance at genus level in the present study (12.03%) was found to be higher than that of Cer-utti-Pereyraet al. [10] (8.85%), Wardet al. [33] (9.93%) and Wardet al. [7] (7.48%) but similar to Zhang & Hanner [34] (13.55%). In terms of the distance variability for COI gene, the varia-tion in the present study (16.59%) is higher than that of Cerutti-Pereyraet al. [10] (10.6%) but lower than that of Wardet al. [33] (20.63%), Wardet al. [7] (24.18%) and Zhang & Hanner [34] (25.35%). For ND2 gene, the mean distance at genus level in the present study (mean 14.67%) is higher than that of Nayloret al. [11] (mean 10.16%) but the distance variation in
Fig 6. Dorsal surface of representative specimens of Dasyatidae (A), Neotrygonidae (Neotrygonspecies) (B), Neotrygonidae (Taeniuraspecies) (C), Himanturidae (D) and Pastinachidae (E), showing thorns and/or denticle patterns on dorsal surface.Drawings adapted from photos in Carpenter & Niem [1] and Lastet al. [5].
the present study (15.33%) is lower than that of Nayloret al. [11] (26.98%). For the RAG1 gene, there was no available reference on p-distance at the species or genus level of batoids.
The mean distance at the genus level is higher in the present study as compared to those re-ported by others, but still within the rere-ported range. Although the range of p-distance at the genus level overlapped with that at the family level (18.63%, 21.53% and 5.97% for COI, ND2 and RAG1 genes respectively) (see Table1&2), the mean p-distance at the family level was sig-nificantly higher than at the genus level. This confirmed the functionality of the used genes in elucidating the taxonomic classification at family level.
According to Carpenter & Niem [1] and Lastet al. [5], the species ofHimantura, Pastina-chus,Dasyatis(withTaeniurops meyeni),NeotrygonandTaeniurabelonged to the Dasyatidae. However, McEachran & Aschliman [2] and Aschlimanet al. [4] suggested that their examined species ofDasyatisandNeotrygonin the Dasyatidae were not monophyletic. Both Cerutti-Per-eyraet al. [10] and our study further confirm non-monophyly. Our study shows that the HimanturaandPastinachusspecies are also not monophyletic if placed within the current Dasyatidae (see Figs1&2). The p-distances between the species clusters (families) of studied genes are clearly large thus substantiating the four distinct clades within the current Dasyati-dae. The results suggest taxonomic separation at the family level. Here, we proposed three new families, namely, Neotrygonidae (to includeNeotrygonandTaeniuraspp.), Pastinachidae (Pas-tinachusspp.) and the Himanturidae (Himanturaspp.), while retaining the Dasyatidae which include theDasyatisandTaeniuropsspecies. The proposed elevation of these three clusters to family level is appropriate since elevation will maintain their monophyletic relationship. Dis-criminant analysis of their character morphometrics further shows their distinctness (seeFig 4). The single member,Dasyatis microps, with available COI and ND2 genes sequence in Gen-Bank, oddly did not group into the Dasyatis clade and possessed a unique character set that could not fit into any of the other families (seeTable 3); it may suggest a misidentification that
Table 4. Character matrix for species within the four proposed families that were not included in the representative species list.
Character states
Family Species 1 2 3 4 5 6 7 8 9
Himanturidae Himantura chaophraya 1 2 1 3 1 1 0 0 0
Himantura dalyensis 1 2 1 3 1 1 0 0 0
Himantura imbricata 1 2 1 3 1 1 0 0 0
Himantura kittipongi 1 2 1 3 1 1 0 0 0
Himantura lobistoma 1 2 1 3 1 1 0 0 0
Himantura oxyrhyncha 1 2 1 3 1 1 1 0 0
Himantura signifier 1 2 1 3 1 1 0 0 0
Pastinachidae Pastinachus stellurostris 1 2 1 3 1 1 0 2 0
Dasyatidae Dasyatis brevicaudata 1 1 1 3 1 1 0 1 0
Dasyatis centroura 1 1 1 3 1 1 0 1 0
Dasyatisfluviorum 1 1 1 3 1 1 0 1 0
Dasyatis parvonigra 1 1 1 3 1 1 0 1 0
Dasyatis thetidis 1 1 1 3 1 1 0 1 0
Dasyatis ushiei 1 1 1 3 1 1 0 1 0
Taeniurops grabata 1 1 1 3 1 0 0 1 0
Neotrygonidae Neotrygon ningalooensis 1 1 1 3 1 0 1 1 0
Neotrygon picta 1 1 1 3 1 0 1 1 0
could belong to a new family. The present study supports the change in name of bothTaeniura meyeniandTaeniura grabatatoTaeniurops meyeniandTaeniurops grabata, respectively [4, 20], and their retention within the Dasyatidae.
The usefulness of both morphology and molecular information to arrive at a natural classifi-cation system for the stingrays has never been employed in previous works [2,7,9–11,35–37]. Nayloret al. [35] focused on classification at the ordinal level by comparing their constructed molecular trees with the available morphological trees of others, but did not combine their use-fulness. However, the use of combined morphological and molecular information in taxonomy is not new, being applied to plants [38,39] and arthropods [40,41], although morphological in-formation only contributed to about 5% of the used characters in the phylogenetic tree [38, 39]. Ruhfelet al. [39] working on fossil plants further concluded that the topology from molec-ular data alone was better than the combination of both morphology and molecmolec-ular data. As suggested by Ruhfelet al. [39], the possible reason that morphological traits showed weak con-tribution to phylogenetic classification is the lack of better morphological data that clearly sep-arate the clades. However, the approach we used in the present study, i.e. by inserting the morphological characters into the constructed phylogenetic tree, ensures that the suite of con-trasting morphological traits is compatible to the molecular classification.
Conclusions
Molecular genetics successfully elucidated the phylogenetic relationships of the Dasyatidae stingrays, and suggests that the current family is non-monophyletic and should be split into four families, including itself with three new families, Neotrygonidae, Himanturidae and Pasti-nachidae. By resolving the non-monophyletic problem, the use of a suite of nine character states enables the natural classification of the Myliobatiformes into thirteen families based on morphology.
Supporting Information
S1 Table. Specimen collection details for all sequences obtained in this study. (DOCX)
S2 Table. Checklist of analysed species used for molecular markers, character matrix, test subjects and morphometrics.All samples are obtained from GeneBank or published refer-ences, except those in bold (new samples).
(DOCX)
S3 Table. Character matrix of representative species within Myliobatiformes (present study).SeeTable 3for detailed explanation on the differentiation of the morphological characters used.
(DOCX)
S4 Table. Morphometric measurements of Himanturidae, Dasyatidae, Neotrygonidae and Pastinachidae.Measurements are expressed as percentage of disc width.
(DOCX)
Acknowledgments
Author Contributions
Conceived and designed the experiments: KCL PEL VCC. Performed the experiments: KCL. Analyzed the data: KCL PEL VCC. Contributed reagents/materials/analysis tools: KCL PEL VCC KHL. Wrote the paper: KCL VCC PEL KHL.
References
1. Carpenter KE, Niem VH. FAO species identification guide for fishery purposes. The living marine re-sources of the Western Central Pacific. Volume 3. Batoid fishes, chimaeras and bony fishes part 1 (Elo-pidae to Linophrynidae). Rome: FAO; 1999. pp. 1397–2068.
2. McEachran JD, Aschliman N. Phylogeny of Batoidea. In: Carrier JC, Musick JA, Heithaus MR, editors. Biology of Sharks and Their Relatives. Boca Raton, FL: CRC Press; 2004. pp. 79–113.
3. Aschliman NC. The Batoid Tree of Life: Recovering The Patterns and Timing of The Evolution Of Skates, Rays And Allies (Chondrichthyes: Batoidea). PhD Thesis, Florida State University Electronic Theses, Treatises and Dissertations. 2011. Available:http://diginole.lib.fsu.edu/cgi/viewcontent.cgi? article=4215&context = etd.
4. Aschliman NC, Claeson KM, McEachran JD. Phylogeny of Batoidea. Reviewed chapter. In Carrier JC, Musick JA, Heithaus MR, editors. Biology of Sharks and Their Relatives, Edition 2. Boca Raton, FL: CRC Press; 2012. pp. 57–95.
5. Last PR, White WT, Caira JN, Dharmadi, Fahmi, Jensen K, et al. Sharks and Rays of Borneo. Colling-wood: CSIRO Marine and Atmospheric Research; 2010.
6. Hebert PDN, Cywinska A, Ball SL, deWard JR. Biological identification through DNA barcodes. Proc R Soc Lond B. 2003; 270: 313–321.
7. Ward RD, Holmes BH, White WT, Last PR. DNA barcoding Australasian chondrichthyans: results and potential uses in conservation. Mar Freshwat Res. 2008; 59: 57–71.
8. Holmes BH, Steinke D, Ward RD. Identification of shark and ray fins using DNA barcoding. Fish Res. 2009; 95: 280–288.
9. Serra-Pereira B, Moura T, Griffiths AM, Gordo LS, Figueiredo I. Molecular barcoding of skates (Chon-drichthyes: Rajidae) from the southern Northeast Atlantic. Zool Scr. 2011; 40(1): 76–84.
10. Cerutti-Pereyra F, Meekan MG, Wei N-WV, O’Shea O, Bradshaw CJA, Austin CA. Identification of Rays through DNA Barcoding: An Application for Ecologists. PLOS ONE. 2012; 7(6): e36479. doi:10. 1371/journal.pone.0036479PMID:22701556
11. Naylor GJP, Caira JN, Jensen K, Rosana KAM, White WT, Last PR. A DNA sequence-based approach to the identification of shark and ray species and its implications for global elasmobranch diversity and parasitology. B Am Mus Nat Hist. 2012; 367: 262 pp.
12. Thompson JD, Gibson TJ, Plewniak F, Jeanmougin F, Higgins DG. The Clustal X windows interface: flexible strategies for multiple sequence alignment aided by quality analysis tools. Nucleic Acids Res. 1997; 24: 4876–4882. PMID:9396791
13. Hall TA. BioEdit: a user-friendly biological sequence alignment editor and analysis program for Win-dows 95/98/NT. Nucl Acids Symp Ser. 1999; 41: 95–98.
14. Tanabe AS. Kakusan: a computer program to automate the selection of a nucleotide substitution model and the configuration of a mixed model on multi locus data. Mol Ecol Notes. 2007; 7: 962–964. 15. Huelsenbeck JP, Ronquist F. MrBayes: Bayesian Inference of Phylogenetic Trees. Bioinformatics.
2001; 17: 754–755. PMID:11524383
16. Jobb G, von Haeseler A, Strimmer K. Treefinder: a powerful graphical analysis environment for molecu-lar phylogenetics. BMC Evol Biol. 2004; 4: 18 p. PMID:15222900
17. Swofford DL. PAUP*: Phylogenetic analysis using parsimony (*and other methods). Version 4. Sun-derland, MA: Sinauer Associates; 2002.
18. Yano K, Ahmad A, Gambang AC, Idris AH, Solahuddin AR, Aznan Z. Sharks and rays of Malaysia and Brunei Darussalam. Kuala Terengganu: SEAFDEC-MFRDMD/SP/12; 2005.
19. White WT, Last PR, Stevens JD, Yearsley GK, Fahmi, Dharmadi. Economically important sharks & rays. Perth: Australian Centre for International Agricultural Research; 2006.
20. Last PR, Steven JD. Sharks and rays of Australia 2nd edition. Melbourne: CSIRO Publishing; 2009. 21. Last PR, White WT, Pogonoski JJ. Descriptions of New Australian Chondrichthyans. Hobart TAS:
CSIRO Marine and Atmospheric Research; 2008.
23. Carpenter KE. The living marine resources of the Western Central Atlantic. Volume: Introduction, moluscs, crustaceans, hagfishes, sharks, batoid fishes, and chimaeras. FAO Species Identification Guide for Fishery Purposes and American Society of Ichthyologists and Herpetologists Special Publi-cation No. 5. Rome: FAO; 2002. pp. 1–600.
24. Da Silva JPCB, de Carvalho MR. A new species of neotropical freshwater stingray of the genus Pota-motrygonGarman, 1877 from the Río Madre De Díos, Peru (Chondrichthyes: Potamotrygonidae). Pap Avulsos Zool. 2011; 51(8): 139–154.
25. Serena F. Field identification guide to the sharks and rays of the Mediterranean and Black Sea. FAO Species Identification Guide for Fishery Purposes. Rome: FAO; 2005.
26. Last PR, White WT, Puckridge M.Neotrygon ningalooensisn. sp. (Myliobatoidei: Dasyatidae), a new maskray from Australia. Aqua Intnl J Ichthyol. 2010; 16(2): 37–50.
27. Manjaji-Matsumoto BM, Last PR.Himantura lobistoma, a new whipray (Rajiformes: Dasyatidae) from Borneo, with comments on the status ofDasyatis microphthalmus. Ichthyol Res. 2006; 53: 290–297. 28. Last PR, White WT, Pogonoski JJ. Descriptions of New Sharks and Rays from Borneo. Hobart TAS:
CSIRO Marine and Atmospheric Research; 2010.
29. Vidthayanon C, Roberts TR.Himantura kittipongi, a new species of freshwater whiptailed stingray from the Maekhlong River of Thailand (Elasmobranchii, Dasyatididae). Nat Hist Bull Siam Soc. 2005; 53(1): 123–132.
30. Compagno LJV, Roberts TR. Freshwater stingrays (Dasyatidae) of Southeast Asia and New Guinea, with description of a new species ofHimanturaand reports of unidentified species. Env Biol Fish. 1982; 7(4): 321–339.
31. Nishida K, Nakaya K. A new species of the GenusDasyatis(Elasmobranchii: Dasyatidae) from South-ern Japan and Lectotype Designation ofD.zugei. Jpn J Ichthyol. 1988; 35(2): 115–123.
32. StatSoft, Inc. Electronic Statistics Textbook. Tulsa, OK: StatSoft. 1997. Available:http://www.statsoft. com/textbook/stathome.html. Accessed 13 January 2015.
33. Ward RD, Zemlak TS, Innes BH, Last PR, Hebert PDN. DNA barcoding Australia’s fish species. Phil Trans R Soc B. 2005; 360: 1847–1857. PMID:16214743
34. Zhang J, Hanner R. Molecular approach to the identification of fish in South China Sea. PLoS ONE. 2012; 7(2): e30621. doi:10.1371/journal.pone.0030621PMID:22363454
35. Naylor GJP, Ryburn JA, Fedrigo O, Lopez JA. Phylogenetic relationships among the major lineages of modern elasmobranches. In: Hamlett WC, Jamieson BGM, editors. Reproductive Biology and Phyloge-ny: Sharks, Skates, Stingrays, and Chimaeras. Plymouth: Science Publishers Inc; 2005. pp. 1–25. 36. Nishida K, Nakaya K. Taxonomy of the genus Dasyatis (Elasmobranchia, Dasyatidae) from the North
Pacific. In Pratt HL, Gruber SH, Taniuchi T, editors. Elasmobranchs as Living Resources: Advances in the Biology, Ecology, Systematics, and Status of the Fisheries. NOAA Technical Report NMFS 90. US Department of Commerce; 1990. pp. 327–346.
37. Ruocco NL, Lucifora LO, Diaz de Astarloa JM, Mabragana E, Delpiani SM. Morphology and DNA Bar-coding Reveal a New Species of Eagle Ray from the Southwestern Atlantic: Myliobatisridens sp. nov. (Chondrichthyes: Myliobatiformes: Myliobatidae). Zool Stud. 2012; 51(6): 862–873.
38. Doyle JA, Endress PK. Morphological phylogenetic analysis of basal angiosperms: comparison and combination with molecular data. Int J Plant Sci. 2000; 161(6 suppl): S121–S153.
39. Ruhfel BR, Stevens PF, Davis CC. Combined morphological and molecular phylogeny of the Clusioid clade (Malpighiales) and the placement of the ancient Rosid macrofossil Paleoclusia. Int J Plant Sci. 2013; 174(6): 910–936.
40. Giribet G, Edgecombe GD, Wheeler WC. Arthropod phylogeny based on eight molecular loci and mor-phology. Nature. 2001; 413: 157–161. PMID:11557979