Searching for convergent evolution in manganese superoxidase dismutase
using hydrophobic cluster analysis
Heng Xiang
1, Ruizhi Zhang
3, Nengzhang Li
1and Charles R. Vossbrinck
21
College of Animal Science and Technology, Southwest University, Beibei, Chongqing, China.
2Connecticut Agricultural Experiment Station, New Haven, Connecticut, USA.
3
Biotechnology Research Center, Southwest University, Beibei, Chongqing, China.
Abstract
There are numerous examples of convergent evolution in nature. Major ecological adaptations such as flight, loss of limbs in vertebrates, pesticide resistance, adaptation to a parasitic way of life, etc., have all evolved more than once, as seen by their analogous functions in separate taxa. But what about protein evolution? Does the environment have a strong enough influence on intracellular processes that enzymes and other functional proteins play, to evolve similar functional roles separately in different organisms? Manganese Superoxide Dismutase (MnSOD) is a manganese-dependant metallo-enzyme which plays a crucial role in protecting cells from anti-oxidative stress by eliminating reac-tive (superoxide) oxygen species. It is a ubiquitous housekeeping enzyme found in nearly all organisms. In this study we compare phylogenies based on MnSOD protein sequences to those based on scores from Hydrophobic Cluster Analysis (HCA). We calculated HCA similarity values for each pair of taxa to obtain a pair-wise distance matrix. A UPGMA tree based on the HCA distance matrix and a common tree based on the primary protein sequence for MnSOD was constructed. Differences between these two trees within animals, enterobacteriaceae, planctomycetes and cyanobacteria are presented and cited as possible examples of convergence. We note that several residue changes result in changes in hydrophobicity at positions which apparently are under the effect of positive selection.
Keywords: convergence, hydrophobic cluster analysis, manganese superoxide dismutase, phylogeny, structure.
Received: January 16, 2014. Accepted: March 29, 2014.
Introduction
Superoxide dismutases are a group of metalloenzy-mes that are present in the vast majority of organisms thus far studied. They are responsible for the dismutation of re-active superoxide (oxygen molecule with an extra electron O2-) to peroxide and water as follows: 2 O2-+ 2 H2O = O2
+H2O2and 2 OH-(Fridovich, 1995). In concert with
cata-lase, the peroxide is further to broken down to H2O and O2
(Belinkyet al., 2002). There are three separate superoxide dismutases based on the metal cofactor associated with the enzyme: iron SODs (FeSODs) found in prokaryotes, protists and plants, copper/zinc SODs (Cu/ZnSODs) found in bacteria and the cytosol of eukaryotes, and manganese SODs (MnSODs) found in prokaryotes and the mitochon-drial matrix of eukaryotes (Natviget al., 1996). MnSODs are usually found as homodimers in bacteria or homo-tetramers in eukaryotes (Natviget al., 1996). Each MnSOD monomer contains two domains (C- and N-terminal) con-nected by a loop. The C-terminal domain consists of a three-stranded antiparallel beta-sheet and four helices,
while the N-terminal one consists of two helices folded into an antiparallel hairpin, along with a left-handed twist (Guan
et al., 1998). It has been shown that superoxide acts against oxidative stress and that SOD mutants exhibit additional re-quirements for methionine and lysine, and may have short-ened life spans and are oxygen intolerant (Fridovich, 1995; Alscheret al., 2002). Because of its crucial role in prevent-ing damage by superoxide ions, MnSODs have been found in nearly all species reported to date.
Hydrophobic Cluster Analysis (HCA) was developed for structural comparisons between proteins based on pri-mary sequence information, in cases where X-ray crystal structure was difficult if not impossible to obtain (Gabo-riaudet al., 1987). It has been pointed out that the sequence variation based on the 20 essential amino acids is much greater than the number of observed variations in protein secondary and tertiary structure. That is to say that common 2-D and 3-D folding patterns can consist of very different amino acid sequences (Lemesle-Varloot et al., 1990). There is, for example, an 80% similarity based on HCA in the hydrophobic regions between human hemoglobin a-chain and lupin leghemoglobin while there is only a 15%
sequence identity (Gaboriaud et al., 1987). A previous study applied HCA to the analysis of a tandem mutation of
www.sbg.org.br
superoxide dismutase from the microsporidium Nosema bombycisto look for structural differences between these isozymes (Xianget al., 2010). The goal was to understand whether this duplication represents the evolution of an SOD with different functional characteristics, or simply a duplication of the same protein to produce more SOD for the same purpose.
The aim of this present study was to compare phylo-genies based on a combination of (maximum likelihood, maximum parsimony, neighbor joining and Bayesian) analyses of amino acid sequence data, from a wide variety of (48) organisms, with one based on values obtained through HCA to look for structural and possible functional convergence within these proteins.
Materials and Methods
Obtaining sequence data
Amino acid sequences of 48 homologous MnSODs (manganese superoxide dismutase) were obtained from GenBank and their accession numbers are listed as follow:
Anabaena variabilis (YP_321963), Apis mellifera
(XP_393570),Arabidopsis thaliana (NP_187703), Asper-gillus fumigatuscytoplasm (Q92450),Aspergillus fumigatus
mitochondria (EAL89634), Blastopirellula marina
(ZP_01089421),Blumeria graminis(AAL56985),Candida albicans (EAK99504), Candidatus Nitrosopumilus marit-imus (ZP_02024558), Cenarchaeum symbiosum
(ABK76972), Comamonas testosteroni (ZP_01519759),
Cordyceps militaris(AAO47725), Crocosphaera watsonii
(ZP_00514026),Danio rerio(NP_956270),Debaryomyces hansenii (CAG90212), Delftia acidovorans
(ZP_01581157),Escherichia coli (P00448), Gallus gallus
(NP_989542), Gibberella zeae cytoplasm (EAA69573),
Gibberella zeae mitochondria (EAA73238), Gloeobacter violaceus (NP_923628), Homo sapiens mitochondria (P04179),Hyphomonas neptunium(YP_760332), Kluyvero-myces lactis(CAG99194),Leptolyngbya boryana(P50058),
Magnaporthe griseacytoplasm (EAA53420),Magnaporthe grisea mitochondria (EAA48554), Methylobacillus flage-llatus(YP_544498),Nematostella vectensis(XP_001641079),
Neurospora crassa cytoplasm (EAA32343), Neurospora crassa mitochondria (EAA30249), Nodularia spumigena
(ZP_01630049), Nostoc punctiforme (ZP_00112125),
Oryza sativa (AAA57131), Paracoccidioides brasiliensis
(AAW83518), Penicillium chrysogenum (AAC36585),
Planctomyces maris (ZP_01856783), Saccharomyces cerevisiae (NP_011872), Schizosaccharomyces pombe
(CAB62411), Stigmatella aurantiaca (ZP_01463295),
Tatumella ptyseos (AAQ14590), Thermosynechococcus elongatus (NP_680827), Tribolium castaneum
(XP_972440), Trichodesmium erythraeum (YP_723986),
Wolinella succinogenes (NP_907960), Xenopus laevis
(NP_001083968), Yarrowia lipolytica (CAG82903) and
Yersinia enterocolitica(P53655).
Hydrophobic cluster analysis
The software developed for Hydrophobic Cluster Analysis creates a two dimensional plot of the protein based on the amino acid sequence. The HCA plots of each MnSOD protein were drawn using the Drawhca program (Woodcocket al., 1992). This plot is presented, as it would be on a cylinder with 3.6 amino acids per turn shown as a classicala-helix. After five turns, the residues i and i + 18 are placed at the same locations on the cylinder. Then, the cylinder is separated along its axis and unrolled. As some adjacent residues would be widely cut, the representation is duplicated making it easier to follow and allowing a visual-ization of the environment of each amino acid residue. The HCA plot is then defined by encircling the adjacent hydro-phobic residues (tryptophans, tyrosines, methionines, phenylalanines, isoleucines, leucines, valines) and marking the prolines (asterisk) and glycines (closed rhomb) as pre-senting loops and the cystines as involving disulphide bonds (Gaboriaudet al., 1987).
We then developed a numerical score between each amino acid sequence pair to compare their structure simi-larity. To do this, Perl scripts were written to align the se-quences (fasta format) based on their correspondence to the HCA plot and obtained the CR numbers by counting corre-sponding hydrophobic residues between each pair of se-quences. HCA similarity scores were obtained by calculat-ing the number of hydrophobic amino acids via the following formula: HCA similarity score (%) = (2CR x 100)/(RC1 + RC2), where RC1 (RC2) is the number of hy-drophobic residues in protein 1 (protein 2), and CR is the number of hydrophobic residues which are in correspon-dence between the two sequences (Gaboriaudet al., 1987).
Constructing and comparing trees
of 100 generations. Due to their similar topologies, the four phylogenetic trees (MP, NJ, ML and Bayesian) were com-bined into one common tree using the MacClade software package (Maddison and Maddison, 2000).
Visual comparisons between the HCA tree and the common tree were accomplished using the Treejuxtaposer program (Munzneret al., 2003). This program can be used to browse many trees and compare them side by side to exam-ine topological differences by controlling the BCN (Best Corresponding Node) score. The lowest BCN threshold was chosen to check the differences between each pair of trees.
Selective test
In order to find out whether the observed hydrophobic cluster convergences are under natural selection, DnaSP v5
software (Rozas et al., 2003) was used to calculate the ratios of the nonsynonymous (Ka) to synonymous (Ks) substitution rates for pairwise genes. The selection of each individual residue within these genes was also analyzed by the site models (M1a, M2a, M7, and M8) of the CODEML software from PAML (Yang, 1997). The posterior proba-bilities were calculated using the Bates empirical Bates (BEB) algorithm.
Results
Trees comparison
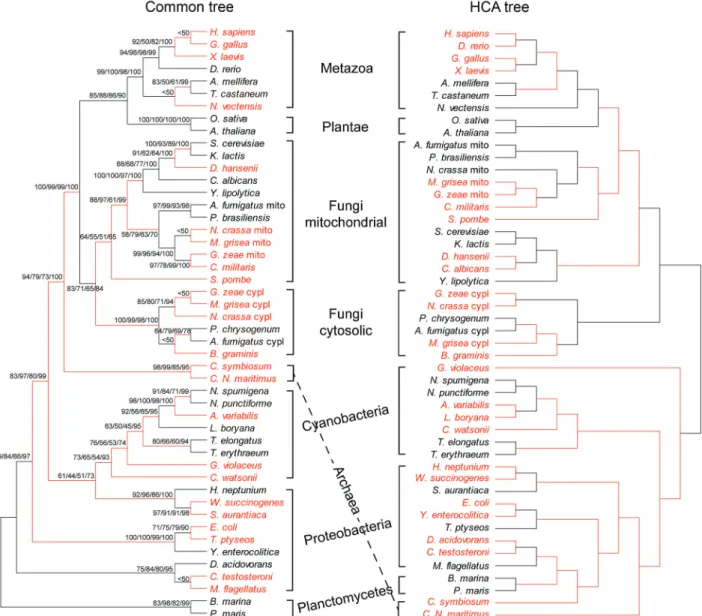
Figure 1 is a phylogenetic comparison of MnSOD based on Maximum Parsimony, Neighbor Joining, Maxi-mum Likelihood, and Bayesian analysis (see
tary Material Figures S1-S4 for individual trees) with one based on the pair-wise comparison using hydrophobic clus-ter analysis of the same protein. The common tree pre-sented in Figure 1 shows relatively high bootstrap values for most of the branch points and high agreement for the analyses performed. Phylogenetic relationships based on amino acid sequence (common tree) of this protein corre-spond well with analyses using other genes (Ciccarelliet al., 2006). All three analyses separated the taxa into the three accepted domains of life; Eukarya, Archaea and Bac-teria. The eukaryotes are separated into three common kingdoms (Fungi, Animalia, and Plantae). The fungi show a dichotomy into cytosolic and mitochondrial forms of their MnSODs as previously reported (Frealle et al., 2006). The fungal taxa presented are all Ascomycetes
and conform to the relationships presented in earlier works constructing a 6-gene phylogeny (James et al., 2006). Interestingly the HCA tree conforms better to the 6-gene tree in one minor respect, withCandida albicans
andDebaryomyces hanseniibeing sister taxa (Kurtzman and Robnett, 1998).
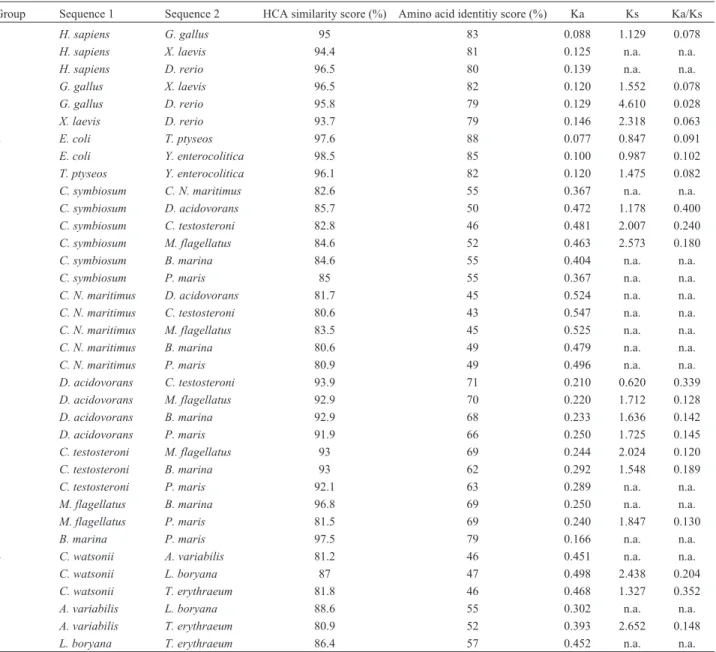
While we did not see differences between the two trees at the higher levels of domain and kingdom, except perhaps for the Archaea (Figure 1), we did see differences at the phylum to generic levels. The red branches shown in Figure 1, especially the five groups of Table 1 highlight sig-nificant differences between the common tree and that cre-ated by HCA values.
Table 1- Differences between sequence identity scores and HCA similarity scores for MnSOD genes within four groups. Non-synonymous (Ka) and syn-onymous (Ks) substitution rates for pairwise MnSOD were also shown. n.a., not available.
Group Sequence 1 Sequence 2 HCA similarity score (%) Amino acid identitiy score (%) Ka Ks Ka/Ks
1 H. sapiens G. gallus 95 83 0.088 1.129 0.078
H. sapiens X. laevis 94.4 81 0.125 n.a. n.a.
H. sapiens D. rerio 96.5 80 0.139 n.a. n.a.
G. gallus X. laevis 96.5 82 0.120 1.552 0.078
G. gallus D. rerio 95.8 79 0.129 4.610 0.028
X. laevis D. rerio 93.7 79 0.146 2.318 0.063
2 E. coli T. ptyseos 97.6 88 0.077 0.847 0.091
E. coli Y. enterocolitica 98.5 85 0.100 0.987 0.102
T. ptyseos Y. enterocolitica 96.1 82 0.120 1.475 0.082
3 C. symbiosum C. N. maritimus 82.6 55 0.367 n.a. n.a.
C. symbiosum D. acidovorans 85.7 50 0.472 1.178 0.400
C. symbiosum C. testosteroni 82.8 46 0.481 2.007 0.240
C. symbiosum M. flagellatus 84.6 52 0.463 2.573 0.180
C. symbiosum B. marina 84.6 55 0.404 n.a. n.a.
C. symbiosum P. maris 85 55 0.367 n.a. n.a.
C. N. maritimus D. acidovorans 81.7 45 0.524 n.a. n.a.
C. N. maritimus C. testosteroni 80.6 43 0.547 n.a. n.a.
C. N. maritimus M. flagellatus 83.5 45 0.525 n.a. n.a.
C. N. maritimus B. marina 80.6 49 0.479 n.a. n.a.
C. N. maritimus P. maris 80.9 49 0.496 n.a. n.a.
D. acidovorans C. testosteroni 93.9 71 0.210 0.620 0.339
D. acidovorans M. flagellatus 92.9 70 0.220 1.712 0.128
D. acidovorans B. marina 92.9 68 0.233 1.636 0.142
D. acidovorans P. maris 91.9 66 0.250 1.725 0.145
C. testosteroni M. flagellatus 93 69 0.244 2.024 0.120
C. testosteroni B. marina 93 62 0.292 1.548 0.189
C. testosteroni P. maris 92.1 63 0.289 n.a. n.a.
M. flagellatus B. marina 96.8 69 0.250 n.a. n.a.
M. flagellatus P. maris 81.5 69 0.240 1.847 0.130
B. marina P. maris 97.5 79 0.166 n.a. n.a.
4 C. watsonii A. variabilis 81.2 46 0.451 n.a. n.a.
C. watsonii L. boryana 87 47 0.498 2.438 0.204
C. watsonii T. erythraeum 81.8 46 0.468 1.327 0.352
A. variabilis L. boryana 88.6 55 0.302 n.a. n.a.
A. variabilis T. erythraeum 80.9 52 0.393 2.652 0.148
Animal relationships
The relationships among the Metazoa, as seen in the common tree, show a close correlation with long standing conventional wisdom and with previous phylogenies based on other molecular data. We can clearly see from the
com-parisons of Figure 1 and the scores of Table 1 and Figure 2 that, although the human (Homo sapiens) MnSOD se-quence is more similar to bird (Gallus gallus MnSOD) (83%) thanDanio rerioMnSOD (80%), based on amino acid sequence, the structure based on HCA ofH. sapiens
MnSOD is more similar to that ofD. rerioMnSOD (96.5%) thanG. gallusMnSOD (95.0%).
The vertical red box of Figure 2A, shows the similari-ties among the vertebrate proteins. Figure 2B shows a sin-gle key amino acid change (Alanine A to Valine V) which might have occurred in the mammalian (human) sequence resulting in a structural change in the MnSOD protein.
Enterobacteriaceae
Figure 3A is a HCA plot of three members of the proteobacteria in the family Enterobacteriaceae which show differences between the two phylogenies seen in
Fig-ure 1. In FigFig-ure 3A we see two contour regions (the vertical red boxes) showing similarities betweenEscherichia coli
andYersinia enterocoliticasuggesting convergent changes in tertiary structure between MnSODs of these two species.
Figure 3B shows the changes of amino acid residues that result in these two differences. In addition we can see from Figure 3B a greater degree of amino acid similarity betweenE. coliandT. ptyseos(88%) than betweenE. coli
andY. enterocolitica(85%) and betweenT. ptyseosandY. enterocolica(82%) (Table 1). ClearlyY. enterocoliticaand
E. coli have more structural similarity based on HCA
Figure 3- Comparison of the HCA structure and amino acid sequence of Enterobacteriaceae MnSODs. Note: The similarity in HCA betweenE. coliand
(98.5%), althoughY. enterocoliticais the more distantly re-lated of the three phylogenetically.
Archaea
As Archaea, Cenarchaeum symbiosum and
Candidatus Nitrosopumilus maritimus cluster together
phylogenetically, while based on HCA, C. symbiosum
clusters with the Planctomycetes/Proteobacteria clade
(Fig-ure 1). The HCA similarity scores shown in Table 1 suggest that the structure ofC. symbiosumMnSOD is more similar with that of Planctomycetes and beta-Proteobacteria
MnSODs (82.8% - 85.7%) than toC. N. maritimusMnSOD (82.6%), this implying structural convergence.
Two boxes of Figure 4A, enclosed in red, show re-gions of similarity between the archeanC. symbiosumand the Proteobacteria, whileC. N. maritimusshows a different contour. Figure 4B, shows the amino acid residues (in red) that correspond to these differences, with the hydrophobic residues indicated in blue. We infer from these results that the archeanC. symbiosumMnSOD may function in a man-ner more similar to the Planctomycetes and beta-Proteo-bacteria MnSODs than to the other archeanC. N. maritimus
MnSOD.
Blue-green algae
The relationships among the cyanobacteria show high bootstrap values in the common tree and significant
differ-ences with the HCA tree. In the common tree,
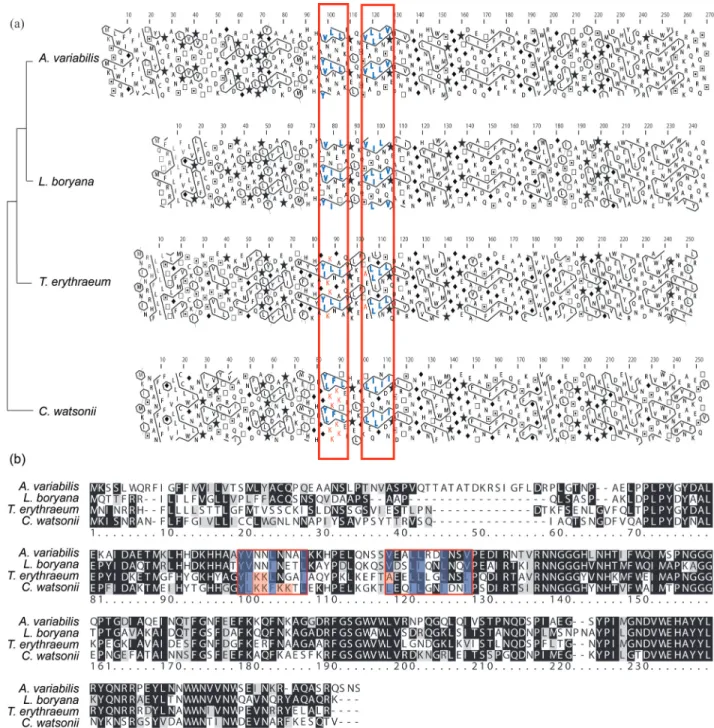
Crocosphaera watsoniiis the sister taxon to the remaining cyanobacteria, but based on HCA analysis,C. watsoniiis the sister group toLeptolyngbya boryana and Anabaena variabilis (Figure 1). We see evidence for convergence based on the comparison of amino acid substitutions as shown in Figure 5Bvs.the hydrophobic cluster analysis of Figure 5A.Crocosphaera watsoniishows the same contour as outlined by the red boxes of Figure 5A asA. variabilis
andL. boryana,while the amino acid sequences found in these contours (Figure 5B) show only 46% and 47% se-quence similarities, respectively (Table 1). In addition,
Trichodesmium erythraeum, a taxon more closely related to
A. variabilisandL. boryanathanC. watsonii, shows a dif-ferent contour in Figure 5A than the other three blue-green
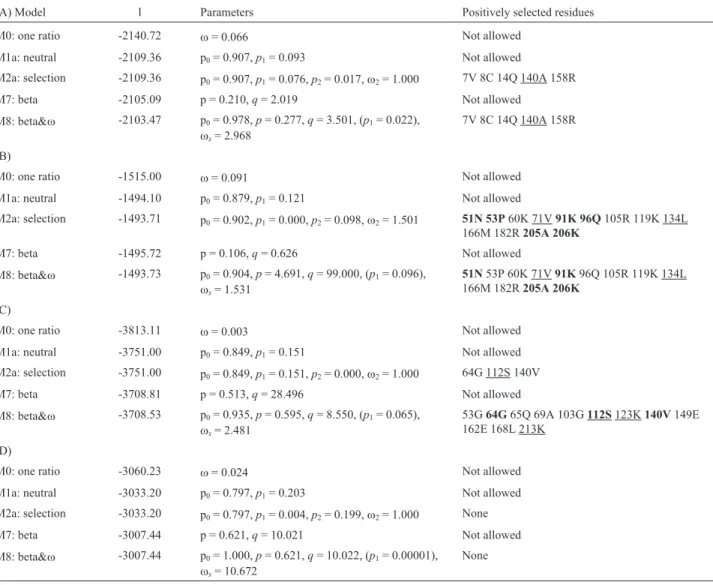
Table 2- Positive selection tests for putative convergent MnSOD genes using site models of PAML. The residues in bold mean the posterior probabilities are > 0.95 and only the values > 0.5 are presented to indicate the positive selective sites. The residues in underline correspond to the colored ones in the HCA plots and amino acid alignment figures. (A) Animal (H. sapiens, G. gallus, X. laevis,andD. rerio) in Figure 2; (B) Enterobacteriaceae (E. coli, T. ptyseos,andY. enterocolitica) in Figure 3; (C) Archaea and relatives (C. symbiosum, C.N. maritimus, D. acidovorans, C .testosteroni, M. flagellatus, B. marina,andP. maris) in Figure 4; (D) Cyanobacteria (A. variabilis, L. boryana, T. erythraeum,andC. watsonii) in Figure 5.
(A) Model l Parameters Positively selected residues
M0: one ratio -2140.72 w= 0.066 Not allowed
M1a: neutral -2109.36 p0= 0.907,p1= 0.093 Not allowed
M2a: selection -2109.36 p0= 0.907,p1= 0.076,p2= 0.017,w2= 1.000 7V 8C 14Q 140A 158R
M7: beta -2105.09 p = 0.210,q= 2.019 Not allowed
M8: beta&w -2103.47 p0= 0.978,p= 0.277,q= 3.501, (p1= 0.022),
ws= 2.968
7V 8C 14Q 140A 158R
(B)
M0: one ratio -1515.00 w= 0.091 Not allowed
M1a: neutral -1494.10 p0= 0.879,p1= 0.121 Not allowed
M2a: selection -1493.71 p0= 0.902,p1= 0.000,p2= 0.098,w2= 1.501 51N 53P60K 71V91K 96Q105R 119K 134L
166M 182R205A 206K
M7: beta -1495.72 p = 0.106,q= 0.626 Not allowed
M8: beta&w -1493.73 p0= 0.904,p= 4.691,q= 99.000, (p1= 0.096),
ws= 1.531
51N53P 60K 71V91K96Q 105R 119K 134L 166M 182R205A 206K
(C)
M0: one ratio -3813.11 w= 0.003 Not allowed
M1a: neutral -3751.00 p0= 0.849,p1= 0.151 Not allowed
M2a: selection -3751.00 p0= 0.849,p1= 0.151,p2= 0.000,w2= 1.000 64G 112S 140V
M7: beta -3708.81 p = 0.513,q= 28.496 Not allowed
M8: beta&w -3708.53 p0= 0.935,p= 0.595,q= 8.550, (p1= 0.065),
ws= 2.481
53G64G65Q 69A 103G112S123K140V149E 162E 168L 213K
(D)
M0: one ratio -3060.23 w= 0.024 Not allowed
M1a: neutral -3033.20 p0= 0.797,p1= 0.203 Not allowed
M2a: selection -3033.20 p0= 0.797,p1= 0.004,p2= 0.199,w2= 1.000 None
M7: beta -3007.44 p = 0.621,q= 10.021 Not allowed
M8: beta&w -3007.44 p0= 1.000,p= 0.621,q= 10.022, (p1= 0.00001),
ws= 10.672
algae, providing further evidence for convergence, at least at the contour level.
Selection analysis
A selection analysis revealing Ka values (non-synonymous nucleotide changes) lower than Ks (synony-mous nucleotide changes),i.e. Ka/Ks < 1, indicates that mutations in nucleotides resulting in amino acid changes are less frequent than silent changes, this implying that the respective gene is under constraint, impairing change at the protein level. This is referred to as purifying selection. In contrast, Ka values larger than Ks values (Ka/Ks > 1), im-ply that the gene is under positive selection, and that a change in amino acid composition from a previous state, at that position, is driven by evolutionary processes. Although some Ks values were not available, all of the obtained Ka/Ks ratios were less than 1 (Table 1), indicating purify-ing selection for all MnSOD genes in our analysis. Never-theless, as shown in Table 2, several positively selected residues were detected through PAML software. These changes correspond to the HCA plots and sequence align-ment maps shown in Figures 2-5, where colored residues show variations in hydrophobicity. These are changes at Alanine at position 140 ofH. sapiens, Valine at position 71 and Leucine at position 134 ofE. coli, Serine at position 112, and Lysine at the 123 and 213 sites inC. symbiosum. These appear to be under positive selection based on PAML analysis (boxed residues in Table 2). This selection may contribute to the mutations of amino acids resulting in the changes of protein structure and function.
Discussion
The presentation of the HCA tree for MnSODs gives a visual representation to look for taxa where these proteins may have deviated structurally from their phylogenetic po-sition. Hydrophobic cluster analysis allows us to observe convergent evolution not only by looking for reversions back to the same amino acid but also reversions to the same HCA contour. If this method can be automated then one could search nucleotide and protein databases for similari-ties in protein structure among unrelated organisms. The question is not whether these differences between phylog-eny and HCA are minor or major changes, but whether they represent functional convergence at all. We believe that we may have observed some structural convergence at the mo-lecular level regarding the blue-green algae, the Archaea, the Enterobacteriaceae and the animals, but no functional correlation can be made at this time. The relationship be-tween these contours and the structure/function of proteins needs to be verified using X-ray crystal analysis, enzyme kinetics, etc. Since there is a large production of superoxide in the process of photosynthesis, testing levels of photo-inhibition on various blue-green algae, which may have evolved to different exposures to light,vs.HCA, might be one possible study.
From the standpoint of phylogenetic analysis, the HCA only provides a distance matrix without parameters or statistics to check for accuracy or reproducibility. At the same time, trees based on HCA for the MnSOD proteins follow closely enough those based on the evolutionary his-tory, so that one must wonder about the reason(s) for the noticeable deviations from this relationship.
Acknowledgments
This work was supported by National Natural Science Foundation of China (No. 31302036), Ph.D. Programs Foundation of Ministry of Education of China (No. 20110182120008), Fundamental Research Funds for the Central Universities (No. XDJK2011C027), and China Scholarship Council (No. 201206995026). We appreciated the assistance of Drs. Wei Huang and Ying Wang in this re-search.
References
Abascal F, Zardoya R and Posada D (2005) ProtTest: Selection of best-fit models of protein evolution. Bioinformatics 21:2104-2105.
Alscher RG, Erturk N and Heath LS (2002) Role of superoxide dismutases (SODs) in controlling oxidative stress in plants. J Exp Bot 53:1331-1341.
Belinky PA, Goldberg D, Krinfeld B, Burger M, Rothschild N, Cogan U and Dosoretz CG (2002) Manganese-containing superoxide dismutase from the white-rot fungus Phanero-chaete chrysosporium: Its function, expression and gene structure. Enzyme Microb Tech 31:754-764.
Ciccarelli FD, Doerks T, von Mering C, Creevey CJ, Snel B and Bork P (2006) Toward automatic reconstruction of a highly resolved tree of life. Science 311:1283-1287.
Frealle E, Noel C, Nolard N, Symoens F, Felipe MS, Dei-Cas E, Camus D, Viscogliosi E and Delhaes L (2006) Manganese superoxide dismutase based phylogeny of pathogenic fungi. Mol Phylogenet Evol 41:28-39.
Fridovich I (1995) Superoxide radical and superoxide dismutases. Annu Rev Biochem 64:97-112.
Gaboriaud C, Bissery V, Benchetrit T and Mornon JP (1987) Hy-drophobic cluster analysis: An efficient new way to compare and analyse amino acid sequences. FEBS Lett 224:149-155. Guan Y, Hickey MJ, Borgstahl GE, Hallewell RA, Lepock JR,
O’Connor D, Hsieh Y, Nick HS, Silverman DN and Tainer JA (1998) Crystal structure of Y34F mutant human mito-chondrial manganese superoxide dismutase and the func-tional role of tyrosine 34. Biochemistry 37:4722-4730. Guindon S and Gascuel O (2003) A simple, fast, and accurate
al-gorithm to estimate large phylogenies by maximum likeli-hood. Syst Biol 52:696-704.
James TY, Kauff F, Schoch CL, Matheny PB, Hofstetter V, Cox CJ, Celio G, Gueidan C, Fraker E, and Miadlikowska J,et al. (2006) Reconstructing the early evolution of Fungi using a six-gene phylogeny. Nature 443:818-822.
Lartillot N, Lepage T and Blanquart S (2009) PhyloBayes 3: A Bayesian software package for phylogenetic reconstruction and molecular dating. Bioinformatics 25:2286-2288. Lemesle-Varloot L, Henrissat B, Gaboriaud C, Bissery V, Morgat
A and Mornon JP (1990) Hydrophobic cluster analysis: Pro-cedures to derive structural and functional information from 2-D-representation of protein sequences. Biochimie 72:555-574.
Maddison DR and Maddison WP (2000) MacClade 4: Analysis of Phylogeny and Character Evolution. Version 4.03. Sinauer Associates, Sunderland, MA.
Munzner T, Guimbretiere F, Tasiran S, Zhang L and Zhou Y (2003) TreeJuxtaposer: Scalable tree comparison using Fo-cus+ Context with guaranteed visibility. ACM Transact Graphics 22:453-462.
Natvig DO, Sylvester K, Dvorachek WH and Baldwin JL (1996), Superoxide dismutases and catalases. In: Brambl R and Marzluf GA (eds) Biochemistry and Molecular Biology. Springer-Verlag, Berlin, pp 191-209.
Rozas J, Sanchez-DelBarrio JC, Messeguer X and Rozas R (2003) DnaSP, DNA polymorphism analyses by the coalescent and other methods. Bioinformatics 19:2496-2497.
Swofford DL (2002) PAUP: Phylogenetic Analysis Using Parsi-mony. Version 4. Sinauer Associates, Sunderland, MA. Tamura K, Dudley J, Nei M and Kumar S (2007) MEGA4:
Molec-ular Evolutionary Genetics Analysis (MEGA) software ver-sion 4.0. Mol Biol Evol 24:1596-1599.
Thompson JD, Gibson TJ, Plewniak F, Jeanmougin F and Higgins DG (1997) The CLUSTAL_X windows interface: Flexible
strategies for multiple sequence alignment aided by quality analysis tools. Nucleic Acids Res 25:4876-4882.
Whelan S and Goldman N (2001) A general empirical model of protein evolution derived from multiple protein families us-ing a maximum-likelihood approach. Mol Biol Evol 18:691-699.
Woodcock S, Mornon JP and Henrissat B (1992) Detection of sec-ondary structure elements in proteins by hydrophobic cluster analysis. Protein Eng 5:629-635.
Xiang H, Pan G, Vossbrinck CR, Zhang R, Xu J, Li T, Zhou Z, Lu C and Xiang Z (2010) A Tandem Duplication of Manganese Superoxide Dismutase in Nosema bombycis and Its Evolu-tionary Origins. J Mol Evol 71 1-14.
Yang Z (1997) PAML: A program package for phylogenetic anal-ysis by maximum likelihood. Comput Appl Biosci 13:555-556.
Supplementary Material
The following online material is available for this article: Figure S1 C Bayesian tree for MnSOD proteins.
Figure S2 - Maximum Likelihood tree for MnSOD proteins. Figure S3 - Neighbor Joining tree for MnSOD proteins. Figure S4 - Maximum Parsimony tree for MnSOD proteins. This material is available as part of the online article from
http://www.scielo.br/gmb.
Associate Editor: Fabrício Rodrigues dos Santos