www.the-cryosphere.net/10/1449/2016/ doi:10.5194/tc-10-1449-2016
© Author(s) 2016. CC Attribution 3.0 License.
Coastal dynamics and submarine permafrost in shallow water
of the central Laptev Sea, East Siberia
Pier Paul Overduin1, Sebastian Wetterich1, Frank Günther1, Mikhail N. Grigoriev2, Guido Grosse1, Lutz Schirrmeister1, Hans-Wolfgang Hubberten1, and Aleksandr Makarov3
1Alfred Wegener Institute Helmholtz Center for Polar and Marine Research, Potsdam, Germany 2Mel’nikov Permafrost Institute, SB RAS, Yakutsk, Russia
3Arctic and Antarctic Research Institute, St. Petersburg, Russia Correspondence to:Pier Paul Overduin ([email protected])
Received: 13 May 2015 – Published in The Cryosphere Discuss.: 17 July 2015 Revised: 2 June 2016 – Accepted: 3 June 2016 – Published: 12 July 2016
Abstract.Coastal erosion and flooding transform terrestrial landscapes into marine environments. In the Arctic, these processes inundate terrestrial permafrost with seawater and create submarine permafrost. Permafrost begins to warm un-der marine conditions, which can destabilize the sea floor and may release greenhouse gases. We report on the transi-tion of terrestrial to submarine permafrost at a site where the timing of inundation can be inferred from the rate of coast-line retreat. On Muostakh Island in the central Laptev Sea, East Siberia, changes in annual coastline position have been measured for decades and vary highly spatially. We hypothe-size that these rates are inversely related to the inclination of the upper surface of submarine ice-bonded permafrost (IBP) based on the consequent duration of inundation with in-creasing distance from the shoreline. We compared rapidly eroding and stable coastal sections of Muostakh Island and find permafrost-table inclinations, determined using direct current resistivity, of 1 and 5 %, respectively. Determina-tions of submarine IBP depth from a drilling transect in the early 1980s were compared to resistivity profiles from 2011. Based on borehole observations, the thickness of unfrozen sediment overlying the IBP increased from 0 to 14 m be-low sea level with increasing distance from the shoreline. The geoelectrical profiles showed thickening of the unfrozen sediment overlying ice-bonded permafrost over the 28 years since drilling took place. We use geoelectrical estimates of IBP depth to estimate permafrost degradation rates since in-undation. Degradation rates decreased from over 0.4 m a−1 following inundation to around 0.1 m a−1at the latest after 60 to 110 years and remained constant at this level as the
du-ration of inundation increased to 250 years. We suggest that long-term rates are lower than these values, as the depth to the IBP increases and thermal and porewater solute concen-tration gradients over depth decrease. For the study region, recent increases in coastal erosion rate and changes in ben-thic temperature and salinity regimes are expected to affect the depth to submarine permafrost, leading to coastal regions with shallower IBP.
1 Introduction
Submarine permafrost refers to solid earth material below modern sea level that has perennial temperatures below 0◦C. It contains and traps significant amounts of methane and or-ganic carbon, which may be released to the atmosphere dur-ing permafrost warmdur-ing and thawdur-ing (McGuire et al., 2009), if it is not oxidized before it reaches the seabed (Overduin et al., 2015). Cold sediment temperatures stabilized by shelf permafrost extend the gas hydrate stability zone (Dallimore and Collett, 1995) and the frozen sediment may limit gas dif-fusion into the water column and atmosphere (Shakhova and Semiletov, 2007). Despite its importance, little of what we know about submarine permafrost distribution and temper-ature is based on direct observation, especially on the East Siberian shelves, which make up over 80 % of the potentially permafrost-affected arctic shelf area (Brown et al., 2001).
rising sea levels following the last glacial period. Even to-day, rapid coastal retreat along the ice-rich coastline of the Laptev and East Siberian shelf seas causes about 10 km2 of land loss annually (Grigoriev, 2008). Deglaciation af-ter the Last Glacial Maximum led to sea-level rise in the Laptev Sea region more than 10 times as rapid as mod-ern rates (Bauch et al., 2001), inundating most of the more than 1.5 million km2East Siberian shelf region within several thousand years. Both processes (coastal erosion and sea-level rise) covered cold (less than −2◦C at the seasonal damp-ing depth) and thick (hundreds of metres) permafrost with seawater and seasonal sea ice, separating it from the cold air with mean annual temperatures of less than −10◦C. In
the coastal zone (shallower than 10 m) of the Laptev Sea, bottom temperatures currently range from 1.6◦C in
sum-mer to −1.4◦C in winter (Dmitrenko et al., 2011). After
inundation, submarine permafrost began to equilibrate ther-mally with benthic temperatures. This temperature increase resulted in warming and thawing of permafrost below the seabed (Lachenbruch, 1957). Thawing also occurred due to penetration of saltwater into the seabed, which lowered the freezing point of the sediment’s porewater. Thus, mod-ern submarine permafrost can have temperatures below 0◦C but can contain little or no ice. What is generally observed, by geophysical methods or direct observations, in sediment cores, is the depth of ice-bonded permafrost (IBP) below the sea floor (which is equivalent to the thickness of the overlying unfrozen sediment). Direct current resistivity and controlled source electromagnetic techniques for the inves-tigation of submarine permafrost have been established in a number of studies (Barnes, 1963; Constable, 2010; Corwin, 1983; Sellmann et al., 1989). Laboratory measurements of the bulk electrical properties of frozen porous media show the effect of ice content and thus saline porewater on cal resistivity (Overduin et al., 2012). Sediment bulk electri-cal resistivity increases by orders of magnitude between ice-bonded, freshwater sediment and ice-free, saline sediment (Scott et al., 1990), making it suitable for the detection of the ice-bonded permafrost table.
Benthic temperature and salinity control warming of the sea floor and the rate of salt penetration into the sediment column, but there are a number of processes active in shal-low water near the coastline that additionally affect per-mafrost following inundation. Sedimentation of eroded ma-terial, sediment resuspension and transport by wave action and by currents and the entrainment of suspended material and sediment in sea ice are important in determining initial rates of degradation in water depths where wave cycles and ice gouging can mix and erode the sea bed. Where the water depth is less than the maximum sea-ice thickness, bottom-fast ice (BFI) forms (Solomon et al., 2008). Sea ice has a higher thermal conductivity than seawater, and BFI thermally couples the sea floor to the cold winter air temperatures, which can lead to seasonal freezing of the sediment and the injection of brines into the sediment (Harrison, 1982). Since
Figure 1. (a)The location of the study site in the central Laptev Sea, East Siberia, Russia.(b)The topography of Muostakh Island and the surrounding bathymetry. The reference geodetic point and borehole locations are shown by diamonds and the three geoelectric profiles by black lines. The blue line surrounding the island indi-cates the position of the coastline in 1983, the red line the coastline in 2010.
the rate of coastal erosion affects sediment flux, and therefore bathymetry, submarine permafrost degradation rates follow-ing inundation are related to coastal erosion.
Our objective is to use inundation periods inferred from remote sensing, geophysical surveys and borehole observa-tions of IBP to investigate the relaobserva-tionship between coastal erosion and submarine permafrost degradation beneath the shoreface.
2 Study area
Muostakh Island (71.58◦N, 130.01◦E), a sliver of land about
Com-0 5 10 15 20 25
Mean coastal
erosion rate [m a
-1]
1950 1960 1970 1980 1990 2000 2010 Time [a]
Figure 2.The mean annual erosion rate at the northern cape of Mu-ostakh Island has been measured by determination of the position of the upper edge of the bluff relative to a geodetic point (measure-ments are indicated as mean values over a period) since 1951. The greater the absolute value, the higher the erosion rate (reproduced from Grigoriev et al. (2009) for data up to 2008).
plex (IC) deposits. IC deposits are ice-rich (Muostakh Island is composed of 87 % ground ice by volume; Günther et al., 2015), polygenetic in origin and characterized at the ground surface by the polygonal network of ice wedges formed over thousands of years by meltwater infiltration into cold win-ter thermal contraction cracks (Schirrmeiswin-ter et al., 2011b). Coastal thermo-erosion on Muostakh Island varies widely in intensity (from close to 0 to over 25 m a−1) over a relatively
small region (Grigoriev et al., 2009; Günther et al., 2015). The spatial variability of coastal retreat rates along the is-land’s coastline offers an opportunity to investigate its influ-ence on submarine permafrost development while other as-pects of environmental forcing are similar.
IC coastlines are prevalent throughout much of the Laptev and East Siberian seas. On Muostakh Island, IC deposits are exposed along the east coast from below sea level up to the island’s surface. Much of the Chukchi and Beaufort seas’ coastlines are similarly ice-rich and can be expected to be subject to the same mechanisms of geomorphologic change in response to shifts in environmental drivers of coastal dy-namics (Ping et al., 2011). Regionally, relevant shifts in the energy and water balances at the land–atmosphere interface (Boike et al., 2013), increases in Lena River discharge (Fe-dorova et al., 2015) and increases in the duration of open wa-ter and coastal erosion (Günther et al., 2015) have recently been observed, matching similar circumpolar observations (Barnhart et al., 2014).
3 Materials and methods
3.1 Geodetic measurements of coastline position Coastal change rates on Muostakh Island have been esti-mated since the early 1950s by combining on-site and re-mote sensing methods (Fig. 2; Grigoriev et al., 2009). A geodetic benchmark was established near the northern end of the island in 1950. Measurements were made at
irregu-lar intervals thereafter, by measuring the distance from the geodetic benchmark to the top of the coastal bluff along vari-ous bearings, either with measuring tape or a theodolite. The coastline positions reported here were measured as the po-sition of the upper edge of the coastal bluff along a bearing from the geodetic benchmark and the signal tower on Cape Muostakh, at the southern end of the Bykovsky Peninsula. Since there were unrecorded differences from year to year in how measurements were carried out, it is difficult to as-sess uncertainty in the measurements. Sources of uncertainty include determination of the direction in which coastal po-sition was measured, small differences in time of year for measurements and difficulty in safely reaching the cliff edge. We conservatively estimate the measurements to be better than±0.5 m. Between measurements in 2010 and 2011, the geodetic reference point was toppled by coastal erosion. For purposes of continuity, a network of survey points was estab-lished by theodolite in 2011 immediately thereafter to make a continuation of the measurement series possible. Ground control points were established to align field observations with remote sensing data (Günther et al., 2013).
3.2 Temperature and electrical resistivity
Benthic temperature and electrical conductivity were recorded using a bottom-moored conductivity (±0.1 mS cm−1), temperature (±0.2◦C) and water depth
(±0.2 %) (CTD) data logger. The CTD data logger (Minilog-ger, UIT Umwelttechnik GmbH) was mounted on a metal plate and deployed with two 50 m cables attached to anchors. By dredging with a cat’s claw anchor after deployment, the cables could be snagged and the data logger recovered. The data logger was deployed at 71.672◦N, 129.996◦E in 7.2 m
water depth on 10 August 2008, just outside of the north-eastern corner of the frame for Fig. 2. Data were collected hourly between 1 September 2008 and 31 August 2009. Although electrical conductivity values were measured and recorded, the inverse value (electrical resistivity) is reported here for comparison to the results of the geoelectrical surveys.
3.3 Core and borehole data
entering the borehole. Temperature and geochemical data are summarized by Kunitsky (1989), while granulometric, cry-olithologic and mineralogic data are presented by Slagoda (1993, 2004). Results from these publications, originally in Russian, are made available here to a non-Russian reader-ship. Observations made during drilling from the land-fast ice in spring and during laboratory investigation of the cores included sediment temperature and lithology and porewa-ter salinity. Borehole temperatures were measured in 1982 and 1983 using a thermistor string and a voltmeter. Sediment porewater from cores was analysed for total dissolved solids, which was converted to electrical resistivity based on the re-sistivity of a sodium chloride solution:
R=0.55·TDS−0.97, (1) whereRis the electrical resistivity inm and TDS denotes the total dissolved solids in grams per 100 g solution. Loca-tions of boreholes, their depths, water depth and the depth of the unfrozen/frozen interface beneath sea level are summa-rized in Table 1.
3.4 Electrical resistivity and time of inundation
Geoelectric surveys of submarine apparent resistivity col-lected on 21–24 August 2011 were combined with bathymetry measurements to invert for sub-bottom sediment resistivity, which gives an indication of the depths of saline sediment and of the underlying ice-bonded submarine per-mafrost. The results from three surveys are presented here, two profiles of 1.5 km length from the eastern and western coasts of the northern cape of Muostakh Island, as well as a profile of 4 km length along the historical borehole profile (Fig. 1). The sub-bottom apparent electrical resistivity pro-files were collected using an IRIS Syscal ProTMDeep Ma-rine system. Voltages were measured around an electrical current injection dipole of 10 m size, using a floating elec-trode streamer towed behind a small boat. The injection and potential electrodes were stainless steel plates (10×30 cm). Electrical potential was measured across 10 channels span-ning between 20 and 110 m. Electrode position (relative to a GPS aboard the boat), the injection current, measured elec-trode pair potentials and water depth (using an echo sounder with better than±0.1 m resolution attached to the boat) were recorded at intervals of at least 2 m as the array was towed. We used RES2DINVTM software to invert the apparent re-sistivity data via least-squares inversion for floating elec-trodes with a modelled water-layer resistivity, allowing for a sharp change in modelled resistivity across sediment surface. Model resistivity was smoothed to produce reasonable varia-tions in the resistivity values. Prior to inversions, data values were inspected graphically and less than 0.1 % of collected apparent resistivities were identified as outliers and removed. Inversions required fewer than five iterations in order to reach better than 5 % root mean square error between modelled and observed resistivity. Relating estimated sediment resistivity
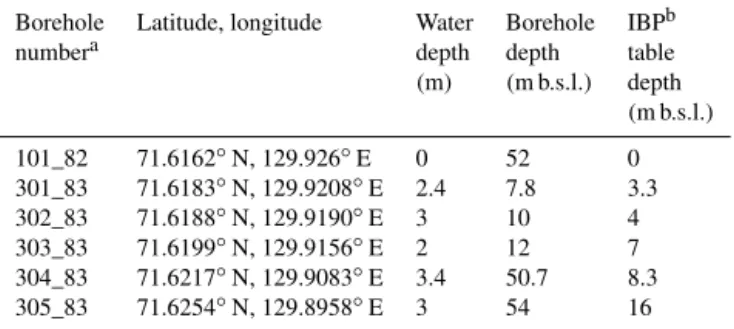
Table 1.Borehole characteristics.
Borehole Latitude, longitude Water Borehole IBPb
numbera depth depth table
(m) (m b.s.l.) depth
(m b.s.l.)
101_82 71.6162◦N, 129.926◦E 0 52 0 301_83 71.6183◦N, 129.9208◦E 2.4 7.8 3.3
302_83 71.6188◦N, 129.9190◦E 3 10 4 303_83 71.6199◦N, 129.9156◦E 2 12 7
304_83 71.6217◦N, 129.9083◦E 3.4 50.7 8.3 305_83 71.6254◦N, 129.8958◦E 3 54 16 aData from Kunitsky (1989) and Slagoda (1993, 2004).bIBP: ice-bonded permafrost.
to ice content requires either measurements on sampled sedi-ment or some rather arbitrary assumptions. No resistivities were measured on samples from this site, since no recent drilling took place. Some literature values for sediment re-sistivity as a function of temperature, salinity and ice content exist. Kang and Lee (2015), for example, show an increase in electric resistivity on freezing for silt–sand mixtures with 40 % saturation from around 100m to over 300 km. For 100 % saturated mixtures with saline porewater, the resistiv-ities can be expected to be around 4 to 10 times lower (Kang and Lee, 2015). Laboratory measurements of saline silty and sandy sediment, similar in grain size distribution to those at Muostakh Island, show that ice is present in the sediment for bulk resistivities over 10m (Overduin et al., 2012), al-though the boundary between ice-free and ice-bonded sedi-ment may not be sharply defined, so that resistivity changes gradually with depth. We consider that any sand–silt mixture that is ice-bonded with fresh porewater, as is the case here based on the porewater concentrations from the drilling sam-ples, and consistent with previous observations of submarine permafrost in the Laptev Sea, will have a resistivity not lower than 10m, and probably higher than 100m. This assump-tion is also based on laboratory measurements of bulk resis-tivity as a function of temperature and salinity for marine sediments which show that the change in bulk sediment re-sistivity from an unfrozen seawater-saturated sediment to a frozen ice-saturated sediment corresponds to a jump in re-sistivity from less than 10 to over 100m (Frolov, 1998; King et al., 1988; Overduin et al., 2012). Uncertainties in IBP depth estimated from resistivity profiles thus correspond to the depth range of the bulk sediment resistivity increase from 10 to 100m.
Mean submarine permafrost degradation rate was calcu-lated as the quotient of the depth to IBP (zpf) and the time
of erosion (t0; time of inundation).zpf was either observed
erosion observations based on a CORONA KH-4B satellite image dating from 24 July 1969, a HEXAGON image from 17 July 1975 and a SPOT-4 image taken on 1 July 2001. Af-ter stitching image tiles of the CORONA and HEXAGON images and pansharpening of the SPOT scene, each image was orthorectified to mean sea level using specific sensor models. In contrast to on-site measurements of the upper coastal bluff edge, we digitized the cliff bottom line as the location where inundation occurs in the form of thermo-abrasion (Are, 1988). For consistency with the 1983 drilling campaign, as an important baseline, the coastline of 1983 was reconstructed based on an interpolation between digi-tized coastlines from high-resolution aerial and satellite im-ages (1951, 1964, 1969, 1975, 2001, 2010 and 2011). Taking digitized coastlines as isolines of equal time, we estimated the time of inundation (t0) at the location of each sounding in 2011. Given a mean coastal erosion rate of 1.8 m a−1on
Muostakh (Günther et al., 2015), interpolation was done to a raster size of 2 m, corresponding to a resolution of at least 1 year. However, our geoelectric transects are concentrated around the northern cape, where more rapid erosion takes place, resulting in an almost monthly resolution. For two of the transects, some of the geoelectric measurement sites lay within the region flooded by seawater since 1951 (83 sound-ings from the borehole profile and 337 from the eastern tran-sects). We calculated the period of inundation (tsub) at the location of each sounding as
tsub=tobs−t0, (2)
wheretobsis the time of observation (2011) andt0the time of inundation raster cell value. This yields a mean rate of submarine permafrost degradation for this period of
rdeg= zpf
tsub. (3)
Uncertainties in degradation rates derive from uncertainties intsub andzpf. The former are better than 1 year, based on the resolution of the shoreline rasterization. For the set of permafrost observations within the region for which remote sensing data exist, the positions of zpf estimates for degra-dation rates are not based on extrapolation of coastal erosion rates from the current coastline, but on interpolation of coast-line position between observations. Variations of coastal ero-sion rate on shorter timescales (the longest averaging period was 26 years between 1975 and 2001) may have occurred as observed by Lantuit et al. (2011) on the Bykovsky Peninsula but cannot be quantified for Muostakh. Uncertainty in period of inundation and degradation rate was calculated by assum-ing double the mean long-term erosion rate for the period prior to 1951 for each borehole position. Uncertainty inzpf
for borehole determinations was set at 0.5 m to allow for tidal variations (<0.3 m), sea level rise and uncertainty in deter-mining core sediment depth in the borehole (estimated at bet-ter than 0.1 m). The uncertainty inzpfderived from resistivity
profiles corresponds to the uncertainty of the depth of inves-tigation of the geoelectric method. We have chosen a range of resistivities to cover the transition from unfrozen to frozen sediment (10 to 100m), so that the range of depths associ-ated with this transition corresponds to the uncertainty in the determination ofzpf. Nautical charts of the early 1980s
show-ing points of bathymetry measurements every 500 m and iso-baths with an equidistance of 2 m were digitized and interpo-lated for the coastal waters around Muostakh Island, in order to account for shoreface profile changes.
4 Results
4.1 Shoreface morphology
Figure 1 shows coastlines of Muostakh Island from two dif-ferent points in time. Based on data from Grigoriev et al. (2009), the mean erosion rates for the northern cape of Muostakh Island for the period of record (1951–2014) was 10.7 m a−1with variations between 2 and 25 m a−1(Fig. 2). This value includes multiple-year periods for which erosion rate was determined using remote sensing data. Observations between 1995 and 2014 were conducted in the field and give a mean erosion rate of 10.2 m a−1. Longer term coastal ero-sion rates of over 10 m a−1 decreased to less than 5 m a−1
in 1984 and then fluctuated between 2 and 10 m a−1
un-til 2006. In 2006/2007, rates at the northern cape increased to 25 m a−1. The three periods with the most rapid rates have
been observed in the past 9 years (2006–2007, 2007–2009, 2010–2011). Rates of coastal retreat along the eastern shore of the island reported by Günther et al. (2015) confirm re-cent higher rates of erosion relative to the long-term means. In that context, the rates shown here are more indicative of the increased rates of land loss at the exposed cape than of changes in erosion rates for the island as a whole. For ex-ample, the western coast of Muostakh Island has had mean coastal erosion rates of less than 1 m a−1(Fig. 1) for the past 60 years. The mean annual rates of erosion where the dig-itized coastlines intersected with the geoelectric profiles on the western and north-eastern sides of the island over the pe-riod 1982–2011 were 0.5 and 6.5 m a−1, respectively,
result-ing in the inundation of 14 m (western shore) and over 180 m (eastern shore) of land over this period.
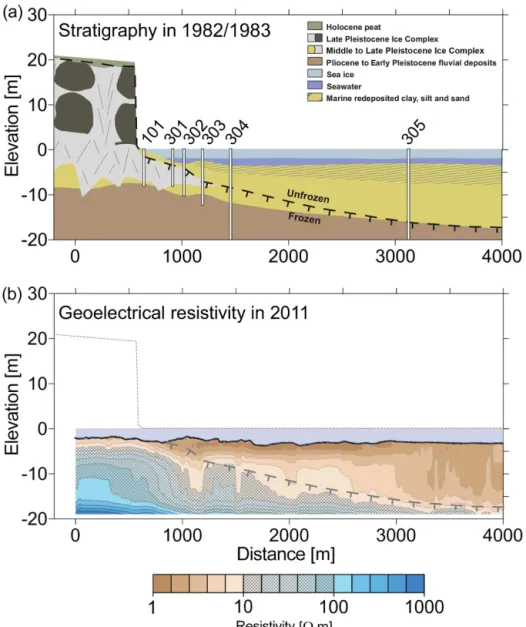
re-Figure 3.A comparison of the results of the drilling expedition in 1982 and 1983 with the inverted resistivity in 2011. The stratigraphy in the upper figure is based on the coastal exposures and the interpolation of borehole sediment stratigraphy, redrawn from Slagoda (2004). A range of resistivities (from 10 to 100m), inverted from measured apparent resistivities, is indicated with crosshatching on the resistivity cross section in the lower figure. The position of the IBP interpolated from the boreholes is repeated on the lower figure (dashed grey line) for reference. The vertical exaggeration is 37 times.
treat resulted in the erosion of the coastal bluff and eroded the shoreface profile, increasing water depths by up to 3 m. Changes in the bathymetric profile over 30 years from about 1.8 km out to 4 km were less than 0.4 m and probably within the uncertainty generated by interpolation of the historical bathymetry and by changes in water level. According to Ku-nitsky (1989), in 1983, water shallower than the thickness of the annual sea-ice cover extended out to around 150– 200 m from the shore, corresponding to the extent of the BFI zone, which is separated from land-fast ice by cracks in sea ice. The intertidal zone exposed at low water levels and submerged at high water levels resulted in a foreshore zone width of up to 180 m, where sea ice freezes to the
bottom and isolated pockets of saline water may collect up to 41 ‰(Kunitsky, 1989). Along the drilling profile, the un-frozen sediment layer increased in thickness from this border towards the sea, while landwards and in sand bars a season-ally frozen layer developed (Fig. 3, upper profile). In 2011, the mean depth along the entire profile was 2.76 m (Fig. 3, lower profile).
4.2 Water temperature and resistivity
0.1 1 10 100
Resistivity [
W
m]
0 10
Temperature [°C]
S O N D J F M A M J J A
2008 2009
(a) Bottom water
(b) Sediment porewater
-12 -8 -4 0
Temperature [°C]
0 10 20
Resistivity [Wm]
Core 304 01.06.1983
-12 -8 -4 0
0 10 20
Core 305 01.06.1983 -12 -8 -4 0
50 40 30 20 10 -0
Depth [m bsl]
0 10 20
Core 101 21.05.1982
unfrozen frozen
frozen
unfrozen frozen =
IBP
IBP
IBP
Figure 4.Water electrical resistivity and temperature are shown for (a)bottom water measured for the period 1 September 2008–31 Au-gust 2009 in 7.2 m water depth and(b)sediment porewater (based on Eq. 1) from cores recovered from boreholes 101, 304 and 305 on the dates indicated (Figs. 1 and 3; Table 1); temperature data are shown by grey lines, and circles and electrical resistivity data are shown by black lines and crosses.
of the island (Günther et al., 2013) varied strongly season-ally (Fig. 4a). Bottom water temperature dropped from over 8◦C on 1 September to negative temperatures by 16 Octo-ber 2008. During most of this period, bottom water resistiv-ity also fell, from peak values of 35m to less than 2m. At the end of the period of observation, from 28 July until the end of August in 2009, variations in temperature and re-sistivity fell within a similar range of values. After the late summer cooling period, from mid-October until the begin-ning of July, temperatures are below−0.8◦C and resistivity
is below 3m. In June, bottom water began to freshen at temperatures below−1◦C, eventually reaching summer
val-ues. In the early summer, following break-up of the sea ice, high resistivity (>15m) bottom water varied in tempera-ture, reaching peak values of 12◦C.
Beneath the sea ice, from the end of October until af-ter mid-May, bottom waaf-ter electrical resistivity was below 1.7m (i.e. above a conductivity of 6 mS cm−1), whereas the influence of the Lena River discharge increased this value up to over 10m (corresponding to electrical con-ductivity below 1 mS cm−1) for the early summer (June). In
July, the freshwater at the sea bed warmed to over 10◦C.
Winter resistivity varied less than 0.5m, whereas open-water season resistivity (July to mid-October) varied between 0.1 and 30m. The mean annual bottom water tempera-ture was 2.1◦C, and the mean annual bottom water resistiv-ity was 10m (corresponding to electrical conductivity of 0.09 mS cm−1).
The water in Buor Khaya Bay is generally stratified, with brackish water overlying colder saltier water. This position of this interface between the layers changes with time, in re-sponse to varying fluvial discharge rates and sea ice melting and freezing, and as a result of storm-generated mixing (Gün-ther et al., 2013) but is usually lower than 7 m b.s.l. in sum-mer. Geoelectric resistivity surveys took place in shallow wa-ter not subject to stratification. Seven surface wawa-ter samples were collected during surveys on 20 and 24 August 2011. Their electrical conductivity was measured on the same day and ranged between 0.6 and 1.7m. Based on these values, we used values of 0.65, 0.98 and 0.90m for the western, drilling and eastern profiles, respectively.
4.3 Permafrost properties
The permafrost of Muostakh Island belongs to Late Pleis-tocene Yedoma IC deposits that accumulated in the region between at least 46.8 and 19.5 ka BP based on radiocarbon ages (Schirrmeister et al., 2011a). It is overlain by a Holocene peat cover (Fig. 3). The IC is characterized by the occur-rence of syngenetic ice wedges embedded in ice-rich silts and sands, peat horizons and a considerable overall amount of organic carbon (total organic carbon content of up to 5 % by weight; Schirrmeister et al., 2011a). The oldest IC de-posits lie up to 10 m below modern sea level at Muostakh Island and are underlain by silts, sands and gravels inter-preted as fluvial deposits of Pliocene to Early Pleistocene age (Fig. 3; Slagoda, 2004). Syngenetic ice wedges of for-mer polygon tundra are up to 5 m wide and up to decame-tres deep. Intrasedimentary ice occurs in horizontal to sub-horizontal ice bands, ice lenses and ice cement. Ice wedges defined as macro ground ice by Günther et al. (2015) consti-tute up to 44±4.6 vol %. Intrasedimentary ice adds another 43 vol % to the total ice content and sums up to 87 vol % (Günther et al., 2015). Along both sides of the island, this high ground ice content renders the coastline susceptible to thermo-erosion. Thermokarst mounds (baidzherakhs) are left over when ice wedges melt, leaving these former polygon centres of the Yedoma IC preserved on the coastal bluff. They exist on both coasts of Muostakh Island, which is underlain everywhere by Yedoma and shaped by Holocene thermokarst features, including an alas (former lake basin) that intersects the western coast midway up the island (Fig. 5).
Figure 5.Photographs of the western (top panel) and eastern (bot-tom panel) coastal bluffs show similarities in the height (∼22 m) and morphology. The presence of thermokarst mounds (baidzher-akhs) characterizes both coasts, but the comparatively stable west-ern baidzherakhs are completely vegetated, whereas pioneer species are sparsely established on the eastern baidzherakhs. The top of the eastern coastal bluff has overhanging vegetative mats, below which melting polygon ice wedges are exposed. On the western coast, ice wedges have already melted to at least the depth of annual ground thaw.
the interplay of thermo-denudation and thermo-abrasion effi-ciently erodes the north-eastern coast while the western coast appears almost stable. Strong winds occur mainly during the winter season in an S to SW direction when the sea is ice-covered (Günther et al., 2015) and have therefore no impact on coastal retreat. Due to its location close to the mainland coast, the maximum fetch from S to SW during the sea-ice-free period is less than 50 km, while the fetch from N to NE is nearly unlimited (Günther et al., 2015). The latter is of im-portance during the sea-ice break-up when wind events pre-vail in N to NE directions, and cause rising water level and constant heavy swells that promote marine abrasion (thermo-abrasion).
4.4 Borehole observations
In the following analysis, we report borehole observations and geoelectric surveys with reference to depths or elevations relative to sea level. Since sea level changes over time, these results are not directly comparable. However, tidal variations around Tiksi are generally less than 10 cm, although storm surges can lead to larger changes in sea level, up to±0.6 m. The net change in mean annual sea level recorded three times per month at the Tiksi tide gauge between May 1983 and August 2011 was 0.12 m (data from Arctic and Antarctic Re-search Institute, St. Petersburg, accessed at www.whoi.edu/ science/po/arcticsealevel/laptev.html on 16 March 2015).
Borehole temperatures are available for the cores 101, 304 and 305 obtained after drilling in May 1982 and June 1983 (Fig. 4b; Kunitsky, 1989). The onshore core 101 shows the cold-temperature regime of terrestrial permafrost with almost stable ground temperatures of about−9◦C at the time of measurement that decrease slightly due to the seasonal win-ter signal in the upper 10 m of the sediment (Fig. 4b). Both offshore cores 304 and 305 have temperatures that increase upwards from about−2◦C at the borehole bottoms to 0◦C
at the sediment surface. Saline seawater lowers the porewa-ter freezing temperature and decreases the resistivity in the upper part of the profile (Fig. 4b). The boundary between IBP and ice-free (unfrozen) permafrost lay at a depth of 8.3 m b.s.l. in core 304 and 16 m b.s.l. in core 305. No bound-ary was encountered in core 101, which was frozen through-out. The IBP in the offshore boreholes was up to 7◦C warmer
than temperatures measured in borehole 101 at the shoreline. 4.5 Profiles of electrical resistivity and bathymetry
Figure 6.Inversions of the georesistivity of the eastern and western geoelectric profiles (positions shown in Fig. 1).
drilling profile (Fig. 3) shows more variability with distance from the coastline than in either of the other profiles. There are two pronounced dips of more than 4 m, between borehole locations 302 and 303 and beyond borehole location 304. Deeper contour lines no longer show this variability in depth. The 25m dips from 8.4 to 16.8, 17.0, 16.0, 17.9 and to more than 19 m depth at the borehole locations. Differences between the position of the IBP observed in sediment recov-ered from the boreholes and the 25m (normalized to pe-riod of inundation) increase from 0.3 m a−1at borehole 101
to 0.5 m a−1 at boreholes 301 and 302, and then decrease
further offshore to 0.3 m a−1 at boreholes 303 and 304 and
to 0.1 m a−1 at borehole 305. If we arbitrarily choose the 25m as a proxy for IBP, then these rates correspond to sub-marine permafrost degradation rates. Choosing other values would give somewhat different rates, but the trend observed would be the same.
For geoelectric soundings within the 1951 coastline, we linearly interpolated coastline positions from remote sensing
0 0.2 0.4 0.6 0.8 1
Deg.
rate
[m
a
-1]
Eastern profile Drilling profile Boreholes
0 50 100 150 200 250 300 350 400
Estimated degradation [years]
101
304 305
"
(10 / 100 Wm) > /
(10 / 100 Wm)
> /
Figure 7. Permafrost degradation rate inferred from geoelectric soundings and their positions, for the eastern and borehole geo-electric profiles and for three boreholes indicated by number (dia-monds). Only soundings/boreholes located within the region eroded since 1951 are used. Degradation rates shown for 10 and 100m are indicated with crosses and circles, respectively. The hatched area corresponds to the union of the hatched areas in Figs. 3b and 6.
imagery to geoelectric sounding position to estimate the pe-riod of inundation at each sounding. Figure 7 shows inferred mean submarine permafrost degradation rates since inunda-tion as a funcinunda-tion of these periods for soundings along the drilling profile and eastern profile. Since no interim deter-minations of IBP table depth have been made since inun-dation, these degradation rates are mean rates for the pe-riod of inundation ending in 2011. Instantaneous rates of degradation at or nearer to the shoreline are probably higher. Results indicate that initial submarine permafrost degrada-tion rates following inundadegrada-tion range between 0.4 and over 1.0 m a−1 (using 10 and 100m isopleths), and that rates
decrease over time, reaching mean values between 0.1 and 0.3 m a−160 years after inundation. Assuming that the long-term erosion rate at the northern cape represents the mean rate since inundation, we can infer the duration of degra-dation for the borehole locations. In this case, the peri-ods of inundation for boreholes 101, 304 and 305 were about 28, 112 and 253 years, respectively. Rates thus inferred were 0.19, 0.10 and 0.07 m a−1(Fig. 7).
5 Discussion
5.1 Permafrost degradation following erosion
years) provides the best approximation for long-term mean annual erosion rates. The decrease in degradation rate for a prolonged period since inundation is visible in our geoelec-tric profiles as a steeper inclination of the IBP table closer to shore (Fig. 6). The length of inundation of points distal to the island are approximately 260 years on the eastern profile, and closer to 3500 years of erosion on the western profile (based on profile length of 1700 m and coastal retreat rates of 0.5 and 6.5 m a−1, respectively). Using the positions of the geoelectrical soundings for which date of inundation can be inferred, there is a decrease in the rate of degradation over time (Fig. 7). Nixon (1986) models a mean degradation rate of 0.1 m a−1after 50 years of degradation for sediments with
a freezing point of−1.8◦C, matching the observations from
the geoelectrical soundings shown in Fig. 3. Grigoriev (2008) shows a mean degradation rate of 0.05 m a−1for 12 profiles
of IBP for the Laptev and East Siberian seas, with a range between 0.01 and 0.15 m a−1. Over the long term, Nixon’s
1986 model and these results show a decrease in degradation rate to levels less than 0.1 m a−1, as the thermal and solute concentration gradients between the sea floor and the IBP ta-ble become less and less steep, decreasing fluxes of heat and salt, respectively.
Studies in Siberia and Alaska have shown that submarine permafrost degradation is most rapid following inundation, when the thickness of the unfrozen sediment layer overly-ing the IBP is small, and thermal and diffusion gradients are steepest (Are, 2003; Harrison, 1982). Slowing of degradation may also be the result of lower bulk thermal properties in the thawed sediment (Chuvilin et al., 2013). Figure 7 shows an asymptotic reduction in degradation rate as the length of inundation increases. The permafrost temperatures reported by Slagoda (2004) show warming of permafrost by almost 9◦C within the first 100 years of inundation (Fig. 4b), up to the freezing temperature of the pore space solution. Based on coastal erosion rates for a 4-year period, Molochushkin (1978) estimates that warming of the permafrost off the east-ern shore of Muostakh Island occurs at 0.4◦C a−1 over the first 10 years, but at an average rate of 0.25◦C a−1 for the first 30 years at a depth of 10 m below the sea floor.
5.2 Comparing profiles
Muostakh Island was chosen as our field site for studying submarine permafrost degradation because its coastal retreat rate varies widely within a small area, over which larger scale drivers, such as air temperature, sea-ice cover and storm events, can be assumed to be similar. Obvious differences be-tween the eastern and western coasts include the orientation of the coastline, the potential maximum fetch before each coast and the relative influence of riverine water and along-shore currents. Mean coastal retreat rates on the western and eastern shores of the island have differed by a factor of 13 for the past decades. Along both shores, thermo-abrasion of the submarine shoreface results in offshore transport of
sed-iment, creating a concave submarine profile shape from the waterline out to about 1 km from shore. In contrast, mean water depth along the drilling profile was more than 2.5 m based on bathymetry measured during geoelectric survey-ing, throughout the profile. Although we found no local sea-ice thickness data for Muostakh Island, this exceeds proba-ble maximum sea-ice thickness. Ice thickness of 2.1 m was observed within 1 km of the coastline on the eastern shore of Buor Khaya Bay at the end of winter in 2012 (Günther et al., 2013). Sediment is thermo-abraded and deposited here in roughly equal measure. Differences in IBP depth along this profile are the result of differences in the duration and/or rate of IBP degradation. Differences between the western and eastern shores may be the result not only of differing IBP degradation rates and inundation periods but also of sediment budgets. Molochushkin (1978) attributes the thicker unfrozen sediment on the western side of Muostakh Island to the ac-cumulation of marine sediment, whereas erosion of sediment determines the depth to the IBP off the eastern shoreline. The similarity of the shoreface profiles suggests that this expla-nation is not sufficient to explain differences in IBP table in-clination, however. Molochushkin and Gavrivev (1982) also present interstitial salinity profiles for two cores from posi-tions north-east of Muostakh Island (mean TDS 6.4 g/100 g: 2.6m) and west of Muostakh (mean TDS of 1.8 g per 100 g;
<0.1m), suggesting diffusion of seawater into the sedi-ment rather than deposition under marine conditions.
The shape of the IBP table along the drilling profile is more complicated and may have depended on the shape of the northern cape over time. A distance 2.5 km from the 1983 coastline (core 305, Fig. 3) has probably been sub-merged for at least 250 years based on the mean erosion rate of 10 m a−1for the period of record. Along the drilling
BFI acts as a thermal couple between the seabed and the atmosphere in winter, due to the higher thermal conductiv-ity of ice compared to seawater. This effect tends to delay permafrost degradation immediately after inundation, until bathymetry exceeds the maximum depth of winter ice thick-ness around 2 m, and the sea bed is covered by bottom wa-ter throughout the year (Oswa-terkamp, 2001). Therefore, our observations of shallower IBP in places of former sand bars suggest that submarine permafrost preservation through ther-mal coupling of BFI outpaces the degradation effect asso-ciated with elevated brine concentration and injection un-der BFI. The duration of degradation on the abscissa in Fig. 7 includes any periods of BFI formation, and can there-fore include a period of initial retardation of degradation. Molochushkin (1978) reports mean annual seawater temper-atures at Muostakh of 0.2–0.3◦C and resistivities of 10m.
Although the frequency and depth of measurements are not reported, these values are cooler than the 2.1◦C observed in
this study but have the same mean salinity.
Differences in IBP depth between the eastern and west-ern profiles may be the result of factors not observed in this study. For example, there may be systematic differences in benthic temperature and resistivity regimes on either side of Muostakh Island. We expect the sheltered western side to be less affected by the outflow of the Lena River on the east-ern side, whereas we expect greater mixing and resuspension due to wave action on the eastern side, especially when winds are from the N to NNE, and/or fetch exceeds 100 km. Such differences change boundary conditions for submarine per-mafrost and affect the degradation rate. Nonetheless, the dif-ferences in IBP depth and inclination observed on either side of the island are at least consistent with differences in rel-ative erosion rates, even if permafrost degradation rates are assumed to be similar.
5.3 Submarine permafrost degradation
Our results indicate that permafrost degradation rates at Muostakh Island are consistent with those inferred for near-shore sites elsewhere on the Siberian shelf (Overduin et al., 2007, 2015). Since we calculate a decrease in submarine per-mafrost degradation rate with increased duration of inunda-tion, most of the Siberian shelf region, which has been in-undated for longer periods, probably has lower rates than those observed here near the coastline. The degradation rates that we infer for Muostakh Island are probably typical for permafrost near the coast and the sea floor, where vertical thermal and solute concentration gradients within the sedi-ment are steeper than for most of the shelf region. Follow-ing inundation, ice content decreases throughout submarine permafrost due to warming and the consequent thaw of pore ice. Nicolsky et al. (2012) shows this as an increase in wa-ter content based on assumed freezing characwa-teristic curves. In this model, the rate of ice melt depends on a suite of conditions during and antecedent to inundation. However, at
74.5◦N, 118◦E, for example, the depth of permafrost
sat-urated to at least 50 % by ice degrades from about 25 to 200 m b.s.f. (below the sea floor), a mean rate of just below 0.01 m a−1 (Nicolsky et al., 2012). Romanovskii and Hub-berten (2001) show even lower rates of degradation of ice-bonded permafrost (defined as liquid water contents of<5 % by weight). Such slow rates of degradation make it difficult to detect changes in IBP depth. Further difficulties result from high uncertainties associated with geophysical techniques. As we observed, short-term changes in sea level and sedi-ment dynamics can also create problems for comparing mea-surements made on multi-year timescales.
The rate of coastal retreat influences the inclination of the IBP within the sediment. The IBP table inclinations along the three georesistivity profiles are consistent with a relationship between coastal retreat rate and the inclination of the IBP ta-ble. If erosion is rapid, the IBP table will tend to lie closer to the sediment surface (Fig. 8a; eastern profile). In cases where the coastal retreat rate is slow and permafrost degradation oc-curs, the inclination of the ice-bearing permafrost table will tend to be steeper (Fig. 8b; western profile). Thus, the dura-tion of inundadura-tion and distance from the coastline are linked by the rate of coastline retreat, which is variable in time.
Observations of the inclination of the IBP table perpen-dicular to the coast in the Laptev and East Siberian seas show a high degree of spatial variability (Overduin et al., 2007), probably reflecting the temporally varying intensity of the processes described (Fig. 8c). Observing subma-rine permafrost depends on direct observation by drilling, sampling and temperature measurements (Fartyshev, 1993; Rachold et al., 2007) coupled with indirect observations us-ing geophysical methods sensitive to property changes be-tween frozen and unfrozen sediment. Since the coastal zone is highly dynamic, especially during spring melt and au-tumn freeze-up, the logistics of measurements and continu-ous monitoring are difficult, requiring innovative new instru-mentation and platforms for use in shallow water.
6 Conclusions
(b) Slow coasta l erosion & permafrost degradation
(c) Both processe s active (a) Rapid coastal erosion &
permafrost degradation
Coast
Seabed
Figure 8. The relative rates of coastline retreat and permafrost degradation affect the shape of the ice-bonded permafrost (IBP) ta-ble beneath the shoreface profile sediment. In (a)rapid coastline retreat leads to an IBP table close to the sediment surface; in(b)a stable coastline leads to an IBP table that is more steeply inclined; in(c)most IBP table inclinations can be expected to reflect a com-plicated suite of factors, including temporally variable coastline re-treat, permafrost degradation rates and near-shore sediment dynam-ics.
over time. On this basis, it is likely that degradation rates for most of the Siberian shelf permafrost are less than 0.1 m a−1. We have shown that the coastal zone can produce estimates of degradation rates and that coastal dynamics and subma-rine permafrost degradation rates interact to determine the shape of the IBP table. This study suggests that much can be learned about how small-scale processes accelerate or slow the degradation of submarine permafrost through detailed study of local controls on thawing. Shallow bathymetry, for example, such as sand bars shallower than the maximum an-nual sea-ice thickness, may lead to temporary stabilization of permafrost following erosion. After characterizing shoreface bathymetry, geomorphology and sediment composition (par-ticularly ice content), measurements of annual and seasonal variations in benthic and sediment temperature and salin-ity and measurements of sediment flux on the shoreface are needed.
Acknowledgements. This work was funded by a Helmholtz Association of Research Centres (HGF) Joint Russian–German Research Group (HGF JRG 100). SPOT imagery was provided by SPOT Planet Action – an Astrium GEO initiative (project: Coastal erosion in East Siberia). Invaluable logistical support was provided by the Russian Hydrogeological Service in Tiksi, the Lena Delta Reserve and Waldemar Schneider.
Edited by: T. Zhang
References
Are, F. E.: Thermal abrasion of sea coasts, Polar Geography and Ge-ology, 12, 1–86, doi:10.1080/10889378809377343, from: Ter-moabraziya morskikh beregov, Nauka, Moscow, 1980, 158 pp., 1988.
Are, F. E.: Shoreface of the Arctic seas – a natural laboratory for subsea permafrost dynamics, in: Proceedings of the Eigth International Conference on Permafrost, Zürich, Switzerland, edited by: Philips, M., Springman, S. M., and Arenson, L. U., Swets & Zeitlinger, Lisse, 27–32, 2003.
Barnes, D. F.: Geophysical methods for delineating permafrost, in: Proceedings of the International Conference on Permafrost, Lafayette, Indiana, 11–15 November, edited by Woods, K. B. and Alter, A. J., National Academy of Sciences, Washington, D.C., 349–355, 1963.
Barnhart, K. R., Overeem, I., and Anderson, R. S.: The effect of changing sea ice on the physical vulnerability of Arctic coasts, The Cryosphere, 8, 1777–1799, doi:10.5194/tc-8-1777-2014, 2014.
Bauch, H. A., Mueller-Lupp, T., Taldenkova, E., Spielhagen, R. F., Kassens, H., Grootes, P. M., Thiede, J., Heinemeier, J., and Petryashov, V. V.: Chronology of the Holocene transgression at the North Siberian margin, Global Planet. Change, 31, 125–139, doi:10.1016/S0921-8181(01)00116-3, 2001.
Boike, J., Kattenstroth, B., Abramova, K., Bornemann, N., Chetverova, A., Fedorova, I., Fröb, K., Grigoriev, M., Grüber, M., Kutzbach, L., Langer, M., Minke, M., Muster, S., Piel, K., Pfeiffer, E.-M., Stoof, G., Westermann, S., Wischnewski, K., Wille, C., and Hubberten, H.-W.: Baseline characteristics of cli-mate, permafrost and land cover from a new permafrost obser-vatory in the Lena River Delta, Siberia (1998–2011), Biogeo-sciences, 10, 2105–2128, doi:10.5194/bg-10-2105-2013, 2013. Brown, J., Ferrians, O. J. J., Heginbottom, J. A., and Melnikov,
E. S., eds.: Circum-Arctic map of permafrost and ground-ice con-ditions, Circum-Pacific Map Series CP-45, US Geological Sur-vey in Cooperation with the Circum-Pacific Council for Energy and Mineral Resources, Washington, D. C., http://nsidc.org/data/ ggd318.html (last access: 5 May 2009), 2001.
Chuvilin, E. M., Bukhanov, B. A., Tumskoy, V. E., Shakhova, N. E., Dudarev, O. V., and Semiletov, I. P.: Thermal conductivity of bottom sediments inthe region of Buor-Khaya Bay (Shelf of the Laptev Sea), Earth Cryosphere, 17, 32–40, 2013.
Constable, S.: Ten years of marine CSEM for hydrocarbon explo-ration, Geophysics, 75, 75A67–75A81, 2010.
Dallimore, S. R. and Collett, T. S.: Intrapermafrost gas hydrates from a deep core hole in the Mackenzie Delta, Northwest Ter-ritories, Canada, Geology, 23, 527–530, doi:10.1130/0091-7613, 1995.
Dmitrenko, I. A., Kirillov, S. A., Tremblay, L. B., Kassens, H., Anisimov, O. A., Lavrov, S. A., Razumov, S. O., and Grigoriev, M. N.: Recent changes in shelf hydrography in the Siberian Arc-tic: Potential for subsea permafrost instability, J. Geophys. Res.-Oceans, 116, C10027, doi:10.1029/2011JC007218, 2011. Fartyshev, A. I.: Osobennosti priberezhno-shelfovoi kriolitozony
morya Laptevykh (Characteristics of the near-shore Laptev Sea shelf), Russian Academy of Sciences, Siberian Branch, Nauka, Novosibirsk, 1993.
Fedorova, I., Chetverova, A., Bolshiyanov, D., Makarov, A., Boike, J., Heim, B., Morgenstern, A., Overduin, P. P., Wegner, C., Kashina, V., Eulenburg, A., Dobrotina, E., and Sidorina, I.: Lena Delta hydrology and geochemistry: long-term hydrological data and recent field observations, Biogeosciences, 12, 345–363, doi:10.5194/bg-12-345-2015, 2015.
Frolov, A. D.: Electric and elastic properties of frozen earth materi-als, ONTI PNC Russian Academy of Science Press, Pushchino, 1998.
Grigoriev, M. N.: Kriomorphogenez i litodinamika pribrezhno-shelfovoi zony morei Vostochnoi Sibiri (Cryomorhogenesis and lithodynamics of the East Siberian near-shore shelf zone), Habil-itation thesis, Mel’nikov Permafrost Institute, Russian Academy of Sciences, Siberian Branch, Yakutsk, 2008.
Grigoriev, M. N., Kunitsky, V. V., Chzhan, R. V., and Shepelev, V. V.: On the variation in geocryological, landscape and hydro-logical conditions in the Arctic zone of East Siberia in connec-tion with climate warming, Geogr. Nat. Resour., 30, 101–106, doi:10.1016/j.gnr.2009.06.002, 2009.
Günther, F., Overduin, P. P., Makarov, A. S., and Grigoriev, M. N. (Eds.): Russian-German cooperation SYSTEM LAPTEV SEA: the expeditions Laptev Sea – Mamontov Klyk 2011 & Buor Khaya 2012, vol. 664 of Berichte zur Polar- und Meeres-forschung (Reports on Polar and Marine Research), Alfred We-gener Institute, Bremerhaven, http://hdl.handle.net/10013/epic. 41834 (last access: 29 June 2016), 2013.
Günther, F., Overduin, P. P., Yakshina, I. A., Opel, T., Baranskaya, A. V., and Grigoriev, M. N.: Observing Muostakh disappear: per-mafrost thaw subsidence and erosion of a ground-ice-rich island in response to arctic summer warming and sea ice reduction, The Cryosphere, 9, 151–178, doi:10.5194/tc-9-151-2015, 2015. Harrison, W. D.: Formulation of a model for pore water convection
in thawing subsea permafrost, Mitteilungen der Versuchsanstalt für Wasserbau, Hydrologie und Glaziologie, 57, 3–24, 1982. Hutter, K. and Straughan, B.: Models for convection in
thaw-ing porous media in support for the subsea permafrost equations, J. Geophys. Res.-Solid Ea., 104, 29249–29260, doi:10.1029/1999JB900288, 1999.
Kang, M. and Lee, J. S.: Evaluation of the freezing-thawing effect in sand-silt mixtures using elastic waves and elec-trical resistivity, Cold Reg. Sci. Technol., 113, 1–11, doi:10.1016/j.coldregions.2015.02.004, 2015.
King, M. S., Zimmerman, R. W., and Corwin, R. F.: Seismic and electrical properties of unconsolidated permafrost, Geophys. Prospect., 36, 349–364, 1988.
Kunitsky, V. V.: Kriolitologiya Nizovya Leny (Cryolithology of the Lower Lena), Melnikov Permafrost Institute, Russian Academy of Sciences, Siberian Branch, Yakutsk, 1989.
Lachenbruch, A. H.: Thermal effects of the ocean on permafrost, Bull. Geol. Soc. Am., 68, 1515–1530, doi:10.1130/0016-7606, 1957.
Lantuit, H., Atkinson, D., Overduin, P. P., Grigoriev, M., Rachold, V., Grosse, G., and Hubberten, H.-W.: Coastal erosion dynamics on the permafrost-dominated Bykovsky Peninsula, north Siberia, 1951–2006, Polar Res., 30, 7341, doi:10.3402/polar.v30i0.7341, 2011.
McGuire, A. D., Anderson, L. G., Christensen, T. R., Dallimore, S., Guo, L., Hayes, D. J., Heimann, M., Lorenson, T. D., Mac-donald, R. W., and Roulet, N.: Sensitivity of the carbon cycle in the Arctic to climate change, Ecol. Monogr., 79, 523–555, doi:10.1890/08-2025.1, 2009.
Molochushkin, E. N.: The Effect of Thermal Abrasion on the Tem-perature of the Permafrost in the Coastal Zone of the Laptev Sea, in: Proceedings of the Second International Conference on Per-mafrost, Yakutsk, USSR, 13–28 July 1973, edited by: Sanger, F. J. and Hyde, P. J., vol. USSR Contributions, National Academy of Sciences, Washington, D.C., 90–93, 1978.
Molochushkin, E. N. and Gavrivev, R. I.: Structure, Phase Com-position and Heat Regime of the Bottom of the Coastal Laptev Sea, in: The Arctic ocean and Its Coast in the Cenzoic Era (Sev-ernyi Ledovityi Okean i Ego Poberezh’e v Kainozoe), edited by: Tolmachev, A. I., Amerind Publishing Co. Pvt. Ltd., New Delhi, p. 564, 1982.
Nicolsky, D. J., Romanovsky, V. E., Romanovskii, N. N., Kholodov, A. L., Shakhova, N. E., and Semiletov, I. P.: Modeling sub-sea permafrost in the East Siberian Arctic Shelf: The Laptev Sea region, J. Geophys. Res.-Earth Surf., 117, F03028, doi:10.1029/2012JF002358, 2012.
Nixon, J. F.: Thermal simulation of subsea saline permafrost, Can. J. Earth Sci., 23, 2039–2046, doi:10.1139/e86-188, 1986. Osterkamp, T. E.: Sub-sea permafrost, in: Encyclopedia of ocean
sciences, vol. 5, edited by: Steele, J. H., Thorpe, S. A., and Turekian, K. K., Academic Press, New York, London, 2902– 2912, 2001.
Osterkamp, T. E., Baker, G. C., Harrison, W. D., and Matava, T.: Characteristics of the Active Layer and Shallow Sub-sea Permafrost, J. Geophys. Res.-Oceans, 94, 16227–16236, doi:10.1029/JC094iC11p16227, 1989.
Overduin, P. P., Hubberten, H.-W., Rachold, V., Romanovskii, N. N., Grigoriev, M. N., and Kasymskaya, M.: The evolu-tion and degradaevolu-tion of coastal and offshore permafrost in the Laptev and East Siberian Seas during the last climatic cycle, in: Coastline Changes: Interrelation of Climate and Geological Processes, vol. 426, edited by: Harff, J., Hay, W., and Tetzlaff, D., The Geological Society of America, Boulder, CO, 97–111, doi:10.1130/2007.2426(07), 2007.
Overduin, P. P., Westermann, S., Yoshikawa, K., Haberlau, T., Romanovsky, V., and Wetterich, S.: Geoelectric observations of the degradation of nearshore submarine permafrost at Bar-row (Alaskan Beaufort Sea), J. Geophys. Res.-Earth Surf., 117, F02004, doi:10.1029/2011JF002088, 2012.
Per-mafrost Degradation: Measurements from a Central Laptev Sea Shelf Borehole, J. Geophys. Res.-Biogeo., 120, 965–978, doi:10.1002/2014JG002862, 2015.
Ping, C.-L., Michaelson, G. J., Guo, L., Jorgenson, M. T., Kanevskiy, M., Shur, Y., Dou, F., and Liang, J.: Soil car-bon and material fluxes across the eroding Alaska Beau-fort Sea coastline, J. Geophys. Res.-Biogeo., 116, G02004, doi:10.1029/2010JG001588, 2011.
Rachold, V., Bolshiyanov, D. Y., Grigoriev, M. N., Hub-berten, H.-W., Junker, R., Kunitsky, V. V., Merker, F., Over-duin, P., and Schneider, W.: Nearshore arctic subsea per-mafrost in transition, Eos T. Am. Geophys. Un., 88, 149–150, doi:10.1029/2007EO130001, 2007.
Romanovskii, N. N. and Hubberten, H.-W.: Results of Permafrost Modelling of the Lowlands and Shelf of the Laptev Sea Region, Russia, Permafrost Periglac., 12, 191–202, doi:10.1002/ppp.387, 2001.
Schirrmeister, L., Grosse, G., Wetterich, S., Overduin, P. P., Strauss, J., Schuur, E. A. G., and Hubberten, H.-W.: Fossil or-ganic matter characteristics in permafrost deposits of the north-east Siberian Arctic, J. Geophys. Res.-Biogeo., 116, G00M02, doi:10.1029/2011JG001647, 2011a.
Schirrmeister, L., Kunitsky, V., Grosse, G., Wetterich, S., Meyer, H., Schwamborn, G., Babiy, O., Derevyagin, A., and Siegert, C.: Sedimentary characteristics and origin of the Late Pleis-tocene Ice Complex on north-east Siberian Arctic coastal lowlands and islands – A review, Quatern. Int., 241, 3–25, doi:10.1016/j.quaint.2010.04.004, 2011b.
Scott, W. J., Sellmann, P. V., and Hunter, J. A.: Geophysics in the Study of Permafrost, in: Geotechnical and Environmental Geo-physics, edited by: Ward, S., Soc. of Expl. Geoph., Tulsa, 355– 384, 1990.
Sellmann, P. V., Delanney, A. J., and Arcone, S. A.: Coastal sub-marine permafrost and bedrock observations using dc resistivity, vol. 89-13 of US Army Cold Regions Research and Engineer-ing Laboratory (CRREL) Report, National Technical Informa-tion Service, Hanover, New Hampshire, 1989.
Sellmann, P. V., Delaney, A. J., Chamberlain, E. J., and Dunton, K. H.: Seafloor temperature and conductivity data from Ste-fansson Sound, Alaska, Cold Reg. Sci. Technol., 20, 271–288, doi:10.1016/0165-232X(92)90034-R, 1992.
Shakhova, N. and Semiletov, I.: Methane release and coastal en-vironment in the East Siberian Arctic shelf, J. Mar. Syst., 66, 227–243, doi:10.1016/j.jmarsys.2006.06.006, 2007.
Slagoda, E. A.: Genesis i mikrostroenie kriolitogennykh ot-lozhenii Bykovskogo polyostrova i ostrova Muoastakh (Genesis and microstructure of cryolithogenic deposits at the Bykovsky Peninsula and the Muostakh Island), PhD thesis, Mel’nikov Permafrost Institute, Russian Academy of Sciences, Siberian Branch, Yakutsk, 1993.
Slagoda, E. A.: Kriolitogennye otlozheniya primorskoi ravniny morya Laptevykh: litologiya i mikromorfologiya (poluostrov Bykovskiy i ostrov Muostakh) – Cryolitogenic sediments of the Laptev Sea coastal lowland: lithology and micromorphology (Bykovsky Peninsula and Muostakh Island), Ekspress, Tyumen, 2004.