BGD
7, 9117–9136, 2010Response of the Black Sea methane budget to inputs of
methane
O. Schmale et al.
Title Page
Abstract Introduction
Conclusions References
Tables Figures
◭ ◮
◭ ◮
Back Close
Full Screen / Esc
Printer-friendly Version
Interactive Discussion
Discussion
P
a
per
|
Dis
cussion
P
a
per
|
Discussion
P
a
per
|
Discussio
n
P
a
per
Biogeosciences Discuss., 7, 9117–9136, 2010 www.biogeosciences-discuss.net/7/9117/2010/ doi:10.5194/bgd-7-9117-2010
© Author(s) 2010. CC Attribution 3.0 License.
Biogeosciences Discussions
This discussion paper is/has been under review for the journal Biogeosciences (BG). Please refer to the corresponding final paper in BG if available.
Response of the Black Sea methane
budget to massive short-term submarine
inputs of methane
O. Schmale1, M. Haeckel2, and D. F. McGinnis2
1
Leibniz Institute for Baltic Sea Research Warnem ¨unde (IOW), Rostock, Germany
2
Leibniz Institute of Marine Sciences (IFM-GEOMAR), Kiel, Germany
Received: 27 October 2010 – Accepted: 2 December 2010 – Published: 15 December 2010 Correspondence to: O. Schmale ([email protected])
BGD
7, 9117–9136, 2010Response of the Black Sea methane budget to inputs of
methane
O. Schmale et al.
Title Page
Abstract Introduction
Conclusions References
Tables Figures
◭ ◮
◭ ◮
Back Close
Full Screen / Esc
Printer-friendly Version
Interactive Discussion
Discussion
P
a
per
|
Dis
cussion
P
a
per
|
Discussion
P
a
per
|
Discussio
n
P
a
per
|
Abstract
A steady state box model was developed to estimate the methane input into the Black Sea water column at various water depths. Our model results reveal a total input of methane of 4.7 Tg yr−1
. The model predicts that the input of methane is largest at water depths between 600 and 700 m (7% of the total input), suggesting that the dis-5
sociation of methane gas hydrates at water depths equivalent to their upper stability limit may represent an important source of methane into the water column. In addition we discuss the effects of massive short-term methane inputs (e.g. through eruptions of deep-water mud volcanoes or submarine landslides at intermediate water depths) on the water column methane distribution and the resulting methane emission to the 10
atmosphere. Our non-steady state simulations predict that these inputs will be eff ec-tively buffered by intense microbial methane consumption and that the upward flux of methane is strongly hampered by the pronounced density stratification of the Black Sea water column. For instance, an assumed input of methane of 179 Tg CH4d−1
(equiv-alent to the amount of methane released by 1000 mud volcano eruptions) at a water 15
depth of 700 m will only marginally influence the sea/air methane flux increasing it by only 3%.
1 Introduction
For about 30 years the Black Sea methane cycle has been in the focus of international studies (e.g. Hunt, 1974; Kessler et al., 2006; Reeburgh et al., 1991). The Black Sea 20
water column stratification plays a key role in this complex cycle. Its structure is strongly influenced by the inflow of highly saline water via the Bosphorus and freshwater from rivers, mainly Danube, Dnepr and Dnestr, resulting in a permanent pycnocline located at water depths between 100 and 150 m. The lack of sufficient downward supply of dissolved oxygen to counter organic matter fluxes from the highly productive surface 25
BGD
7, 9117–9136, 2010Response of the Black Sea methane budget to inputs of
methane
O. Schmale et al.
Title Page
Abstract Introduction
Conclusions References
Tables Figures
◭ ◮
◭ ◮
Back Close
Full Screen / Esc
Printer-friendly Version
Interactive Discussion
Discussion
P
a
per
|
Dis
cussion
P
a
per
|
Discussion
P
a
per
|
Discussio
n
P
a
per
pycnocline and has made the Black Sea the world’s largest anoxic basin with CH4 concentrations of up to 13 µM (Naqvi et al., 2010).
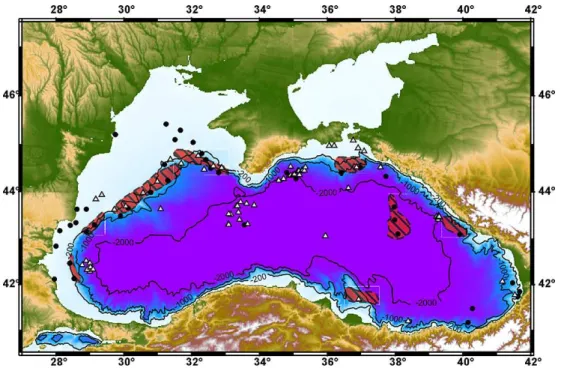
Recent hydroacoustic investigations have shown that active seep sites releasing gas bubbles (consisting mainly of methane) into the water column are widely distributed along the coast, the shelf, shelf edge, and upper slope of the Black Sea (Fig. 1; Dim-5
itrov, 2002; Naudts et al., 2006; Greinert et al., 2006; Nikolovska et al., 2008). Methane is also emitted from submarine mud volcanoes (MVs; Fig. 1). Until today, about 65 MVs have been discovered in the Black Sea. They are located on the Kerch-Taman shelf, the slope offBulgaria, Ukraine, Russia, Georgia, and Turkey, as well as in the central part of Black Sea (Kruglyakova et al., 2002). The contribution of seeps and MVs to 10
the total Black Sea methane budget, however, is poorly constrained and needs further investigation.
The first Black Sea methane budget by Reeburgh et al. (1991) determined the to-tal water column methane inventory to be 96 Tg. Thus, the Black Sea represents the largest marine water reservoir of dissolved methane. According to Reeburgh et 15
al. (1991), the major methane sources are shelf and slope sediments, which are bal-anced by anaerobic oxidation of methane as the major sink in the anoxic deep water (4.6 Tg yr−1). The second most important sink is the methane flux across the sea/air interface with 0.07 Tg yr−1. The total oxidation rate (oxic and anoxic) of 4.6 Tg yr−1 of CH4 suggests a residence time of about 20 years for methane. Reeburgh’s Black 20
Sea methane budget was modified by Kessler et al. (2006) who estimated the input of methane from seeps and dissociating gas hydrates into the intermediate and deep waters (below 150 m) to be 3.6–5.65 Tg yr−1
.
Here, we present a steady state box model with a structure similar of that of Kessler et al. (2006) to determine the Black Sea methane budget. Based on this model we es-25
BGD
7, 9117–9136, 2010Response of the Black Sea methane budget to inputs of
methane
O. Schmale et al.
Title Page
Abstract Introduction
Conclusions References
Tables Figures
◭ ◮
◭ ◮
Back Close
Full Screen / Esc
Printer-friendly Version
Interactive Discussion
Discussion
P
a
per
|
Dis
cussion
P
a
per
|
Discussion
P
a
per
|
Discussio
n
P
a
per
|
2 Model description
Two different models were developed: a steady state box model (Model A) to analyse the recent magnitudes of methane inputs into the Black Sea water column and a non-steady state box model (Model B) to explore the effects of methane injections into different water depths (e.g. by deep-water MV eruptions and landslides at intermediate 5
water depths) on the amount and vertical distribution of methane in the water column as well as on the methane efflux into the atmosphere.
Both box models consist of 20 well-mixed boxes integrating a depth interval of 100 m. Box volumes and areas were calculated based on the GEBCO 1-min global bathymetric grid (http://www.gebco.net/). Both models exchange methane with the atmosphere and 10
include the oxic and anoxic parts of the Black Sea water column with an oxic/anoxic interface located 100 m below the sea surface. The shelf and coastal waters (water depth <100 m) are not included in our model because the distribution and intensity
of methane sources (e.g. river plumes and shallow seep areas) and sinks (e.g. water column methane oxidation and evasion to the atmosphere) are very complex. At the 15
present time, these are poorly constrained in these regions. Methane emitting areas in these shallow areas show only regional influences on the water column methane distribution and are not affecting the open water body of the Black Sea (Schmale et al., 2010).
Water fluxes into and out of the Black Sea were adopted from ¨Ozsoy and 20
¨
Unl ¨uata (1997), but ignore the negligible effects of evaporation, rain, and river inflow on the Black Sea open ocean methane budget. Our model considers a Bosphorus inflow of 300 km3yr−1 and a similar outflow of 300 km3yr−1 into the Sea of Marmara. The influx of Bosphorus water is mainly restricted to a water depth between 100 and 500 m (Oguz and Rozman, 1991), which is balanced by upwelling that is represented by an 25
advective transport ( ¨Ozsoy and ¨Unl ¨uata, 1997).
BGD
7, 9117–9136, 2010Response of the Black Sea methane budget to inputs of
methane
O. Schmale et al.
Title Page
Abstract Introduction
Conclusions References
Tables Figures
◭ ◮
◭ ◮
Back Close
Full Screen / Esc
Printer-friendly Version
Interactive Discussion
Discussion
P
a
per
|
Dis
cussion
P
a
per
|
Discussion
P
a
per
|
Discussio
n
P
a
per
the transport of methane is restricted to turbulent diffusion. Eddy diffusion coefficients (Kz) were calculated on the base of CTD profiles to estimate turbulent overturns (Gal-braith and Kelley, 1995).
For the non-steady state Model B, which is used to analyze the response of the Black Sea methane cycle to massive methane injections, the methane input into different wa-5
ter depths was calculated by a gas bubble dissolution model (McGinnis et al., 2006), i.e. a rate-depth profile for the dissolution of rising methane gas bubbles is prescribed. This function predicts the evolving bubble size, gas composition, total bubble rise dis-tance, and dissolution/stripping of five gases (Ar, CO2, CH4, N2, O2). The model is
adapted for the hydrographic conditions of the Black Sea and considers the formation 10
of a hydrate rim around the methane gas bubble within the hydrate stability zone (i.e., below 700 m; Vassilev and Dimitrov, 2002).
To study the sea-air gas exchange in our box model, the surface water box is also connected to the atmosphere. The methane flux across the sea surface (FCH
4) is
cal-culated based on the sea-air gas exchange model of Wanninkhof (Wanninkhof, 1992) 15
for long-term wind averages.
FCH
4 = kw(CA
− C
1)A1 (1)
wherekw represents the gas transfer velocity across the sea surface, C1 is the
dis-solved methane concentration in the surface water box (Box 1; depth interval 0– 100 m), CA is the theoretical thermodynamic equilibrium concentration between
sur-20
face waters and the ambient atmosphere, andA1is the surface area. Methane
solubil-ity in seawater was calculated following Wiesenburg and Guinasso (Wiesenburg and Guinasso, 1979). Averaged values for salinity, temperature, wind speed, and atmo-spheric methane concentration were taken from the literature (Table 1 in the Supple-ment).
25
BGD
7, 9117–9136, 2010Response of the Black Sea methane budget to inputs of
methane
O. Schmale et al.
Title Page
Abstract Introduction
Conclusions References
Tables Figures
◭ ◮
◭ ◮
Back Close
Full Screen / Esc
Printer-friendly Version
Interactive Discussion
Discussion
P
a
per
|
Dis
cussion
P
a
per
|
Discussion
P
a
per
|
Discussio
n
P
a
per
|
law, assuming that electron acceptors (i.e., SO24− and O2) are not limiting the microbial
methane oxidation rates to derive depth-specific kinetic constants.
Rox = k[CH4] ⇒ k =
Rox
[CH4]
(2)
where k is the kinetic constant for methane oxidation, Rox the methane oxidation
rate, and [CH4] the dissolved methane concentration (Rox and [CH4] were taken from
5
Reeburgh et al., 1991). The data from Reeburgh et al. (1991) contain a high-quality dataset with the densest sampling interval available for the central Black Sea.
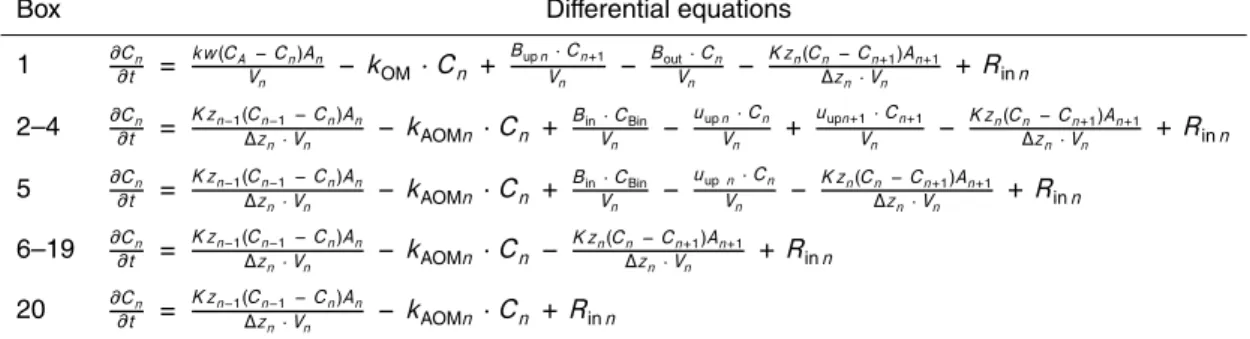
The detailed parameter values, notations, and references used in the model as well as the transport-reaction equations for each box are listed in the Supplement.
3 Results and discussion
10
3.1 Model A: input of methane into the Black Sea water column
A steady state box model was applied to quantify a depth-dependent input of methane to the Black Sea water column. The recent Black Sea methane distribution shows methane concentrations in the nanomolar range (average of 8.7 nM; Table 1 in the Supplement) at water depth between 0 and 100 m. At intermediate water depths of 100 15
to 600 m the methane concentration increases linearly with depth. The deep waters (600–2200 m) are characterized by uniform methane concentrations of around 11 µM (Reeburgh et al., 1991).
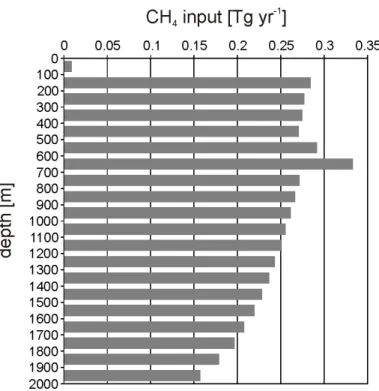
The methane inputs in each box of our Model A were varied until the mod-elled methane concentrations agreed with the averaged measurements published by 20
Reeburgh et al. (1991; modelled versus measured concentrations are listed for each box in Table 1 in the Supplement). Similar to the results published by Kessler et al. (2006) the modelled results displayed in Fig. 2 indicate that most CH4 is
enter-ing the Black Sea waters between 600–700 m water depth (0.33 Tg CH4yr
−1
BGD
7, 9117–9136, 2010Response of the Black Sea methane budget to inputs of
methane
O. Schmale et al.
Title Page
Abstract Introduction
Conclusions References
Tables Figures
◭ ◮
◭ ◮
Back Close
Full Screen / Esc
Printer-friendly Version
Interactive Discussion
Discussion
P
a
per
|
Dis
cussion
P
a
per
|
Discussion
P
a
per
|
Discussio
n
P
a
per
of the total input). The lower boundary of this depth range is close to the stability boundary of methane hydrates (670–700 m; Vassilev and Dimitrov, 2002). Poort et al. (2005) have modelled the regional response of the gas hydrate stability zone to the post glacial flooding and resulting bottom water temperature increase in the Black Sea. They predict that at present a widespread dissociation of gas hydrates is expected to 5
occur at the minimum water depth for hydrate stability. The model results imply that gas hydrate dissociation at the Black Sea continental slopes may take place and serve as an important methane source to intermediate waters. However, so far only a few active seep sites influencing the methane concentrations in the water column have been dis-covered in this specific depth range (Fig. 1). Hydroacoustic seep detection along the 10
slope of the NW Black Sea indicates that the minimum depth of gas hydrate stability is not characterized by a higher-than-average number of seep sites (Naudts et al., 2006). In contrast to previously published Black Sea methane models, our model also de-scribes the methane cycle in the upper 100 m of the Black Sea water column. The model predicts that diffusive and advective transports are not sufficient to maintain 15
the average surface water methane concentration of 8.7 nM observed by Reeburgh et al. (1991); the modelled concentration without additional surface water input is 5.9 nM. An additional input of 0.009 Tg yr−1of CH4is needed to reach a surface water methane
concentration similar to the one published by (Reeburgh et al., 1991). This open ocean methane source at shallow water depths is provided by microbial subsurface methane 20
generation taking place in zooplankton guts, the oxygen-deficient interior of particles (e.g. fecal pellets), or under phosphate limiting conditions (Damm et al., 2010; Karl et al., 2008). Subsurface methane maxima together with light13CH4 anomalies have been observed in the upper water column of the Black Sea by Schmale et al. (2010) in-dicating that this methane production occurs in the oxygenated water column. The lim-25
BGD
7, 9117–9136, 2010Response of the Black Sea methane budget to inputs of
methane
O. Schmale et al.
Title Page
Abstract Introduction
Conclusions References
Tables Figures
◭ ◮
◭ ◮
Back Close
Full Screen / Esc
Printer-friendly Version
Interactive Discussion
Discussion
P
a
per
|
Dis
cussion
P
a
per
|
Discussion
P
a
per
|
Discussio
n
P
a
per
|
100 m is highly correlated to rate of sea-air gas exchange. Depending on the approach used to parameterize the gas transfer velocity (kw) the sea-air flux estimates can show large variations (Wanninkhof et al., 2009).
Overall, the basin-wide CH4input of 4.7 Tg yr
−1
calculated by our Model A is similar to the estimate published by Kessler et al. (2006; i.e. 3.6–5.65 Tg yr−1
) and identical 5
with the sediment production calculated by Reeburgh et al. (1991). The good agree-ment between these different datasets represents an indirect validation of our steady state model.
3.2 Model B: influence of massive short-term methane injections on the Black Sea methane budget
10
Based on the structure of Model A a non-steady state model was applied to predict the effects of massive short-term methane injections on the methane distribution in the Black Sea water column. Two scenarios are discussed: (Model B1) the release of methane from numerous of Black Sea MVs in the abyssal plain at about 2000 m water depths (Fig. 1), and (Model B2) the injection of methane at the gas hydrate stability 15
boundary where hydrate dissociation may take place and submarine landslides could be expected (670–700 m; Vassilev and Dimitrov, 2002; Poort et al., 2005).
The approach was to separately increase the methane input to these two water depths (represented by boxes 7 and 20; i.e. depth intervals of 600–700 m and 1900– 2000 m, respectively) and to simulate the evolution of methane concentration in the 20
Black Sea water column and the resulting flux of methane across the sea surface until a steady state was reached.
It is difficult to constrain the methane release from MV eruptions or submarine land-slides since no direct gas flux measurements are available from these events. In terms of MV eruptions a few estimates exist implying that gas fluxes are on the order of 107to 25
BGD
7, 9117–9136, 2010Response of the Black Sea methane budget to inputs of
methane
O. Schmale et al.
Title Page
Abstract Introduction
Conclusions References
Tables Figures
◭ ◮
◭ ◮
Back Close
Full Screen / Esc
Printer-friendly Version
Interactive Discussion
Discussion
P
a
per
|
Dis
cussion
P
a
per
|
Discussion
P
a
per
|
Discussio
n
P
a
per
volcanoes in Azerbaijan (2.5×10⁸m3CH4 (=179 Gg or 1.1×10¹⁰mol) per eruptive MV event; Dadashev, 1963; a number also used by Milkov et al., 2003) to estimate the global gas flux from eruptive MVs. To model the effect of massive short-term methane inputs we use a fictive number of 179 Tg CH4 (equivalent to the amount of methane
released by 1000 MV eruptions) released within a day. We also assume that these 5
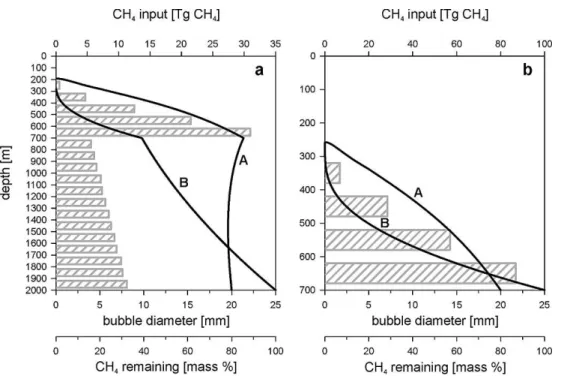
kinds of massive sedimentary gas inputs will be characterized by the release of free gas (i.e. gas bubbles). To describe the input of methane into different water depths by ascending gas bubbles, we applied the gas bubble dissolution model of McGinnis et al. (2006). The largest bubbles observed in the Black Sea are around 18 mm in diameter (McGinnis et al., 2006, and references therein). This most likely represents 10
the upper size limit, as larger bubbles may have a tendency to break apart during their rise and are transported as smaller bubbles with faster dissolution and gas exchange (McGinnis et al., 2006). For our model run we use an initial bubble diameter of 20 mm, hypothesizing that an eruptive gas release would rather result in the liberation of large bubbles.
15
3.2.1 Model B1: methane input at 2000 m water depth
The simulation of Model B1 was initiated with the steady state methane concentrations obtained with Model A. Further, we assume a methane release of 179 Tg of CH4 at
2000 m water depth over an eruptive phase of one day (e.g. eruptions of 1000 MVs). Proposing that the gas exclusively consists of methane, the eruptions will increase the 20
input of methane in box 20 (depth interval 2000–1900 m) at a rate of 10.9 Gg km−3d−1. The bubble model of McGinnis et al. (2006) predicts that within the hydrate stability zone (i.e., below 700 m water depth) the bubble dissolution rate is slowed down by the formation of a gas hydrate rim around the bubble (Fig. 3a). After passing the stability boundary of gas hydrates, the model assumes that the hydrate skin disappears 25
BGD
7, 9117–9136, 2010Response of the Black Sea methane budget to inputs of
methane
O. Schmale et al.
Title Page
Abstract Introduction
Conclusions References
Tables Figures
◭ ◮
◭ ◮
Back Close
Full Screen / Esc
Printer-friendly Version
Interactive Discussion
Discussion
P
a
per
|
Dis
cussion
P
a
per
|
Discussion
P
a
per
|
Discussio
n
P
a
per
|
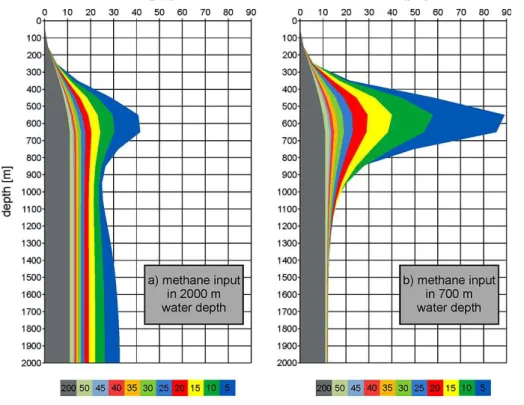
For this massive methane input the model results suggest that it takes about 200 years to return to the previous steady state methane concentrations. In this run the ini-tial methane input in box 20 (1900–2000 m) results in a concentration increase within this box which is about fivefold higher than the concentration derived from our steady state calculations (Model A, Fig. 4a). The methane input caused by the rapid dissolu-5
tion of gas bubbles above the hydrate stability zone leads to a concentration increase in box 7 (600–700 m) which is about seven times higher than the steady state concen-tration. However, the large methane input is effectively buffered by microbial methane consumption and pronounced water column stratification leading to a constantly de-creasing influence on the methane concentrations in the overlying boxes. The model 10
shows that the influence of such a major event on the surface water methane concen-tration is negligible and only leads to a 2-% increase in the sea/air methane flux.
To test if the concentrations of SO24− in the anoxic Black Sea waters are high enough to compensate for the high CH4 input of the MV eruption scenario (i.e. 1.1×10
13
mol of CH4for 1000 MV eruptions), we calculated the total amount of sulfate below 100 m 15
water depth. The balance shows that the total amount of sulfate of about 9×10¹⁸mol can easily compensate for the maximum methane injections. The annual sulfate input from the Bosphorus (0.95×10¹³mol) is already of the same order of magnitude.
3.2.2 Model B2: methane input at 700 m water depth
Our second case study focused on the inspection of a methane release to intermediate 20
water depths (e.g. catastrophic submarine landslide) and its influence on the water column methane distribution and the subsequent atmospheric emission. Also, this model run was initiated with steady state methane concentrations calculated in Model A and assumes a methane release of 179 Tg of CH4at 700 m water depth over a time span of one day. Such an event will increase the input of methane to box 7 (depth 25
interval 600–700 m) to 6.2 Gg km−3
d−1
BGD
7, 9117–9136, 2010Response of the Black Sea methane budget to inputs of
methane
O. Schmale et al.
Title Page
Abstract Introduction
Conclusions References
Tables Figures
◭ ◮
◭ ◮
Back Close
Full Screen / Esc
Printer-friendly Version
Interactive Discussion
Discussion
P
a
per
|
Dis
cussion
P
a
per
|
Discussion
P
a
per
|
Discussio
n
P
a
per
After the injection of gas, the initial methane concentration in box 7 increases up to 200 000 nM (about 20 times higher than the steady state concentration calculated in Model A). The relaxation time needed for the system to return to previous steady state concentrations is about 200 years. Also, this study shows that methane is efficiently consumed microbially and that the exchange between individual boxes is strongly ham-5
pered, resulting in a limited transport of methane towards the sea surface (Fig. 4b). The slightly elevated surface water methane concentration increases the methane emission across the sea surface by only 3%.
4 Conclusion and outlook
Our model predicts that massive short-term injections of methane will be effectively 10
buffered in the Black Sea water column. Even if the gas is liberated at intermediate water depths methane transport to the surface and thus emission across the sea/air interface is strongly reduced by microbial methane consumption and the hydrographic stratification of the Black Sea. However, we have to take into account in our model approach, that violent eruptions in spatially limited regions will probably be character-15
ized by the creation of a focused two-phase plume consisting of methane gas bubbles and methane saturated ambient seawater (Leifer and Patro, 2002). These conditions reduce the bubble dissolution rates and increase the bubble life-time as well as its ver-tical rise velocity in the water column. Violent eruptions may thus have the capacity to transfer methane from deep waters into shallow water depths. However, our box 20
BGD
7, 9117–9136, 2010Response of the Black Sea methane budget to inputs of
methane
O. Schmale et al.
Title Page
Abstract Introduction
Conclusions References
Tables Figures
◭ ◮
◭ ◮
Back Close
Full Screen / Esc
Printer-friendly Version
Interactive Discussion
Discussion
P
a
per
|
Dis
cussion
P
a
per
|
Discussion
P
a
per
|
Discussio
n
P
a
per
|
Acknowledgements. We thank Gregor Rehder, Robin Keir and Christian Holzner for comments and suggestions which considerably helped to improve the manuscript.
References
Dadashev, F. G.: Hydrocarbon gases of mud volcanoes of Azerbaijan, Azerneshr, Baku, 1963 (in Russian).
5
Damm, E., Helmke, E., Thoms, S., Schauer, U., N ¨othig, E., Bakker, K., and Kiene, R. P.: Methane production in aerobic oligotrophic surface water in the central Arctic Ocean, Bio-geosciences, 7, 1099–1108, doi:10.5194/bg-7-1099-2010, 2010.
Dimitrov, L.: Contribution to atmospheric methane by natural seepages on the Bulgarian conti-nental shelf, Cont. Shelf Res., 22, 2429–2442, 2002.
10
Galbraith, P. S. and Kelley, D. F.: Identifying overturns in CTD profiles, J. Atmos. Ocean. Tech., 13, 688–702, 1995.
Greinert, J., Artemov, Y., Egorov, V. N., De Batist, M., and McGinnis, D.: 1300-m-high rising bubbles from mud volcanoes at 2080 m in the Black Sea: Hydroacoustic characteristics and temporal variability, Earth Planet. Sc. Lett., 244, 1–15, 2006.
15
Hunt, J. M.: Hydrocarbon Geochemistry of Black Sea, in: The Black Sea – Geology, Chem-istry, and Biology, edited by: Degens, E. T. and Ross, D. A., The American Association of Petroleum Geologists, 499–504, 1974.
Karl, D. M., Beversdorf, L., Bjorkman, K. M., Church, M. J., Martinez, A., and Delong, E. F.: Aerobic production of methane in the sea, Nat. Geosci., 1, 473–478, 2008.
20
Kessler, J. D., Reeburgh, W. S., Southon, J., Seifert, R., Michaelis, W., and Tyler, S. C.: Basin-wide estimates of the input of methane from seeps and clathrates to the Black Sea, Earth Planet. Sci. Lett., 243, 366–375, 2006.
Kruglyakova, R., Gubanov, Y., Kruglyakov, V., and Prokoptsev, G.: Assessment of technogenic and natural hydrocarbon supply into the Black Sea and seabed sediments, Cont. Shelf Res.,
25
22, 2395–2407, 2002.
BGD
7, 9117–9136, 2010Response of the Black Sea methane budget to inputs of
methane
O. Schmale et al.
Title Page
Abstract Introduction
Conclusions References
Tables Figures
◭ ◮
◭ ◮
Back Close
Full Screen / Esc
Printer-friendly Version
Interactive Discussion
Discussion
P
a
per
|
Dis
cussion
P
a
per
|
Discussion
P
a
per
|
Discussio
n
P
a
per
seabed to the surface: a review and sensitivity study, Cont. Shelf Res., 22, 2409–2428, 2002.
McGinnis, D. F., Greinert, J., Artemov, Y., Beaubien, S. E., and W ¨uest, A.: Fate of rising methane bubbles in stratified waters: How much methane reaches the atmosphere?, J. Geo-phys. Res., 111, C09007, doi:10.1029/2005jc003183, 2006.
5
Milkov, A. V., Sassen, R., Tatiyana, V., Apanasovich, V., and Dadashev, G.: Global gas flux from mud volcanoes: A significant source of fossil methane in the atmosphere and the ocean, Geophys. Res. Lett., 30, 1037, doi:10.1029/2002GL016358, 2003.
Naqvi, S. W. A., Bange, H. W., Far´ıas, L., Monteiro, P. M. S., Scranton, M. I., and Zhang, J.: Marine hypoxia/anoxia as a source of CH4 and N2O, Biogeosciences, 7, 2159–2190,
10
doi:10.5194/bg-7-2159-2010, 2010.
Naudts, L., Greinert, J., Artemov, Y., Staelens, P., Poort, J., Van Rensbergen, P., and De Batist, M.: Geological and morphological setting of 2778 methane seeps in the Dnepr paleo-delta, northwestern Black Sea, Mar. Geol., 227, 177–199, 2006.
Nikolovska, A., Sahling, H., and Bohrmann, G.: Hydroacoustic methodology for detection,
15
localization, and quantification of gas bubbles rising from the seafloor at gas seeps from the eastern Black Sea, Geochem. Geophy. Geosy., 9, Q10010, doi:10.1029/2008gc002118, 2008.
Oguz, T. and Rozman, L.: Characteristics of the Mediterranean underflow in the southwestern Black Sea continental shelf/slope region, Oceanol. Acta, 14, 433–444, 1991.
20
¨
Ozsoy, E. and ¨Unl ¨uata, ¨U.: Oceanography of the Black Sea: a review of some recent results, Earth-Sci. Rev., 42, 231–272, 1997.
Poort, J., Vassilev, A., and Dimitrov, L.: Did postglacial catastrophic flooding trigger massive changes in the Black Sea gas hydrate reservoir?, Terra Nova, 17, 135–140, 2005.
Reeburgh, W. S., Ward, B. B., Whalen, S. C., Sandbeck, K. A., Kilpatrick, K. A., and Kerkhof,
25
L. J.: Black Sea methane geochemistry, Deep-Sea Res., 38, 1189–1210, 1991.
Schmale, O., Beaubien, S. E., Rehder, G., Greinert, J., and Lombardi, S.: Gas seepage in the Dnepr paleo-delta area (NW-Black Sea) and its regional impact on the water column methane cycle, J. Marine Syst., 80, 90–100, 2010.
Vassilev, A. and Dimitrov, L.: Spatial and quantity evaluation of the Black Sea gas hydrates,
30
Russ. Geol. Geophys., 43, 637–649, 2002.
BGD
7, 9117–9136, 2010Response of the Black Sea methane budget to inputs of
methane
O. Schmale et al.
Title Page
Abstract Introduction
Conclusions References
Tables Figures
◭ ◮
◭ ◮
Back Close
Full Screen / Esc
Printer-friendly Version
Interactive Discussion
Discussion
P
a
per
|
Dis
cussion
P
a
per
|
Discussion
P
a
per
|
Discussio
n
P
a
per
|
Wanninkhof, R., Asher, W., Ho, D. T., Sweeney, C., and McGillis, W. R.: Advances in quantifying air-sea gas exchange and environmental forcing, Annual Review of Marine Science, 1, 213– 244, 2009.
Ward, B. B., Kilpatrick, K. A., Novelli, P. C., and Scranton, M. I.: Methane oxidation and methane fluxes in the ocean surface layer and deep waters, Nature, 327, 226–229, 1987.
5
BGD
7, 9117–9136, 2010Response of the Black Sea methane budget to inputs of
methane
O. Schmale et al.
Title Page
Abstract Introduction
Conclusions References
Tables Figures
◭ ◮
◭ ◮
Back Close
Full Screen / Esc
Printer-friendly Version
Interactive Discussion
Discussion
P
a
per
|
Dis
cussion
P
a
per
|
Discussion
P
a
per
|
Discussio
n
P
a
per
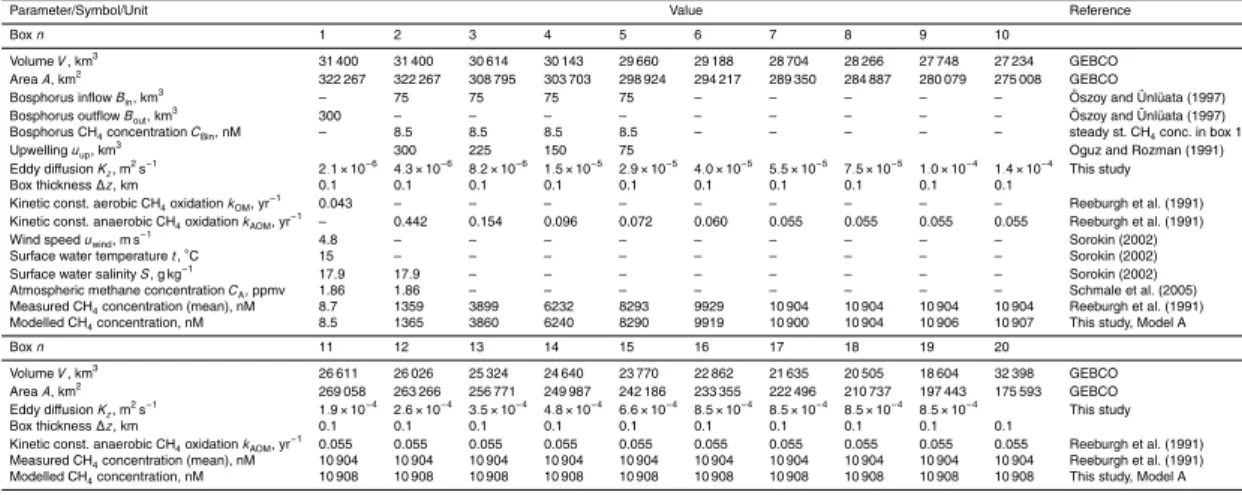
Table 1.Parameter values, notations, and references.
Parameter/Symbol/Unit Value Reference
Boxn 1 2 3 4 5 6 7 8 9 10
VolumeV, km3 31 400 31 400 30 614 30 143 29 660 29 188 28 704 28 266 27 748 27 234 GEBCO
AreaA, km2 322 267 322 267 308 795 303 703 298 924 294 217 289 350 284 887 280 079 275 008 GEBCO
Bosphorus inflowBin, km3 – 75 75 75 75 – – – – – Oszoy and ¨¨ Unl ¨uata (1997)
Bosphorus outflowBout, km3 300 – – – – – – – – – Oszoy and ¨¨ Unl ¨uata (1997)
Bosphorus CH4concentrationCBin, nM – 8.5 8.5 8.5 8.5 – – – – – steady st. CH4conc. in box 1
Upwellinguup, km3 300 225 150 75 Oguz and Rozman (1991)
Eddy diffusionKz, m2s
−1 2.1×10⁻⁶ 4.3×10⁻⁶ 8.2×10⁻⁶ 1.5×10⁻⁵ 2.9×10⁻⁵ 4.0×10⁻⁵ 5.5×10⁻⁵ 7.5×10⁻⁵ 1.0×10⁻⁴ 1.4×10⁻⁴ This study
Box thickness∆z, km 0.1 0.1 0.1 0.1 0.1 0.1 0.1 0.1 0.1 0.1
Kinetic const. aerobic CH4oxidationk
OM, yr
−1 0.043 – – – – – – – – – Reeburgh et al. (1991)
Kinetic const. anaerobic CH4oxidationkAOM, yr
−1 – 0.442 0.154 0.096 0.072 0.060 0.055 0.055 0.055 0.055 Reeburgh et al. (1991)
Wind speeduwind, m s−1 4.8 – – – – – – – – – Sorokin (2002)
Surface water temperaturet,◦
C 15 – – – – – – – – – Sorokin (2002)
Surface water salinityS, g kg−1 17.9 17.9 – – – – – – – – Sorokin (2002)
Atmospheric methane concentrationCA, ppmv 1.86 1.86 – – – – – – – – Schmale et al. (2005)
Measured CH4concentration (mean), nM 8.7 1359 3899 6232 8293 9929 10 904 10 904 10 904 10 904 Reeburgh et al. (1991)
Modelled CH4concentration, nM 8.5 1365 3860 6240 8290 9919 10 900 10 904 10 906 10 907 This study, Model A
Boxn 11 12 13 14 15 16 17 18 19 20
VolumeV, km3 26 611 26 026 25 324 24 640 23 770 22 862 21 635 20 505 18 604 32 398 GEBCO
AreaA, km2 269 058 263 266 256 771 249 987 242 186 233 355 222 496 210 737 197 443 175 593 GEBCO
Eddy diffusionKz, m2s
−1 1.9×10⁻⁴ 2.6×10⁻⁴ 3.5×10⁻⁴ 4.8×10⁻⁴ 6.6×10⁻⁴ 8.5×10⁻⁴ 8.5×10⁻⁴ 8.5×10⁻⁴ 8.5×10⁻⁴ This study
Box thickness∆z, km 0.1 0.1 0.1 0.1 0.1 0.1 0.1 0.1 0.1 0.1
Kinetic const. anaerobic CH4oxidationkAOM, yr
−1 0.055 0.055 0.055 0.055 0.055 0.055 0.055 0.055 0.055 0.055 Reeburgh et al. (1991)
Measured CH4concentration (mean), nM 10 904 10 904 10 904 10 904 10 904 10 904 10 904 10 904 10 904 10 904 Reeburgh et al. (1991)
BGD
7, 9117–9136, 2010Response of the Black Sea methane budget to inputs of
methane
O. Schmale et al.
Title Page Abstract Introduction Conclusions References Tables Figures ◭ ◮ ◭ ◮ Back Close
Full Screen / Esc
Printer-friendly Version Interactive Discussion Discussion P a per | Dis cussion P a per | Discussion P a per | Discussio n P a per |
Table 2.Differential equations for each box (abbreviations are listed in Table 1).
Box Differential equations
1 ∂Cn
∂t =
kw(CA−Cn)An Vn
−kOM ·Cn + B
upn·Cn+1 Vn
− BoutV·Cn
n
− K zn(Cn−Cn+1)An+1 ∆zn·Vn +
Rinn
2–4 ∂Cn
∂t = K zn
−1(Cn−1−Cn)An
∆zn·Vn
− kAOMn ·Cn + Bin·CBin
Vn
− u
upn·Cn Vn +
u upn+1·Cn+1
Vn
− K zn(Cn−Cn+1)An+1 ∆zn·Vn +
Rinn
5 ∂Cn
∂t = K zn
−1(Cn−1−Cn)An
∆zn·Vn
− kAOMn ·Cn + Bin·CBin Vn
− u
upn·Cn Vn
− K zn(Cn−Cn+1)An+1
∆zn·Vn + Rinn
6–19 ∂Cn
∂t = K zn
−1(Cn−1−Cn)An
∆zn·Vn
− kAOMn ·Cn −
K zn(Cn−Cn+1)An+1
∆zn·Vn + Rinn
20 ∂Cn
∂t =
K zn−1(Cn−1−Cn)An
∆zn·Vn
− kAOMn ·Cn + Rinn
BGD
7, 9117–9136, 2010Response of the Black Sea methane budget to inputs of
methane
O. Schmale et al.
Title Page
Abstract Introduction
Conclusions References
Tables Figures
◭ ◮
◭ ◮
Back Close
Full Screen / Esc
Printer-friendly Version
Interactive Discussion
Discussion
P
a
per
|
Dis
cussion
P
a
per
|
Discussion
P
a
per
|
Discussio
n
P
a
per
|
BGD
7, 9117–9136, 2010Response of the Black Sea methane budget to inputs of
methane
O. Schmale et al.
Title Page
Abstract Introduction
Conclusions References
Tables Figures
◭ ◮
◭ ◮
Back Close
Full Screen / Esc
Printer-friendly Version
Interactive Discussion
Discussion
P
a
per
|
Dis
cussion
P
a
per
|
Discussion
P
a
per
|
Discussio
n
P
a
per
Fig. 3. Inputs of methane into different water depths after a release of 179 Tg d−1
of CH4 at
BGD
7, 9117–9136, 2010Response of the Black Sea methane budget to inputs of
methane
O. Schmale et al.
Title Page
Abstract Introduction
Conclusions References
Tables Figures
◭ ◮
◭ ◮
Back Close
Full Screen / Esc
Printer-friendly Version
Interactive Discussion
Discussion
P
a
per
|
Dis
cussion
P
a
per
|
Discussion
P
a
per
|
Discussio
n
P
a
per
|
Fig. 4. CH4evolution over time after an initial input of 179 Tg of CH4. The left panel(a) repre-sents the dissolved methane distribution after an input at 2000 m water depth. The right panel