doi:10.5194/cp-11-1395-2015
© Author(s) 2015. CC Attribution 3.0 License.
Volcanic synchronization of Dome Fuji and Dome C Antarctic
deep ice cores over the past 216 kyr
S. Fujita1,2,*, F. Parrenin3,4,*, M. Severi5, H. Motoyama1,2, and E. W. Wolff6
1National Institute of Polar Research, Research Organization of Information and Systems, Tokyo, Japan 2Department of Polar Science, The Graduate University for Advanced Studies (SOKENDAI), Tokyo, Japan 3CNRS, LGGE, 38041 Grenoble, France
4Univ. Grenoble Alpes, LGGE, 38041 Grenoble, France
5Department of Chemistry, University of Florence, Florence, Italy 6Department of Earth Sciences, University of Cambridge, UK *These authors contributed equally to this work.
Correspondence to: S. Fujita ([email protected]) and F. Parrenin ([email protected])
Received: 14 January 2015 – Published in Clim. Past Discuss.: 17 February 2015 Revised: 31 August 2015 – Accepted: 29 September 2015 – Published: 19 October 2015
Abstract.Two deep ice cores, Dome Fuji (DF) and EPICA Dome C (EDC), drilled at remote dome summits in Antarc-tica, were volcanically synchronized to improve our under-standing of their chronologies. Within the past 216 kyr, 1401 volcanic tie points have been identified. DFO2006 is the chronology for the DF core that strictly follows O2/N2 age constraints with interpolation using an ice flow model. AICC2012 is the chronology for five cores, including the EDC core, and is characterized by glaciological approaches combining ice flow modelling with various age markers. A precise comparison between the two chronologies was per-formed. The age differences between them are within 2 kyr, except at Marine Isotope Stage (MIS) 5. DFO2006 gives ages older than AICC2012, with peak values of 4.5 and 3.1 kyr at MIS 5d and MIS 5b, respectively. Accordingly, the ratios of duration (AICC2012/DFO2006) range between 1.4 at MIS 5e and 0.7 at MIS 5a. When making a comparison with accu-rately dated speleothem records, the age of DFO2006 agrees well at MIS 5d, while the age of AICC2012 agrees well at MIS 5b, supporting their accuracy at these stages. In ad-dition, we found that glaciological approaches tend to give chronologies with younger ages and with longer durations than age markers suggest at MIS 5d–6. Therefore, we hy-pothesize that the causes of the DFO2006–AICC2012 age differences at MIS 5 are (i) overestimation in surface mass balance at around MIS 5d–6 in the glaciological approach and (ii) an error in one of the O2/N2 age constraints by
∼3 kyr at MIS 5b. Overall, we improved our knowledge of the timing and duration of climatic stages at MIS 5. This new understanding will be incorporated into the production of the next common age scale. Additionally, we found that the deu-terium signals of ice,δDice, at DF tends to lead the one at EDC, with the DF lead being more pronounced during cold periods. The lead of DF is by+710 years (maximum) at MIS 5d,−230 years (minimum) at MIS 7a and+60 to+126 years on average.
1 Introduction
Ta-los Dome (TALDICE)) have been made (Bazin et al., 2013; Lemieux-Dudon et al., 2010; Veres et al., 2013). The latest common age scale is called the Antarctic Ice Core Chronol-ogy 2012 (AICC2012). For the past 60 kyr, the age scale was constrained by layer counting of Greenland’s ice cores (see Veres et al., 2013). For ice older than 60 kyr, dating of Antarctic cores is based on various approaches combining ice flow modelling with orbital tuning age markers and other age markers. Typical orbital tuning markers include the iso-topic composition of oxygen (hereinafter δ18Oatm) from air bubbles, total air content (TAC), and the O2/N2 ratios of occluded air. Typical maximum age uncertainties of these markers are claimed to be∼6,∼4 (Bazin et al., 2013) and
∼2 kyr (Kawamura et al., 2007; Parrenin et al., 2007b; Hut-terli et al., 2009), respectively, although some studies suggest that larger errors can occur in some O2/N2ratio age mark-ers (e.g. Hutterli et al., 2009; Landais et al., 2012). As a re-sult, age uncertainties depend on the availability and choice of these kinds of age markers for each of the deep ice cores such as EDC (Parrenin et al., 2007a), Vostok (Parrenin et al., 2004; Suwa and Bender, 2008) and DF ice cores (Kawamura et al., 2007; Parrenin et al., 2007a). To better constrain mon age scales, synchronization of deep ice cores using com-mon events such as volcanic markers is a very important task. In ice core studies, electrical conductivity studies are usu-ally performed first because such methods are useful in quickly locating positions of volcanic events. These meth-ods include electrical conductivity measurement (ECM; e.g. Hammer, 1980; Wolff, 2000), dielectric profile (DEP; e.g. Moore and Paren, 1987; Wilhelms et al., 1998) and ACECM (e.g. Fujita et al., 2002c). ACECM is a method to detect the complex admittance between electrodes dragged on the ice surface with a millimetre-scale resolution and at 1 MHz fre-quency. In addition, fast ion chromatography (FIC) yields continuous records of ions, including sulfate ions (Traversi et al., 2002). Although each of these electrical signals (ECM, DEP and ACECM) and signals from chemical analysis has its own characteristic, they are equally useful in locating acidic spike events in ice cores from the East Antarctic Plateau (see references given for each method above). Fallout of sulfuric acid is known to occur for one or more years following erup-tions due to its residence time in the atmosphere (e.g. Gao et al., 2006; Hammer et al., 1980). Volcanic signals found in an Antarctic ice core can originate either from volcanoes located in the middle southern latitudes (e.g. South America and the South Pacific) and the high southern latitudes (the Antarc-tic continent and the subantarcAntarc-tic islands) or from volcanoes located in the low latitudes of either hemisphere (e.g. Cole-Dai et al., 2000). Additionally, a low-latitude eruption must be sufficiently explosive to inject volcanic materials directly into the stratosphere in order for its aerosols to be transported to the polar atmosphere and deposited in Antarctic snow (e.g. Cole-Dai et al., 2000). These signals of volcanic events are very useful in synchronizing ice cores. For example, the EDC core has been volcanically synchronized with other major ice
cores: with the Vostok ice core by 102 tie points covering 145 kyr BP (Parrenin et al., 2012), with the EDML ice core by∼320 tie points covering 150 kyr BP (Ruth et al., 2007; Severi et al., 2007), and with the TALDICE core by∼130 tie points covering 42 kyr BP (Severi et al., 2012). These tie points are used to build a common chronology (Bazin et al., 2013; Veres et al., 2013). We note that Bazin et al. (2013) also used gas stratigraphic links in addition to ice stratigraphic links.
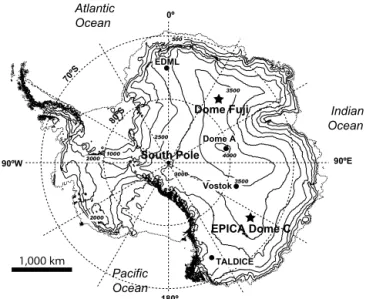
The DF core was drilled at the dome summit in the Dron-ning Maud Land in East Antarctica, located at 77◦19′S, 39◦42′E (Fig. 1; Watanabe et al., 1999). The elevation is 3800 m relative to the WGS84 geoid, and the ice thickness is 3028 (±15) m (Fujita et al., 1999). The EDC core was drilled at one of the dome summits located at 75◦06′S, 123◦21′E,
∼2000 km away from DF (Fig. 1; EPICA Community Mem-bers, 2004). The elevation of EDC is∼570 m lower than DF at 3233 m (WGS84), and the ice thickness is 3273 (±5) m (Parrenin et al., 2007b). In the published original age scale of the DF core called DFO2006 (Kawamura et al., 2007), there are 23 O2/N2 age markers between 80 kyr BP and 340 kyr BP. These O2/N2constraints were interpolated by ice flow modelling. Therefore, synchronization between the DF core and the EDC core means that the chronology strictly constrained by the O2/N2age markers of the DF core can be compared with AICC2012, the chronology for five cores including the EDC core, and characterized by glaciologi-cal approaches combining ice flow modelling with various age markers (Bazin et al., 2013; Veres et al., 2013). In the AICC2012 chronology, for the period of the past 216 kyr studied in this paper, ice age markers of TAC and the O2/N2 ratio were used from the EDC core and the Vostok core, re-spectively. In addition, gas age markers ofδ18Oatmhave been used from the EDC, Vostok and TALDICE cores. These gas age markers were linked to the age of ice through assump-tions of firn thickness and the lock-in depths of air. Note here that gas is trapped in polar ice sheets at 50–120 m be-low the surface, and the gas age is therefore younger than the age of the surrounding ice (ice age). Based on the DF–EDC synchronization in this paper, a precise comparison between the two age scales (DFO2006 and AICC2012) can be made, which is a major step toward improving our understanding of the chronology of Antarctic ice cores for the period over the past 216 kyr.
2 Methods
2.1 Data sets
1,000 km
Atlantic Ocean
Indian Ocean
Pacific Ocean
0º
90ºE
180º
Dome Fuji
EPICA Dome C
90ºW
70ºS
80ºS
South Pole
EDML
Vostok Dome A
TALDICE
Figure 1. Map of the continent of Antarctica with elevation con-tours every 500 m. The two ice coring sites used in this study, Dome C and Dome Fuji, are marked with stars.
borehole (Motoyama, 2007). At EDC, the first core (EDC96 core) was started in the 1996/1997 season to a depth down to 790 m. The second 3270 m long core (EDC99 core), reaching nearly to the ice sheet bed, was started during the 1999/2000 season at a site 10 m away from the EDC96 core (EPICA Community Members, 2004). Ice core signals from these four cores were used in the synchronization work in this study. From these ice cores, we used data profiles indicative of strong acids originated from large volcanic eruptions (see Table 1). Resolutions are from 1 to 4 cm. For all these cores, depth determinations were based on the widely used method of logging of ice cores (e.g. Fujita et al., 2002a).
2.2 Method of synchronization
First, by using depth-profile graphs of the data sets described above and comparing between them, major tie points were extracted manually. Typically, we attempted to extract a tie point within at least each 5 m of depth, although this was not always possible. In glacial periods, there is often a lack of convincing tie points – presumably because of the fre-quent loss/disturbance of annual layers due to reworking of the snow surface by wind scouring under lower accumu-lation rate conditions and possible accumuaccumu-lation hiatuses, which remove the distinct volcanic layers. At an initial stage,
∼650 tie points were extracted down to a depth of∼2180 m for both cores, using prominent peaks common between ice core signals from different ice cores. The ∼650 tie points were found as patterns of appearance in ice core signals ver-sus depth and they provided initial hints to recognize fur-ther matching patterns of tie points. This method of detec-tion using pattern matching made us confident about identi-fying the candidate tie points. There are more possible tie
Table 1.Summary of data sets of ice core signals used for synchronization.
Core Name of Depth range Measured properties Measurement Depth Reference
measurement used (m) temperature (◦C) resolution (cm)
DF1 ECM 2–2250 Direct current of solid ice −20 to−30 1 Fujita et al. (2002a, b, c) AC-ECM 112–250 High-frequency conductance of solid ice at 1 MHz −20 to−30 1 Fujita et al. (2002a, b, c)
DF2 ECM 889–2250 Direct current of solid ice −20 1 This study
AC-ECM 889–2250 High-frequency conductance of solid ice at 1 MHz −20 1 This study
EDC96 ECM 99–788 Direct current of solid ice −20 1 EPICA Community Members (2004) Sulfate 7–788 Concentration of sulfate ions 4 Udisti et al. (2000)
DEP 7–788 High-frequency conductivity of solid ice at 100 kHz −20 2 Wolff et al. (2005)
EDC99 ECM 772–3188 Direct current of solid ice −20 1 EPICA Community Members (2004) Sulfate 769–2094 Concentration of sulfate ions 2 Udisti et al. (2004)
DEP 7–3165 High-frequency conductivity of solid ice at 100 kHz −20 2 Wolff et al. (2005)
layers that originated from the same source (eruptions) were rare among deep ice cores from East Antarctica (see Narcisi et al., 2005). In this paper, instead of using tephra matches in the synchronization work, we used them as posterior tests of the synchronization work.
3 Results
3.1 Features of the tie points
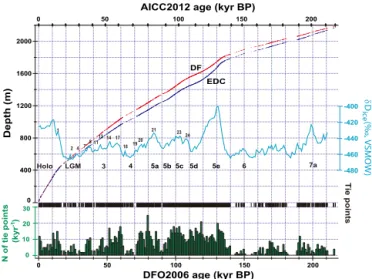
The EDC-DF volcanic matching consists of 1401 depth tie points (Fig. 2 and all records of synchronization in the Sup-plement A). Data are distributed heterogeneously in time (Fig. 3). In Fig. 3, depths of the tie points in each ice core are plotted versus time using a single common age scale. In the present case, we use the DFO2006 scale at the bottom axis with the AICC2012 scale at the top axis as a reference. In Fig. 3, the variations in the slope on the profiles are due to variable surface mass balance (SMB) and thinning effects after deposition. For the periods of MIS 3 and 5, a relatively large number of tie points were found, typically 10–20 points over every 1 kyr interval (Fig. 3 bottom). The variations in the number of tie points are due to the variable number of major volcanic eruptions, variable atmospheric circulation, variable depositional environment such as SMB, possible signal dif-fusion effects in ice after deposition, and variable number of data sets available for the synchronization work. It became harder to find tie points in the deeper part of the cores, in particular in some cold periods such as MIS 6 (see Fig. 3). This was presumably because of the frequent occurrence of periods of very low surface accumulation or accumulation hiatuses during MIS 6 and additional effects from diffusion of sulfuric acid in ice.
We note that the previous interglacial period (i.e. 120– 130 kyr BP) has about twice the number of match points as the Holocene (i.e. 0–10 kyr BP). Because the availability of data sets depends on depth range (see Table 1), the number of tie points for each time span does not simply reflect the occurrence frequency of large volcanic eruptions. From the ice sheet surface to a depth close to 900 m, no data set from the DF2 core was available for synchronization. We deduce that this situation limited the number of identified tie points;
we generally find more tie points when we have more sets of ice core data to look at.
3.2 Difference between the age scales DFO2006 and AICC2012
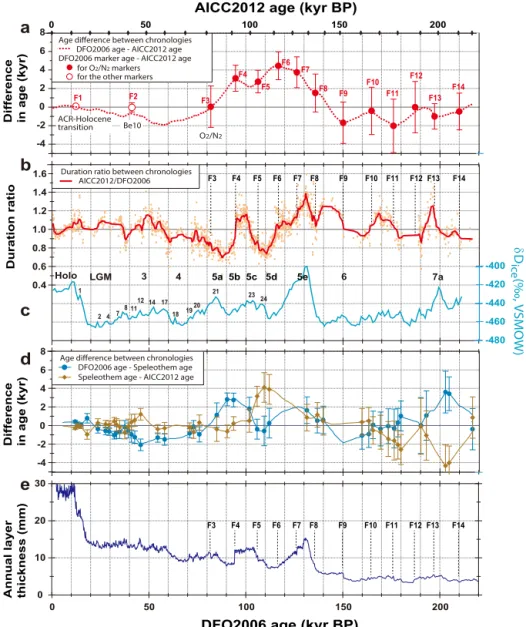
From these 1401 tie points, we can calculate the difference in age scales of the DF core and the EDC core (DF–EDC). The differences in age scales are given in Fig. 4a. We find that for the periods of MIS 1–4, 6 and 7a, the difference ranges between 0 and−2.0 kyr. In the period of MIS 5, the difference ranges between 0 and+4.5 kyr. The fact that the DFO2006 chronology is older than the AICC2012 chronol-ogy at the last interglacial had already been observed by Bazin et al. (2013; see their Fig. 7), and we confirmed this conclusion based on precise synchronization. A remarkable feature is that the age difference has peak values of+4.5 and
+3.1 kyr at MIS 5d and MIS 5b, respectively. Before MIS 5d and after MIS 5b, differences decrease from the peak values, but cover the entire MIS 5 and the late stage of MIS 6 (age younger than∼150 kyr BP).
3.3 Difference in durations between DFO2006 and AICC2012 age scales
We also investigated the difference in durations of various timescales between DFO2006 and AICC2012. In Fig. 4a, the variable slope of the red profiles is related to the ratio of du-ration on DFO2006 and AICC2012. A positive (negative) slope from the past toward present means longer (shorter) durations on AICC2012 compared to those on DFO2006. In Fig. 4b, ratios of duration (in this paper called the duration ra-tio) between AICC2012 and DFO2006 ages are calculated by dividing durations in AICC2012 by durations in DFO2006 at each interval of the 1401 tie points. A smoothed line (50-point smoothing of the raw data; dots) shows the mean ten-dency. The duration ratio has large fluctuations. The smallest value (0.7) and largest value (1.4) are found at MIS 5a and MIS 5e, respectively. The duration ratio is relatively stable between the Holocene and MIS 4 (94.2 kyr BP) with a σ
Be-14 12 10 8 6 4 2 0 1185 1180 1175 1170 512 513 514 515 517 518
519 520521
522 523 524 525 526 527 528 529
530 531 532
534 535 536
537 538
539
540 541 542 543 544 545
546 DF1 ECM 1.0 0.8 0.6 0.4 0.2 0.0 1185 1180 1175 1170 513 515 517 518
519 520 521 522
523
524 525 526 527
528
529 530 531 532 534 535
536
537 538
539
540 541 542 543 544 545
546 DF1 ACECM 5 4 3 2 1 0 1185 1180 1175 1170 512 513 515 516 517
519 520521 522 527 529 530 531 532
534 535 536 538 539 540 541 542 543 545 546 DF2 ACECM 1.4 1.2 1.0 0.8 0.6 0.4 0.2 0.0 1185 1180 1175 1170 512 513 514 515 516 517 518
519 520521 522
524 526 527 528 529 530 531 532 534 535 536537 538 539 540 541 542 543 545 546 DF2 ECM 120 100 80 60 40 20 0 5 9 0 1 0 9 0 1 5 8 0 1 0 8 0 1 512 513 515 516 517 518 519 520 521 522 523 524 525 526 527 528
529 531 533
534 535 536537 541 542 543 545 546 EDC ECM 40 30 20 10 0 512 513 515 516 517 518 519 520 521 522 523 524 525 526 527 528
529 531 533
534 535 536537 541 542 543 545 546 5 9 0 1 0 9 0 1 5 8 0 1 0 8 0 1 EDC DEP 1200 800 400 0 512 513 515 516 517 520 521 522
523 524 525 527
528
529 531
534
535 536 537 538 539 541 542 543 545
546 5 9 0 1 0 9 0 1 5 8 0 1 0 8 0 1 EDC Sulfate Depth (m)
DF core y values (arbitrary unit)
EDC core y values (arbitrary unit)
Suggested depths of DF-EDC tie points
a
b
c
d
e
f
g
h
528 519 514T1 T2 T3 T4
N of tie points (kyr )
-1
2000
1600
1200
800
400
0
10
DF
EDC
Depth (m)
DFO2006 age (kyr BP)
200 150
100 50
0 0 20 30
Tie points
200 150
100 50
0
AICC2012 age (kyr BP)
Holo LGM 3 4 5a 5b 5c 5d 5e 6 7a
-480 -460 -440 -420 -400
1
247 8 1112 14 17
1819 20
21 24 23
δ
D (‰, VSMOW)
ice
Figure 3. Result of volcanic synchronization: DF depth–EDC
depth on a tentative common age scale DFO2006 (bottom axis). AICC2012 scale is also given on the top axis as a reference. Blue trace with indications of the marine isotope stages and Antarctic iso-tope maxima (AIM) isδDiceof DF core averaged over every 1 kyr
for reference (Uemura et al., 2012). Black vertical markers are loca-tions of the tie points on the age scale. The green histogram shows the number of tie points found over every 1 kyr interval.
tween 216 and 150 kyr BP,σ is 0.10. Clearly, fluctuation of the duration ratio is large between MIS 5 and the late stage of MIS 6.
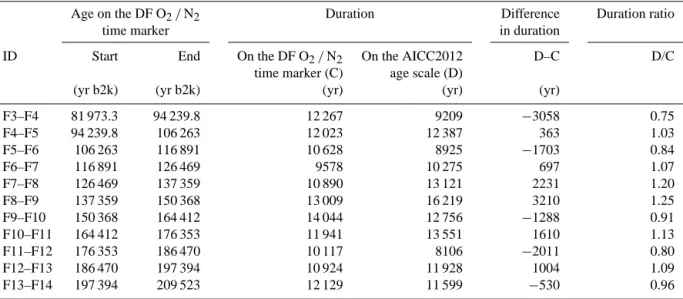
In addition, the duration ratio between intervals defined by the O2/N2age markers (Table 3), which occur on preces-sional (9–14 kyr) timescales, was examined. In intervals of the precessional cycles of the O2/N2age markers, the dif-ference in durations ranges approximately within±3 kyr. As a result, the duration ratio ranges between 0.75 and 1.25.
4 Discussion
We first describe what may potentially cause the age dif-ferences. After that, phasing between the deuterium records of ice, δDice (‰, VSMOW), is described. We also exam-ine compatibility between several examples of the tephra matches and the matches of the volcanic marker (acidic) peaks. The age scale for the DF core, DFO2006, is an inter-polation between the O2/N2 age constraints using glacio-logical ice flow modelling (Kawamura et al., 2007). In con-trast, the age scale AICC2012 is the best compromise be-tween a background chronology (based on modelling of the SMB, snow densification into ice and ice flow) and observa-tions (absolute ages or certain reference horizons, and strati-graphic links among several cores and orbital ages; Bazin et al., 2013). AICC2012 is more a “glaciological chronology” than DFO2006 is because it gives more weight to the glacio-logical sedimentation models. Therefore, the age differences between the two chronologies are caused by both dating
ap-proaches and the complex effects from elements used in the dating approaches. To understand the age differences, we should consider (i) errors in age constraints, (ii) SMB errors, (iii) errors in estimation of ice thinning, (iv) possible propa-gation of the errors through stratigraphic links, and (v) effects from differences in the dating approaches.
4.1 Examination of chronologies in terms of age markers
4.1.1 Comparison of the DFO2006–AICC2012 ages with the ages of the absolutely dated speleothem records from China
In order to examine possible causes of the DFO2006– AICC2012 age differences, DFO2006 and AICC2012 ages are compared with the ages of the absolutely dated speleothem records from China (hereinafter referred to as speleo-age; Cheng et al., 2009) based on synchronization between the EDC core record and the Chinese speleothem records (Barker et al., 2011) and on the DF–EDC volcanic synchronization. The ages of speleothems from Sanbao Cave were determined using the230Th dating technique by Cheng et al. (2009). Speleothem synchronization makes the assump-tion that rapid changes in speleothemδ18O are synchronous with rapid changes in the temperatures in Greenland, which were in turn deduced as the break points in the slope of the AntarcticδDicerecord. Details of the comparison are given in Fig. 4d. At MIS 1–5a, 5e and 6, both chronologies (DFO2006 and AICC2012) are within 2 kyr of the speleo-age. At MIS 5b, the speleo-age and the AICC2012 ages agree quite well, whereas only the DFO2006 age deviates by up to 3 kyr. In contrast, at MIS 5d, the speleo-age and the DFO2006 ages agree quite well, whereas only the AICC2012 age deviates by up to 4 kyr. At MIS 7a, the DFO2006 and the AICC2012 ages agree well, whereas only the speleo-age deviates by up to 4 kyr. However, the features used to match the speleothem with the EDCδDiceat this depth are ambiguous, so it is pos-sible that the matching process at this depth is in error. In summary, based on the comparison with the ages of the ab-solutely dated speleothem records, we suggest the following.
i. Except at MIS 5b and MIS 7a, the DFO2006 chronol-ogy is supported by the absolutely dated speleothem records from China. At MIS 5b, DFO2006, one of the O2/N2age markers with the ID F4 at 94.2 (±1.4) kyr BP (on DFO2006), deviates from the speleothem ages by about 3 kyr toward the older direction. On the other hand, in the interval 0–100 kyr BP, the AICC2012 and speleothem ages agree very well. Thus, from this com-parison, it is very likely that one of the O2/N2 age markers at 94.2, (±1.4) kyr BP at MIS 5b is a major source of error.
DFO2006 age (kyr BP)
200 150
100
AICC2012 age (kyr BP)
b
-4 -2 0 2 4 6 8Age difference between chronologies
DFO2006 marker age - AICC2012 age
for the other markers DFO2006 age - AICC2012 age
for O2/N2 markers
Difference in age (kyr)
a
Be10 ACR-Holocene transition
O2/N2
F1 F2
F3 F4
F5 F6
F7
F8 F9
F10 F11
F12
F13 F14 50
0
-4 -2 0 2 4 6 8
Age difference between chronologies DFO2006 age - Speleothem age Speleothem age - AICC2012 age
Difference in age (kyr)
0.4 0.6 0.8 1.0 1.2 1.4 1.6
200 150
100 50
0
Duration ratio
Duration ratio between chronologies AICC2012/DFO2006
d
c
30
20
10
0
Annual layer thickness (mm)
F3 F4 F5 F6 F7 F8 F9 F10 F11 F12 F13 F14 F3 F4 F5 F6 F7 F8 F9 F10 F11 F12 F13 F14
e
-480 -460 -440 -420 -400
Holo LGM 3 4 5a 5b 5c 5d 5e 6 7a
1
24 7 8 1112 14 17
18 19 20
21 24 23
δ
D (‰, VSMOW)
ice
Figure 4.Comparison between DFO2006 age and AICC2012 age plotted on a common age scale. We use the DFO2006 scale at the bottom axis with the AICC2012 scale at the top axis. For all these figures, details are given in the main text. (a) Age difference between the two chronologies [DFO2006 age – AICC2012 age] (red dotted line). In addition, this age difference is compared with the age difference [DFO2006 marker age – AICC2012 age]. Information of the DFO2006 marker age is from Table 2. (b) Ratios of durations (duration ratio) between AICC2012 ages and DFO2006 ages are calculated as duration on AICC2012 divided by duration on DFO2006 at each interval of the 1401 tie points. A smoothed line with 50-point smoothing of the raw data (dots) shows the mean tendency. Again, ages of the O2/N2
age markers (Table 3) are shown. (c) Blue trace with indications of the marine isotope stages (MIS) and Antarctic Isotope Maxima (AIM) isδDiceof DF core averaged over every 1 kyr for reference (Uemura et al., 2012). (d) DFO2006 and AICC2012 ages are compared with
the ages of the Chinese speleothem age (speleo-age) (Cheng et al., 2009) based on a link of the EDC core record to the Chinese speleothem records (Barker et al., 2011). The age differences [DFO2006 age – speleo-age] (blue line) and the age differences [speleo-age – AICC2012 age] (yellow line) are given. Note that a reason for not subtracting speleo from both is to make comparison between Fig. 4a and d easier at MIS 5. Solid symbol markers (both circles and diamonds) with indicated uncertainty are from tie points between the EDC core record and the speleothem records (Table S1 in Barker et al., 2011). (e) Thickness of annual layers in the Dome Fuji ice core was calculated on DFO2006 chronology. Ages of the O2/N2age markers (listed in Table 2) are shown. We can observe a step in the annual layer thickness at
the age marker at 94.2 kyr BP (ID: F4).
5d, AICC2012 deviates from the speleothem ages by about 4 kyr toward the younger direction. On the other hand, at MIS 5d, the DFO2006 and speleothem ages agree very well. Thus, it is very likely that an error
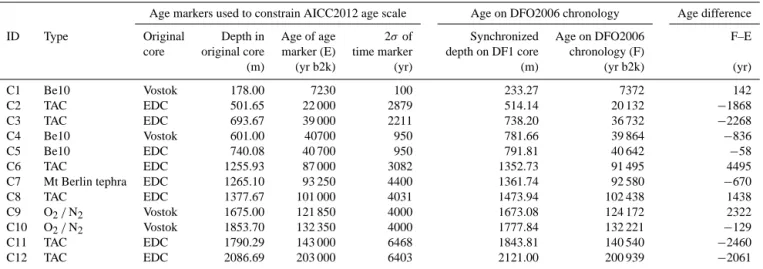
Table 2.Depths and AICC2012 ages of EDC core at depth/age of age markers of DF core.
DF corea EDC coreb Age
difference ID Type Depth of Age of age 2σof Synchronized depth Age on AICC2012 A–B
DF1 core marker (A) age marker on EDC99 core chronology (B)
(m) (yr b2k) (yr) (m) (yr b2k) (yr) F1 ACR–Holocene 371.00 12 390 200 371.46 12 296 94 F2 Be10 peak 791.00 41 205 500 739.35 41 227 −22 F3 O2/N2 1261.55 81 973 2230 1170.17 81 923 50
F4 O2/N2 1375.69 94 240 1410 1278.73 91 132 3108
F5 O2/N2 1518.87 106 263 1220 1417.10 103 518 2745
F6 O2/N2 1605.26 116 891 1490 1498.03 112 443 4448
F7 O2/N2 1699.14 126 469 1660 1614.13 122 718 3751 F8 O2/N2 1824.78 137 359 2040 1769.25 135 839 1520
F9 O2/N2 1900.68 150 368 2230 1849.02 152 058 −1690
F10 O2/N2 1958.32 164 412 2550 1910.13 164 814 −402
F11 O2/N2 2015.00 176 353 2880 1969.00 178 365 −2012
F12 O2/N2 2052.25 186 470 2770 2008.59 186 471 −1
F13 O2/N2 2103.11 197 394 1370 2066.08 198 399 −1005
F14 O2/N2 2156.64 209 523 1980 2131.85 209 998 −475
aAge markers of DF core is from Kawamura et al. (2007).bAICC2012 chronology is from Bazin et al. (2013).
iii. At MIS 7a, only the absolute speleothem age deviates. This may suggest that an incorrect matching between the speleothem and ice core rapid changes has been made.
In addition, we find another feature of the DFO2006 chronol-ogy to support the belief that the 94.2 (±1.4) kyr BP age at MIS 5b is in error. In Fig. 4e, we show the thicknesses of annual layers in the ice sheet, calculated from a relation between depth and age. We find a sharp step of the annual layer thickness at 94.2 kyr BP. Such a step needs anomalous flow if this result is real. We note that annual layer thickness does not have such a step at 94.2 kyr BP on the AICC2012 chronology. We also note that we still find a few other such steps at F9 and F12. However, these steps are very small compared to the step at F4. From the step at F4, we deduce that the step will become smaller if we shift the 94.2 kyr BP age constraint toward the younger direction. This agrees with the possible 3 kyr error toward the older direction identified by comparison with the speleothem records.
Moreover, in Fig. 4b, the duration ratio has a sharp step at 94.2 kyr BP, suggesting that the age constraints with the
∼3 kyr error caused a bias to the duration ratio; before (after) the 94.2 kyr BP age constraint, the ratio is larger (smaller) because of the smaller (larger) denominator in the AICC2012/DFO2006 duration ratio. Thus, the duration ra-tios at intervals F3–F4 and F4–F5 are affected by the∼3 kyr error.
4.1.2 Cross-checks between the DFO2006–AICC2012 chronologies and their age markers
DFO2006 age (kyr BP)
200 150
100
AICC2012 age (kyr BP)
-4 -2 0 2 4 6 8
TAC TAC Be10
TAC
Volcanic marker
TAC
TAC TAC
Be10
Be10
O2/N2
O2/N2
C1
C2 C3 C5 C4
C6
C7 C8
C9
C10
C11 C12
Age difference between chronologies DFO2006 age - AICC2012 marker age
for age markers from the Vostok core for age markers from the EDC core
DFO2006 age - EDC3 age
Difference in age (kyr)
50 0
-4 -2 0 2 4 6 8
Age difference between chronologies DFO2006 age - DFGT2006 marker age
DFO2006 age - DFGT2006 age
for the other markers for O2/N2 markers
Volcanic marker Be10
ACR-Holocene transition
Termination II O2/N2
Difference in age (kyr)
200 150
100 50
0
b
a
Figure 5.Comparisons between DFO2006 age and AICC2012 age are plotted on a common age scale. Again, as in Fig. 4, we use the DFO2006 scale at the bottom axis with the AICC2012 scale at the top axis. (a) The age difference between the two chronologies [DFO2006 age – AICC2012 age] (red dotted line reproduced from Fig. 4a) is compared with age difference [DFO2006 age – AICC2012 marker age]. Information of the AICC2012 age markers is from Table 4. The age difference [DFO2006 age – EDC3 age] is shown as a purple line.
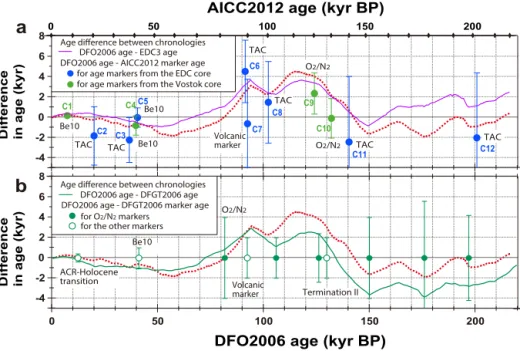
(b) DFO2006 age, the O2/N2chronology of the DF core is compared with “DFGT2006”, the glaciological chronology of the same DF core.
It is shown as [DFO2006 age – DFGT2006 age] (green line in the figure). Although the age markers of the two chronologies have no age differences, DFGT2006 uses a smaller number of markers and has a larger uncertainty setting to less constrain the age by the age markers. We observe that the green line and [DFO2006 age – AICC2012 age] (red dotted line reproduced from Fig. 4a) have similar variations with peak differences at MIS 5b and 5d.
constraints, the AICC2012 chronology at MIS 5d is out of the acceptable range.
In Fig. 5a, the data points are not on the DFO2006– AICC2012 age difference (red dotted line) because AICC2012 is a glaciological timescale. In Fig. 5a, the num-ber at each data point is the ID of each age marker in Ta-ble 4. Blue symbols and green symbols are for age mark-ers from the EDC core and the Vostok core, respectively (Bazin et al., 2013). The O2/N2 age markers with IDs C9 and C10 are from the Vostok core, originally published by Suwa and Bender (2008). Bazin et al. (2013) attributed 4 kyr as the 2σ confidence intervals of these O2/N2age markers instead of the 2 kyr intervals originally assessed by Suwa and Bender (2008). Bazin et al. (2013) used conservative values of the uncertainty because of their questions about the phas-ing of the local insolation curve and O2/N2curve. However, we use here the 2 kyr intervals given by the original authors. This choice is supported partly by the fact that the DFO2006 chronology agrees well with the absolutely dated speleothem records from China except at MIS 5b and MIS 7a. We find here that the DFO2006–AICC2012 age differences nearly vi-olate the 2σconfidence intervals of the O2/N2constraints at points C9 and C10; again, in terms of the O2/N2age
con-straints, AICC2012 chronology at MIS 5d is out of the ac-ceptable range.
A remarkable feature in Fig. 5a is that in periods of MIS 5c, 5d and 5e, the DFO2006–AICC2012 age differences (red dotted line) are systematically larger than values of [DFO2006 age – AICC2012 marker age] by 1–3 kyr. Thus, the 1–3 kyr differences are apparently not driven by the age incompatibility between the ice age markers used for estab-lishing the two chronologies. Below we examine the remain-ing possibilities.
4.2 Possible causes of the DFO2006–AICC2012 age differences at around MIS 5d
4.2.1 Possible effects of ice thinning
Table 3.Duration between O2/N2time markers on two different timescales and their differences and ratio.
Age on the DF O2/N2 Duration Difference Duration ratio
time marker in duration
ID Start End On the DF O2/N2 On the AICC2012 D–C D/C
time marker (C) age scale (D)
(yr b2k) (yr b2k) (yr) (yr) (yr)
F3–F4 81 973.3 94 239.8 12 267 9209 −3058 0.75 F4–F5 94 239.8 106 263 12 023 12 387 363 1.03 F5–F6 106 263 116 891 10 628 8925 −1703 0.84 F6–F7 116 891 126 469 9578 10 275 697 1.07 F7–F8 126 469 137 359 10 890 13 121 2231 1.20 F8–F9 137 359 150 368 13 009 16 219 3210 1.25 F9–F10 150 368 164 412 14 044 12 756 −1288 0.91 F10–F11 164 412 176 353 11 941 13 551 1610 1.13 F11–F12 176 353 186 470 10 117 8106 −2011 0.80 F12–F13 186 470 197 394 10 924 11 928 1004 1.09 F13–F14 197 394 209 523 12 129 11 599 −530 0.96
by radio echo sounding. We can see the isochronal layers at Dome Fuji (Fujita et al., 1999, 2012; Steinhage et al., 2013) and those at Dome C (Cavitte et al., 2013; Tabacco et al., 1998).
4.2.2 Influence by links from other cores
We consider a possibility of complex effects of the other ice core orbital markers and numerous stratigraphic links with the influence of background scenarios. Bazin et al. (2013) used numerous gas age markers of δ18Oatm from the Vos-tok core and the TALDICE core for periods covering MIS 5. These numerous gas age makers are linked with the ice age of the AICC2012 through assumptions of firn thicknesses at each site and lock-in depths. However, there is a circum-stantial evidence that raises the possibility of influence by links from other cores. The previous age scale of the EDC core is known as EDC3 (Parrenin et al., 2007a). EDC3 is the glaciological chronology based on the use of a set of in-dependent age markers as well as the SMB and mechani-cal flow modelling. Bazin et al. (2013) showed that the tim-ing and duration of MIS 5 in AICC2012 is basically un-changed compared to EDC3. We performed analysis of the DFO2006–EDC3 age difference in the same way as the anal-ysis of the DFO2006–AICC2012 age difference. We found that the basic profile of the DFO2006–EDC3 age difference is similar to the DFO2006–AICC2012 age difference (pur-ple line in Fig. 5a). Again, we find a peak value of+3.6 kyr at MIS 5d. Because the EDC3 age scale is independent of any stratigraphic links to other ice cores, appearance of this peak value means that influence by links from other cores introduced to the AICC2012 gave no major effects to the ob-served features of the age differences. In addition, accord-ing to Bazin et al. (2013), the ice age difference between the O2/N2chronology and theδ18Oatmchronology on the
Vos-tok ice has no anomalous biases that occur particularly at periods around MIS 5 (see Fig. 4 in Bazin et al., 2013). We therefore exclude this possibility as well.
4.2.3 Influence of surface mass balance
We are interested in the remaining possibility – errors in es-timating SMB at around MIS 5d in the glaciological flow modelling. To examine this possibility, we introduce a com-parison between DFO2006 chronology with the glaciologi-cal chronology of the same DF core, DFGT2006 (Parrenin et al., 2007a) in Fig. 5b. DFGT2006 is a timescale based on a sedimentation model, with sedimentation parameters be-ing constrained usbe-ing some dated horizon. It is not strictly constrained to dated horizons, as DFO2006 is. In Fig. 5b, we find that the DFO2006–DFGT2006 age difference has a peak of difference at 5d, very similar to both the variation of the DFO2006–AICC2012 age difference (Fig. 4a) and that of the DFO2006–EDC3 age difference (Fig. 5a). Based on this similarity, we hypothesize that the DFO2006–AICC2012 age difference at MIS 5d is mostly related to a difference in dat-ing approaches, between the O2/N2age-marker-based dat-ing and the glaciological datdat-ing. We argue that the most plau-sible cause is the error in estimation of SMB.
Table 4.Depths and DFO2006 ages of DF core at depth/age of age markers of AICC2012 chronology.
Age markers used to constrain AICC2012 age scale Age on DFO2006 chronology Age difference
ID Type Original Depth in Age of age 2σof Synchronized Age on DFO2006 F–E
core original core marker (E) time marker depth on DF1 core chronology (F)
(m) (yr b2k) (yr) (m) (yr b2k) (yr)
C1 Be10 Vostok 178.00 7230 100 233.27 7372 142
C2 TAC EDC 501.65 22 000 2879 514.14 20 132 −1868
C3 TAC EDC 693.67 39 000 2211 738.20 36 732 −2268
C4 Be10 Vostok 601.00 40700 950 781.66 39 864 −836
C5 Be10 EDC 740.08 40 700 950 791.81 40 642 −58
C6 TAC EDC 1255.93 87 000 3082 1352.73 91 495 4495
C7 Mt Berlin tephra EDC 1265.10 93 250 4400 1361.74 92 580 −670
C8 TAC EDC 1377.67 101 000 4031 1473.94 102 438 1438
C9 O2/N2 Vostok 1675.00 121 850 4000 1673.08 124 172 2322
C10 O2/N2 Vostok 1853.70 132 350 4000 1777.84 132 221 −129
C11 TAC EDC 1790.29 143 000 6468 1843.81 140 540 −2460
C12 TAC EDC 2086.69 203 000 6403 2121.00 200 939 −2061
4.3 Phasing between 216 kyr longδDicerecords at
Dome Fuji and Dome C
In this section, we discuss phasing between the 216 kyr long
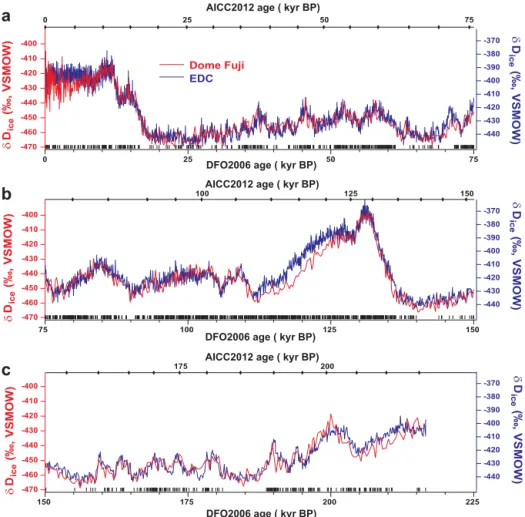
δDice records in the DF and EDC cores. Our intention is to investigate possible differences in timing in theδDicerecords from the two remote dome sites in East Antarctica. δDice records at DF and EDC are from Uemura et al. (2012) and Jouzel et al. (2007), respectively. In Fig. 6, they are plotted against common chronologies, again DFO2006 on the bot-tom axis and AICC2012 on the top axis. Each of the three graphs shows an age span of 75 kyr. From look at the phasing closely it is apparent that there are stages where there are dif-ferences in graph shapes. A remarkable feature is that, over a period of approximately 20 kyr at MIS 5d–5e, the decrease in theδDicerecord at DF leads the decrease in theδDicerecord of the EDC (see Fig. 6b). Another noticeable feature is that EDC signals seem to lead at ∼200 kyr BP. In order to see the average phasing over the 216 kyr, the correlation coeffi-cient of theδDicerecords, shifted byxyears, was calculated. The result is shown in Fig. 7. The correlation coefficient has a maximum when DF leads by 60 years. However, we ob-serve that the peak in this graph has an asymmetric shape; the left side slope is steeper than the right side slope. If we consider this asymmetry, the actual centre of this peak (as a result of peak fittings) is+126 years. To investigate this fea-ture more closely and as a function of time, the correlation coefficient of theδDicerecords, shifted byxyears, was cal-culated on 20 000-year time windows. The calculation was repeated at every 10 000 years. In Fig. 8, the maximum of correlation on each 20 000-year time window is given. It is remarkable in this graph that the lead of DF is between
∼ +710 years at 120 kyr BP (at MIS 5d) and −230 years at 200 kyr BP (at MIS 7a). On average, the lead of DF is
+98 years. This averaged lead (+98 years) is consistent to the lead of the peak value (+60 years) and to the actual peak centre (+126 years). These features are very interesting. But
they open many questions as to causes of the time-dependent phasing. We observe some systematic features: (i) peaks of the DF lead tend to appear over colder periods (180 kyr BP at the beginning of MIS 6, 120 kyr BP at MIS 5d and 60–80 kyr BP at MIS 4); (ii) the lead of DF is weak at some cold pe-riods such as the Last Glacial Maximum, end of MIS 6 and so on; (iii) the lead of DF is very weak, or the lead of EDC appears several times during warm periods, at the Holocene, MIS 5a–5b, MIS 5e and MIS 7a.
We argue that the observed features above are not caused by errors in synchronization as it is very unlikely that our pattern matching caused a systematic shift in synchroniza-tion. Even if some points were mismatched within the pat-tern matching, such errors would be random, and they would cancel each other out in the correlation analysis. We argue that the appearance of the phase shift is real. If we assume that most of the millennial-scale changes are following the bipolar seesaw pattern, then the Southern Ocean signal likely has a delay in it (WAIS Divide Project Members, 2015) com-pared to the Northern Hemisphere signal. It seems plausible that the delay is a little less in the Atlantic compared to the Indian and Pacific sectors. We therefore suggest that an aver-age delay as small as+60 to+126 years can occur naturally. In future studies, we clearly need further exploration of the time-dependent variations in the phasing. This topic requires comprehensive discussions combining knowledge of palaeo-climatic records, climate dynamics and ice sheet dynamics, which is beyond the scope of this paper.
4.4 Comparison with stratigraphic links of visible ash layers
-470 -460 -450 -440 -430 -420 -410 -400
225 200
175 150
-440 -430 -420 -410 -400 -390 -380 -370
-470 -460 -450 -440 -430 -420 -410 -400
150 125
100 75
-440 -430 -420 -410 -400 -390 -380 -370
-470 -460 -450 -440 -430 -420 -410 -400
75 50
25 0
-440 -430 -420 -410 -400 -390 -380 -370
DFO2006 age ( kyr BP)
Dome Fuji EDC
75 50
25 0
150 125
100
200 175
DFO2006 age ( kyr BP) DFO2006 age ( kyr BP) AICC2012 age ( kyr BP)
AICC2012 age ( kyr BP)
AICC2012 age ( kyr BP)
a
b
c
δ
D (‰, VSMOW)
ice
δ
D (‰, VSMOW)
ice
δ
D (‰, VSMOW)
ice
δ
D (‰, VSMOW) ice
δ
D (‰, VSMOW) ice
δ
D (‰, VSMOW) ice
Figure 6.In order to observe phasing betweenδDicerecords at the DF and EDC ice cores, these isotopic records are plotted versus common
chronologies, again tentatively DFO2006 on the bottom axis and AICC2012 on the top axis. Each of the three graphs shows an age span of 75 kyr. At the bottom of each graph, the timing of the 1401 tie points is shown.
Phasing (years)
0.940.93
0.92
0.91
0.90
0.89
0.88
1000 500
0 -500
-1000
peak: +60
weighted centre: +126
r
DF leads EDC leads
Figure 7. In order to see the average phasing over the 216 kyr, the correlation coefficient (r in the left axis) of theδDicerecords, shifted byxyears (bottom axis), was calculated.rhas a peak value when DF leads by+60 years. Considering the asymmetry of the peak shape, the weighted centre was calculated to be+126 years.
-480 -460 -440 -420 -400
DFO2006 age (kyr BP)
200 150
100
AICC2012 age (kyr BP) 50
0
200 150
100 50
0
Holo LGM 3 4 5a 5b 5c 5d 5e 6 7a
1
24 7 8 1112 14 17
18 19 20
21 24 23 800
600
400
200
0
-200
Phasing (years)
Positive values: DF lead Negative values: EDC lead
δ
D (‰, VSMOW)
ice
Figure 8.To investigate features of the phasing between theδDice records as a function of time, the correlation coefficient of theδDice
records, shifted byxyears, was calculated on 20 000-year time windows. The calculation was repeated for every 10 000 years. The maximums of correlation on each 20 000-year time window are given with red marker symbols and lines. Positive and negative values mean lead of DF and EDC, respectively. Blue trace with indications of the marine isotope stages and Antarctic isotope maxima (AIM) isδDiceof DF core
averaged over every 1 kyr for reference (Uemura et al., 2012).
highlights the danger of using even partly geochemically fin-gerprinted stratigraphic matches of single layers in isolation, especially across the continent, where it will be unusual for tephras transported in the troposphere to be recorded simul-taneously at such distant sites as EDC and DF.
5 Concluding remarks and future prospects
Based on the DF–EDC synchronization with the 1401 tie points, a precise comparison between several important age models was carried out. The models include DFO2006, AICC2012, EDC3, DFGT2006 and ages of the speleothem records from China. This comparison between various chronologies brought us new insights into the chronologies of deep ice cores as well as the relationship between climatic records from the two sites. Important results are summarized as follows.
i. Two very deep ice cores in East Antarctica drilled at Dome Fuji and Dome C were precisely synchronized in the ice phase using 1401 tie points for a very long period covering the last 216 kyr.
ii. Now and in the future, analyses of ice core records over 216 kyr can be conducted precisely on a common age scale, either AICC2012, DFO2006 or an improved age model combining both cores.
iii. For a long period of the latest 100 kyr, the AICC2012 chronology compares well with the speleothem age, suggesting that AICC2012 is the most reliable age model for this time interval.
iv. At MIS 5d, 5e and 6, the DFO2006 chronology com-pares well with the speleothem age, suggesting that DFO2006 is reliable in this time interval.
v. At MIS 7a, even the ages inferred from the absolutely dated speleothem records from China may have errors as large as 4 kyr, a matter that should be further investi-gated. This may suggest that an incorrect matching be-tween the speleothem and ice core rapid changes has been made.
vi. Duration ratio (AICC2012 / DFO2006) ranges between 0.7 at MIS 5a and 1.4 at MIS 5e. Fluctuations are large at MIS 5. The fluctuation in the duration ratio is clearly caused by the complex effects of the errors in the two chronologies. Thus, we must be very careful in estima-tions of duraestima-tions in climate modelling and flux studies where correct values of durations are very important.
vii. One of the O2/N2 age markers in the DF core at 94.2 kyr BP probably has an error of 3 kyr toward the older direction, which should be further investigated by additional ice core measurements of O2/N2.
viii. At MIS 5d, 5e and late stage of 6, the glaciological ap-proach of the age models is very likely to have suffered from errors in estimation of surface mass balance.
ix. Analysis for the phasing betweenδDice records at DF and EDC was performed. We found that theδDice sig-nals at DF tends to lead the one at EDC, with the DF lead being more pronounced during cold periods. The lead of DF is by+710 years (maximum) at MIS 5d, −230 years (minimum) at MIS 7a and +60 to
the delay is a little less in the Atlantic compared to the Indian and Pacific sectors. This topic of the phasing requires comprehensive discussions combining knowl-edge of palaeoclimatic records, climate dynamics and ice sheet dynamics. Clearly, we need further explo-ration of both the time-dependent variations in the phas-ing and the spatial distribution of them. As a method of the future investigation, analysis of phasing among several major Antarctic deep ice cores, such as DF, EDC, EDML, Talos Dome, Vostok and WAIS cores, will be effective and necessary. Then, detailed volcanic synchronization works among these ice cores, like this study, will be a basis.
x. The reliability of the synchronization was based on a matching of patterns. During some cold periods, such a matching of patterns was impossible. For such peri-ods, we need additional information to find correlations between volcanic peak signals. In addition, this lack of matching patterns may provide us with information on depositional environments in the past.
xi. A comparison between four proposed tephra strati-graphic links and the volcanic marker peaks highlights the danger of using even partly geochemically finger-printed stratigraphic matches of single layers in isola-tion.
Appendix A: PC interface to extract tie points
Here we explain the PC interface used to search for tie points. Based on preliminary tie points, a detailed search can be con-ducted easily. Figure A1 shows the interface window. The procedures are given below. (The code of the interface is pro-vided as a Supplement (C) in this paper.)
i. Preparation of data files. Each set of ice core data (ECM, DEP, ACECM or sulfate) should have a column of its original depth, data values and tentative depth equiva-lent to a single reference core (DF1 core in the case of this study). Data on tentative depth equivalent to a sin-gle reference core must be collected prior to the use of the PC interface.
ii. Loading of data. All the data should be loaded in the program.
iii. Display graphs on PC interface. We should display a depth-dependent profile of each set of data in a PC dow. As in the example shown in Fig. A1, multiple win-dows should be aligned vertically, so that we can com-pare the features of each data set easily. Importantly, for thex axis, the tentative depth equivalent to a single ref-erence core must be used in order that the user can easily examine synchronicity between multiple sets of data. In the windows, data should be scalable both in the depth (x) directions and the data value (y) directions. In ad-dition, thex axis should be adjustable for offset of the depth scales for each core data.
iv. Extraction of local maxima from each set of data. In the data profiles, the candidates for tie points should be found by extracting local maxima (dots in the centre of graphs in Fig. 2). Importantly, the operator should be careful to maintain synchronization between graphs by adjusting the offset, otherwise it would be very difficult to find a matching pattern, and observing the pattern of the appearance of peaks is very important.
v. The operator should decide whether to select a datum or not (1/0 switches in the right side of the image, in case of this study) by clicking “Record” on the right, the data – depth of peak, peak height and background level – should be recorded only for chosen data.
Appendix B: Confidence level of the tie points
We examine occurrence probability for choosing wrong tie points in the DF–EDC volcanic synchronization. As we de-scribed in the main text, our synchronization work was based on evaluation of pattern matching by careful observation of the shape, size and synchronicity of the candidate peaks. We describe here as to how accidental errors can rarely happen within the pattern matching. The sequence of the 1401 tie points are distributed on a smooth profile in Fig. B1. The 1401 DF–EDC tie points were within time span of the past 216 kyr. Thus, the average time span from one tie point to another is∼154 years although the tie points are distributed irregularly along time. Along the sequence of the irregularly distributed tie points, deviation of each tie point from an in-terpolated track of the surrounding tie points is in most cases within 0.1 m, as we discuss below. As the volcanic signal fre-quency in our proxy records is as rare as every∼154 years (on average), the probability for the accidental appearance of confusing volcanic signals within depths of∼0.1 m between two cores is very slight.
2000
1500
1000
500
0
2000 1500 1000 500 0
DF Depth (m)
150
100
50
0
-50
EDC Depth (m)
DF depth - EDC depth (m)
Figure B1.Result of the volcanic synchronization: DF depth–EDC depth diagram (red) and DF depth–EDC depth difference (blue).
Conditions for choosing the wrong tie points by an oper-ator of the PC interface are schematically shown in Fig. B2. Our discussion here is for each single peak within matched patterns.
i. The volcanic signal 1 in the DF core and the volcanic signal 2 in the EDC core must be significantly observ-able.
ii. At the same time, the volcanic signal 1 in the EDC core and the volcanic signal 2 in the DF core must be faint or absent so as to induce misjudgement of an observer.
iii. These two peaks should be within depths of∼0.1 m or so of the location expected, assuming the layer thick-ness ratio between the adjacent volcanic match pairs re-mains constant. Otherwise, it is highly probable that the
Figure B2.Schematic illustration of choosing the wrong tie points by an operator of the PC interface. The error can occur under con-ditions described below. (i) The volcanic signal 1 in the DF core and the volcanic signal 2 in the EDC core must be significantly ob-servable. (ii) At the same time, the volcanic signal 1 in the EDC core and the volcanic signal 2 in the DF core must be faint or ab-sent. (iii) These two peaks should be within depths of∼0.1 m or so of the location expected assuming the layer thickness ratio between the adjacent volcanic match pairs remains constant. Otherwise, the observer will not think that two peak signals are candidates for a true link.
observer will not think that a pair of peak signals are candidates for tie points.
probability for the complete absence of an annual layer is greater. Nevertheless, we are still confident of the identified pattern of peak signals. Thus, a lone peak is not a source of error as far as pattern matching is confidently observed. Fig-ure B3 is given to show that candidates for the tie points were found within narrow depth range.
Along the sequence of the 1401 DF–EDC tie points, the depth span between adjacent tie points (1z) is calculated for depths of both DF and EDC cores.1zranged from 0.02 m (minimum) to∼29 m (maximum). In Fig. B3, 12X–Y plots,
1zat DF versus1zat EDC, made using a logarithmic scale both inX andY are shown. Figures labelled from a to l are for the age span of DFO2006 and at the Marine Isotope Stage (MIS) indicated in each figure. With these figures, we can see how the depth span between adjacent tie points was almost common along the DF core and along the EDC core, with only very small deviations of1zof the order of 0.1 m.
Overall, as mentioned in the main text, determination by an operator was made confidently using the shape, size and synchronicity of the candidate peaks along the two ice cores. Among them, synchronicity within each matched pattern was quite good. As a result, smooth continuity of the trace in Fig. B1 is also good. We therefore argue that they are al-most unambiguous tie points, except possible very rare cases of accidental conditions indicated in Fig. B2.
0.1 2 4 6 8 1 2 4 ∆
z at EDC (m)
0.1 2 3 4 5 6 1 2 3 4
present - 15 kyr BP MIS 1 0.1 2 4 6 8 1 2 4 0.1
2 3 4 5 6
1
2 3 4
15 kyr BP - 40 kyr BP MIS 2 0.1 2 4 6 8 1 2 4
0.1 2 3 4 5 6 1 2 3 4
40 kyr BP BP - 60 kyr BP MIS 3 0.1 2 4 6 8 1 2 4
0.1 2 3 4 5 6 1 2 3 4
60 kyr BP - 80 kyr BP MIS 4 0.1 2 4 6 8 1 2 4 0.1
2 3 4 5 6
1
2 3 4
80 kyr BP - 90 kyr BP MIS 5a 0.1 2 4 6 8 1 2 4
0.1 2 3 4 5 6 1 2 3 4
90 kyr BP -100 kyr BP MIS 5b 0.1 2 4 6 8 1 2 4
0.1 2 3 4 5 6 1 2 3 4
100 kyr BP -110 kyr BP MIS 5c 0.1 2 4 6 8 1 2 4 0.1
2 3 4 5 6
1
2 3 4
110 kyr BP -120 kyr BP MIS 5d 0.1 2 4 6 8 1 2 4
0.1 2 3 4 5 6 1 2 3 4
120 kyr BP -130 kyr BP MIS 5e 0.1 2 4 6 8 1 2 4 0.1
2 3 4 5 6
1
2 3 4
130 kyr BP -140 kyr BP MIS 5e 0.1 2 4 6 8 1 2 4
0.1 2 3 4 5 6 1 2 3 4
140 kyr BP -190 kyr BP MIS 6 0.1 2 4 6 8 1 2 4
0.1 2 3 4 5 6 1 2 3 4
190 kyr BP -216 kyr BP MIS 7a
∆
z at EDC (m)
∆
z at EDC (m)
∆z at DF (m) ∆z at DF (m) ∆z at DF (m)
a
b
c
d
e
f
g
h
i
j
k
l
∆
z at EDC (m)
Figure B3.Along the sequence of the 1401 DF–EDC tie points, the depth spans between adjacent tie points were calculated for depths of both DF and EDC cores. Here,1zi=zi+1−zi, whereiis an integer from 1 to 1400. Then,X–Yplots were made as1ziat DF versus1zi
at EDC. Figures from a to l are for age span on DFO2006 and at the marine isotope stages (MIS) indicated in each figure. With this figure, we can see to what extent depth span between adjacent tie points deviated between1zi at DF and1ziat EDC. We observe that they are in
The Supplement related to this article is available online at doi:10.5194/cp-11-1395-2015-supplement.
Author contributions. The writing of this paper was led by the two first authors: S. Fujita and F. Parrenin. Both contributed equally and shared the responsibilities for this paper, carrying out the syn-chronization work, leading discussions and overseeing the writing of this paper. S. Fujita and H. Motoyama provided the entire elec-trical profile data of the DF core. E. Wolff and M. Severi provided the EDC electrical profile data and EDC sulfate data, respectively. All authors took part in the scientific discussions.
Acknowledgements. We thank Kenji Kawamura, Ryu Uemura
and Valérie Masson-Delmotte for helpful comments on the manuscript. We wish to thank all participants in the field seasons at Dome C. The main logistic support was provided by IPEV and PNRA (at Dome C). This work is a contribution to the European Project for Ice Coring in Antarctica (EPICA), a joint European Science Foundation–European Commission scientific programme, funded by the European Union and by national contributions from Belgium, Denmark, France, Germany, Italy, the Netherlands, Norway, Sweden, Switzerland and the United Kingdom. This is EPICA publication no. 302. We also thank all the Dome Fuji Deep Ice Core Project members who contributed to obtaining the ice core samples, either through logistics, drilling or core processing. The main logistics support was provided by the Japanese Antarctic Research Expedition (JARE), managed by the Ministry of Educa-tion, Culture, Sports, Science and Technology (MEXT). This study was supported in part by a grant-in-aid for scientific research (A; 20241007) from the Japan Society for the Promotion of Science (JSPS). The manuscript was prepared with the support of a National Institute of Polar Research (NIPR) publication subsidy. This paper was greatly improved by thoughtful comments by five anonymous referees and by the editor, Ed Brook.
Edited by: E. Brook
References
Barker, S., Knorr, G., Edwards, R. L., Parrenin, F., Put-nam, A. E., Skinner, L. C., Wolff, E., and Ziegler, M.: 800 000 years of abrupt climate variability, Science, 334, 347– 351, doi:10.1126/science.1203580, 2011.
Barnes, P. R. F., Wolff, E. W., Mader, H. M., Udisti, R., Castellano, E., and Röthlisberger, R.: Evolution of chemical peak shapes in the Dome C, Antarctica, ice core, J. Geophys. Res.-Atmos., 108, 4126, doi:10.1029/2002jd002538, 2003.
Barnes, P. R. F., Wolff, E. W., and Mulvaney, R.: A 44 kyr pale-oroughness record of the Antarctic surface, J. Geophys. Res.-Atmos., 111, D03102, doi:10.1029/2005jd006349, 2006. Bazin, L., Landais, A., Lemieux-Dudon, B., Toyé Mahamadou
Kele, H., Veres, D., Parrenin, F., Martinerie, P., Ritz, C., Capron, E., Lipenkov, V., Loutre, M.-F., Raynaud, D., Vinther, B., Svens-son, A., Rasmussen, S. O., Severi, M., Blunier, T., Leuenberger,
M., Fischer, H., Masson-Delmotte, V., Chappellaz, J., and Wolff, E.: An optimized multi-proxy, multi-site Antarctic ice and gas or-bital chronology (AICC2012): 120–800 ka, Clim. Past, 9, 1715– 1731, doi:10.5194/cp-9-1715-2013, 2013.
Bender, M. L.: Orbital tuning chronology for the vostok climate record supported by trapped gas composition, Earth Planet. Sci. Lett., 204, 274–289, 2002.
Cavitte, M. G. P., Blankenship, D. D., Young, D. A., Siegert, M. J., and Le Meur, E.: Radar stratigraphy connecting Lake Vos-tok and Dome C, East Antarctica, constrains the EPICA/DMC ice core time scale, The Cryosphere Discuss., 7, 321–342, doi:10.5194/tcd-7-321-2013, 2013.
Cheng, H., Edwards, R. L., Broecker, W. S., Denton, G. H., Kong, X., Wang, Y., Zhang, R., and Wang, X.: Ice age terminations, Science, 326, 248–252, doi:10.1126/science.1177840, 2009. Cole-Dai, J. H., Mosley-Thompson, E., Wight, S. P., and
Thomp-son, L. G.: A 4100-year record of explosive volcanism from an East Antarctica ice core, J. Geophys. Res., 105, 24431–24441, doi:10.1029/2000jd900254, 2000.
Courville, Z. R., Albert, M. R., Fahnestock, M. A., Cathles , L. M. I., and Shuman, C. A.: Impacts of an accumulation hiatus on the physical properties of firn at a low-accumulation polar site, J. Geophys. Res, 112, F02030, doi:10.1029/2005JF000429, 2007. EPICA Community Members : Eight glacial cycles from an
Antarc-tic ice core, Nature, 429, 623–628, doi:10.1038/nature02599, 2004.
Fujita, S., Maeno, H., Uratsuka, S., Furukawa, T., Mae, S., Fujii, Y., and Watanabe, O.: Nature of radio-echo layering in the Antarctic ice sheet detected by a two-frequency experiment, J. Geophys. Res., 104, 13013–13024, doi:10.1029/1999JB900034, 1999. Fujita, S., Azuma, N., Fujii, Y., Kameda, T., Kamiyama, K.,
Mo-toyama, H., Narita, H., Shoji, H., and Watanabe, O.: Ice core pro-cessing at Dome Fuji Station, Antarctica., Memoirs of National Institute of Polar Research, Special Issue, 275–286, 2002a. Fujita, S., Azuma, N., Motoyama, H., Kameda, T., Narita, H.,
Fujii, Y., and Watanabe, O.: Electrical measurements from the 2503 m Dome F Antarctic ice core, Ann. Glaciol., 35, 313–320, doi:10.3189/172756402781816951, 2002b.
Fujita, S., Azuma, N., Motoyama, H., Kameda, T., Narita, H., Fujii, Y., and Watanabe, O.: Linear and non-linear relations between HF conductivity, AC-ECM signals and ECM signals of Dome F Antarctic ice core, from a laboratory experiment, Ann. Glaciol., 35, 321–328, 2002c.
Fujita, S., Okuyama, J., Hori, A., and Hondoh, T.: Metamor-phism of stratified firn at Dome Fuji, Antarctica: A mecha-nism for local insolation modulation of gas transport condi-tions during bubble close off. , J. Geophys. Res, 114, F03023, doi:10.1029/2008JF001143, 2009.
Fujita, S., Holmlund, P., Matsuoka, K., Enomoto, H., Fukui, K., Nakazawa, F., Sugiyama, S., and Surdyk, S.: Radar diagno-sis of the subglacial conditions in Dronning Maud Land, East Antarctica, The Cryosphere, 6, 1203–1219, doi:10.5194/tc-6-1203-2012, 2012.
Fujita, S., Hirabayashi, M., Goto-Azuma, K., Dallmayr, R., Satow, K., Zheng, J., and Dahl-Jensen, D.: Densification of layered firn of the ice sheet at NEEM, Greenland, J. Glaciol., 60, 905–921, doi:10.3189/2014JoG14J006, 2014.