CPD
8, 6011–6049, 2012The Antarctic ice core chronology AICC2012: 0–120 ka
D. Veres et al.
Title Page
Abstract Introduction
Conclusions References
Tables Figures
◭ ◮
◭ ◮
Back Close
Full Screen / Esc
Printer-friendly Version Interactive Discussion
Discussion
P
a
per
|
Dis
cussion
P
a
per
|
Discussion
P
a
per
|
Discussio
n
P
a
per
|
Clim. Past Discuss., 8, 6011–6049, 2012 www.clim-past-discuss.net/8/6011/2012/ doi:10.5194/cpd-8-6011-2012
© Author(s) 2012. CC Attribution 3.0 License.
Climate of the Past Discussions
This discussion paper is/has been under review for the journal Climate of the Past (CP). Please refer to the corresponding final paper in CP if available.
The Antarctic ice core chronology
(AICC2012): an optimized multi-parameter
and multi-site dating approach for the last
120 thousand years
D. Veres1,2, L. Bazin3, A. Landais3, H. Toy ´e Mahamadou Kele4,
B. Lemieux-Dudon4, F. Parrenin1, P. Martinerie1, E. Blayo4, T. Blunier5, E. Capron6, J. Chappellaz1, S. O. Rasmussen5, M. Severi7, A. Svensson5, B. Vinther5, and E. W. Wolff5
1
UJF – Grenoble 1/CNRS, Laboratoire de Glaciologie et G ´eophysique de l’Environnement (LGGE) UMR CNRS/INSU 5183, Grenoble, 38041, France
2
Institute of Speleology, Romanian Academy, 400006 Cluj-Napoca, Romania
3
Laboratoire des Sciences du Climat et de l’Environnement, UMR8212, CNRS – Gif sur Yvette, France
4
Laboratoire Jean Kuntzmann, Grenoble, France
5
Centre for Ice and Climate, Niels Bohr Institute, University of Copenhagen, Copenhagen, Denmark
6
British Antarctic Survey, Cambridge, UK
7
CPD
8, 6011–6049, 2012The Antarctic ice core chronology AICC2012: 0–120 ka
D. Veres et al.
Title Page
Abstract Introduction
Conclusions References
Tables Figures
◭ ◮
◭ ◮
Back Close
Full Screen / Esc
Printer-friendly Version Interactive Discussion
Discussion
P
a
per
|
Dis
cussion
P
a
per
|
Discussion
P
a
per
|
Discussio
n
P
a
per
|
Received: 15 November 2012 – Accepted: 19 November 2012 – Published: 3 December 2012
Correspondence to: D. Veres ([email protected])
CPD
8, 6011–6049, 2012The Antarctic ice core chronology AICC2012: 0–120 ka
D. Veres et al.
Title Page
Abstract Introduction
Conclusions References
Tables Figures
◭ ◮
◭ ◮
Back Close
Full Screen / Esc
Printer-friendly Version Interactive Discussion
Discussion
P
a
per
|
Dis
cussion
P
a
per
|
Discussion
P
a
per
|
Discussio
n
P
a
per
|
Abstract
The deep polar ice cores provide reference records commonly employed in global cor-relation of past climate events. However, temporal divergences reaching up to several thousand years (ka) exist between ice cores over the last climatic cycle. In this context, we are hereby introducing the Antarctic Ice Core Chronology 2012 (AICC2012), a new
5
and coherent timescale developed for four Antarctic ice cores, namely Vostok, EPICA Dome C (EDC), EPICA Dronning Maud Land (EDML) and Talos Dome (TALDICE), alongside the Greenlandic NGRIP record. The AICC2012 time scale has been con-structed using the Bayesian tool Datice (Lemieux-Dudon et al., 2010) that combines glaciological inputs and data constraints, including a wide range of relative and
abso-10
lute gas and ice stratigraphic markers. We focus here on the last 120 ka, whereas the companion paper by Bazin et al., (2012) focuses on the interval 120–800 ka.
Compared to previous timescales, AICC2012 presents an improved timing for the last glacial inception respecting the glaciological constraints of all analyzed records. Moreover, with the addition of numerous new stratigraphic markers and improved
calcu-15
lation of the lock-in depth (LID) based onδ15N data employed as the Datice background
scenario, the AICC2012 presents a new timing for the bipolar sequence of events over Marine Isotope Stage 3 associated with the see-saw mechanism, with maximum
differences of about 500 yr with respect to the previous Datice-derived chronology of
Lemieux-Dudon et al. (2010), hereafter denoted LD2010. Our improved scenario
con-20
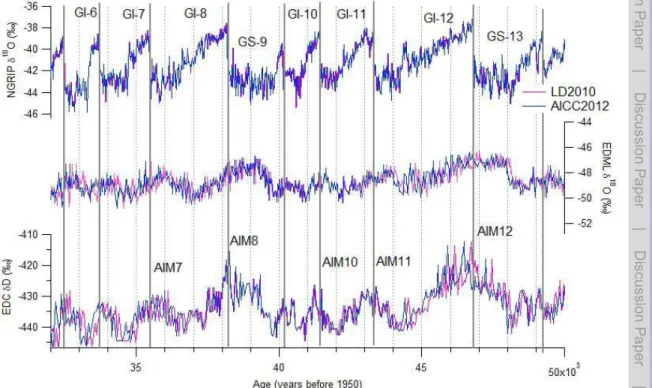
firms the regional differences for the millennial scale variability over the last glacial pe-riod: while the EDC isotopic record (events of triangular shape) displays peaks roughly at the same time as the NGRIP abrupt isotopic increases, the EDML isotopic record (events characterized by broader peaks or even extended periods of high isotope val-ues) reached the isotopic maximum several centuries before.
CPD
8, 6011–6049, 2012The Antarctic ice core chronology AICC2012: 0–120 ka
D. Veres et al.
Title Page
Abstract Introduction
Conclusions References
Tables Figures
◭ ◮
◭ ◮
Back Close
Full Screen / Esc
Printer-friendly Version Interactive Discussion
Discussion
P
a
per
|
Dis
cussion
P
a
per
|
Discussion
P
a
per
|
Discussio
n
P
a
per
|
1 Introduction
The last climatic cycle (last 120 thousand years before present, hereafter ka BP, with present defined as 1950 AD in our study) of the Earth’s climate history represents one of the best-studied periods in environmental science owing to the exceptional insights it
provides into several windows of past climate change, significantly different from each
5
other (Grootes et al., 1993; Masson-Delmotte et al., 2005; Wolff et al., 2010). These
include for example the glacial inception and abrupt centennial-to-millennial stadial and interstadial climate variability, the cryosphere expansion that culminated into full glacial climates during Marine Isotope Stages (MIS) 4 and 2, followed by the dynamic envi-ronmental changes of the last termination (NGRIP members, 2004; EPICA Community
10
Members, 2004, 2006; Pedro et al., 2011).
From the moment of their discovery decades ago in Greenland ice core records (Dansgaard et al., 1982, 1984), centennial-to-millennial scale climate oscillations, known also as Dansgaard-Oeschger (DO) events, have been the subject of intense research to document their nature, amplitude of change, and links with
paleoenviron-15
mental and low latitudes records (e.g. Grootes et al., 1993; NGRIP members, 2004; Landais et al., 2004; Masson-Delmotte et al., 2005; Huber et al., 2006; Loulergue et
al., 2008; Wolffet al., 2010). The DO events, most clearly observed in the North
At-lantic region, are recorded in Greenland ice cores as abrupt temperature increases
of 8–16◦C in a few centuries from cold periods (Greenland stadials, GS) to warm
pe-20
riods (Greenland interstadials, GI) (Lang et al., 1999; Landais et al., 2004; Huber et al., 2006), while the coolings are more gradual. Associated with the abrupt tempera-ture increases in Greenland, the so-called Antarctic Isotopic maxima (AIM) have been observed in Antarctic ice core records (e.g. EPICA Community Members, 2006). In the Antarctic records however, the water isotope variability is characterized by more
25
gradual temperature changes (2◦C per millennium), with Greenland stadials
gener-ally corresponding to periods of increasing isotope ratios in Antarctica (Blunier et al.,
CPD
8, 6011–6049, 2012The Antarctic ice core chronology AICC2012: 0–120 ka
D. Veres et al.
Title Page
Abstract Introduction
Conclusions References
Tables Figures
◭ ◮
◭ ◮
Back Close
Full Screen / Esc
Printer-friendly Version Interactive Discussion
Discussion
P
a
per
|
Dis
cussion
P
a
per
|
Discussion
P
a
per
|
Discussio
n
P
a
per
|
al., 2009; Barker et al., 2011). In addition to the ice core evidence, a range of proxies in various types of paleoclimate archives host the imprint of these climate oscillations (Voelker, 2002), with most chronologically significant constraints linked to radiocarbon-dated varved records (e.g. Bronk Ramsey et al., 2012), marine series (Lisiecki and Raymo, 2005 and references therein; Waelbroeck et al., 2008), or absolutely dated
5
cave carbonate records (Drysdale et al., 2007; Wang et al., 2008; Fleitmann et al., 2009; Badertscher et al., 2011; Boch et al., 2011).
Still, many questions remain open on the mechanisms and feedbacks within the cli-mate system that were behind the generation and propagation of these events. Such understanding would be greatly facilitated if the regional synchronicity of change and
10
timing of events (Blaauw et al., 2010; Braun et al., 2011; Klauenberg et al., 2011) could be tested with respect to the contrasting thermo-climatic relationship between the polar regions as modulated by the bipolar seesaw mechanism (Stocker and Johnsen, 2003; Pedro et al., 2011; Barker et al., 2011; Stenni et al., 2011; Buiron et al., 2012). Ad-vancements in the absolute dating and relative synchronization of records are thus
15
of primary importance for paleoclimatic archives (Blockley et al., 2012 and references therein), including ice cores (Parrenin et al., 2004, 2007, 2012a; Kawamura et al., 2007; Svensson et al., 2008; Lemieux-Dudon et al., 2010).
A significant issue when dealing with ice cores however is that two time-depth re-lationships must be assessed, one concerning the ice-phase (water isotopes,
partic-20
ulates and chemical impurities, etc.) and one for the gas-phase related proxies (CO2,
CH4, air isotopes, etc.). This particularity arises from the fact that at any depth the
en-trapped air is always younger than the surrounding ice (Sowers et al., 1992 and refer-ences therein). This age difference called∆age reflects the fact that air is isolated from the atmosphere only at 50–100 m under the ice sheet surface, where firn progressively
25
CPD
8, 6011–6049, 2012The Antarctic ice core chronology AICC2012: 0–120 ka
D. Veres et al.
Title Page
Abstract Introduction
Conclusions References
Tables Figures
◭ ◮
◭ ◮
Back Close
Full Screen / Esc
Printer-friendly Version Interactive Discussion
Discussion
P
a
per
|
Dis
cussion
P
a
per
|
Discussion
P
a
per
|
Discussio
n
P
a
per
|
Schwander et al., 1997; Arnaud et al., 2000; Goujon et al., 2003). However, studies have shown that firn densification models may provide inaccurate constrains that result
in overestimating the glacial LID and hence ∆age in remote sites of East Antarctica
where temperature and accumulation rates, particularly during glacial times, were very low (Loulergue et al., 2007; Parrenin et al., 2012b). For such settings, theδ15N of N2
5
in the ice-entrapped air, linearly linked to the height of the firn diffusive zone, gives an alternative estimate of LID. Indeed, for remote sites of East Antarctica, the depth of the firn diffusive zone deduced fromδ15N of N2is systematically lower by up to 40 m than the LID deduced from firnification models (Caillon et al., 2003; Dreyfus et al., 2007). By using a compilation of ice and gas stratigraphic markers from three Antarctic ice cores,
10
Parrenin et al. (2012b) have indeed shown that over the last deglaciation at EDC, the δ15N of N2gives a more reliable estimate of LID than firn densification modelling. Fol-lowing on these arguments, and assuming that the convective zone at the top of the
firn did not increase significantly during glacial periods, the δ15N of N2 can thus be
used alternatively to reconstruct past LID variations, with lower LID and hence∆age
15
over glacial periods than those suggested by firn densification models.
Here we report on the development of the common timescale AICC2012-Antarctic Ice Core Chronology 2012 over the last glacial period (0–120 ka BP) constructed for four Antarctic, Vostok, EPICA Dome C (EDC), EPICA Dronning Maud Land (EDML) and Talos Dome (TADICE), and one Greenland (NGRIP) ice cores. New developments
20
over the period 120–800 ka are being treated in the companion paper of Bazin et al. (2012). In the following, we first describe the initial ice core chronologies and asso-ciated dating constraints that have been implemented in AICC2012. Then, we discuss the numerous stratigraphic markers included in the inverse modelling analysis, which strongly constrain the relative timing of Greenland and Antarctic records over the last
25
CPD
8, 6011–6049, 2012The Antarctic ice core chronology AICC2012: 0–120 ka
D. Veres et al.
Title Page
Abstract Introduction
Conclusions References
Tables Figures
◭ ◮
◭ ◮
Back Close
Full Screen / Esc
Printer-friendly Version Interactive Discussion
Discussion
P
a
per
|
Dis
cussion
P
a
per
|
Discussion
P
a
per
|
Discussio
n
P
a
per
|
Supplementary Online Material (SOM) presents common material for both this work and that of Bazin et al. (2012).
2 The ice core records analyzed
Ice cores recovered from high accumulation settings, such as the Summit in Green-land or the coastal Antarctic regions, allow for reliable chronological constraints based
5
on annual or sub-annual layer counting backed by high-resolution glaciochemical and impurity records (Legrand and Mayewski, 1997; Rasmussen et al., 2006; Svensson et al., 2008, 2012). The latter parameters also allow for the identification of common stratigraphic markers that have potential in securely linking records (Zielinski, 2000;
Rasmussen et al., 2008; Wolffet al., 2009; Parrenin et al., 2012a), independently of
10
climate modulated proxies such as water isotopes frequently used in data comparison (Grootes et al., 1993; Dahl-Jensen et al., 1998; Masson-Delmotte et al., 2005; Jouzel et al., 2007). The Greenland ice records although providing exceptional resolution, are limited on a temporal scale and generally do not extend beyond MIS 5 (NGRIP Mem-bers, 2004). On the other hand, most Antarctic records, particularly the ones spanning
15
several glacial-interglacial cycles, still rely mainly on glaciological modelling, tuning to orbital parameters, or matching to other dated records for deriving age constraints (Pe-tit et al., 1999; Parrenin et al., 2001, 2004, 2007; Ruth et al., 2007; Kawamura et al., 2007).
We present below a short overview of the original timescales of the ice cores
in-20
CPD
8, 6011–6049, 2012The Antarctic ice core chronology AICC2012: 0–120 ka
D. Veres et al.
Title Page
Abstract Introduction
Conclusions References
Tables Figures
◭ ◮
◭ ◮
Back Close
Full Screen / Esc
Printer-friendly Version Interactive Discussion
Discussion
P
a
per
|
Dis
cussion
P
a
per
|
Discussion
P
a
per
|
Discussio
n
P
a
per
|
2.1 NGRIP and the composite Greenlandic ice core time scale GICC05
The GICC05 composite timescale provides the most accurate annual chronological constraints for the Greenland ice cores up to 60 ka BP. It has been constructed by annual layer counting using water isotopic data from DYE-3, GRIP and NGRIP from present and back to 7.9 ka (Vinther et al., 2006), detailed glaciochemical data from
5
GRIP and NGRIP for the last termination (Rasmussen et al., 2006), and similar pa-rameters aided by visual stratigraphy records back to 60 ka BP (Svensson et al., 2008). Because of the cumulative nature of errors when counting annual layers, the maximum counting error of the number of layers are in the order of 2–4 % for late MIS 3 and MIS 2, but exceed 5 % for the early MIS 3 interstadials GI-13 to GI-17, although absolute
10
age uncertainties (at 1σ) remain below 2.2 %.
For NGRIP record we employed the GICC05 composite time scale for the last 60 ka BP including the accumulation rate estimates derived from layer thick-ness (Svensson et al., 2008). Beyond 60 ka BP we used constraints from the GICC05modelext time scale that was constructed by patching the ss09sea modeled
15
age scale shifted −705 years in order to match it to the end of the
annual-layer-counted time scale (Wolff et al., 2010). As for GICC05, the thinning function for the
GICC05modelext was taken from the Dansgaard-Johnsen ice flow model adapted to NGRIP, whereas the accumulation rate of GICC05modelext beyond 60 ka BP was cal-culated from the water isotope data (NGRIP Members, 2004) in the absence of
contin-20
uous layer counting over that core section.
2.2 Vostok ice core record
The GT4 time-scale published by Petit et al. (1999) treated the whole length of the Vos-tok ice core corresponding to the last 400 ka BP and is based primarily on
glaciologi-cal modelling with limited point anchoring to selected intervals of marineδ18O and the
25
CPD
8, 6011–6049, 2012The Antarctic ice core chronology AICC2012: 0–120 ka
D. Veres et al.
Title Page
Abstract Introduction
Conclusions References
Tables Figures
◭ ◮
◭ ◮
Back Close
Full Screen / Esc
Printer-friendly Version Interactive Discussion
Discussion
P
a
per
|
Dis
cussion
P
a
per
|
Discussion
P
a
per
|
Discussio
n
P
a
per
|
taking into account the ice origin and a range of anchoring points (10Be alongside six
or-bital climatic links between insolation peaks and mid-slopes ofδD at Termination I with
a lag of 3000 yr). These orbital points were also included in the LD2010 timescale, but have been removed in the current AICC2012 chronology (Bazin et al., 2012), whereas the thinning scenario for Vostok initially proposed by Parrenin et al. (2004) has been
5
retained in the AICC2012 background scenario (see SOM).
2.3 EPICA Dome C (EDC) ice core record
The EDC record covers the last 800 ka BP (EPICA Community Members, 2004; Jouzel et al., 2007; Loulergue et al., 2008), and currently, analysis of this ice core relies on the EDC3 chronology proposed by Parrenin et al. (2007) based on ice flow modelling and
10
an inverse method constrained by a limited number of reference age markers. Over the last Termination, the EDC3 age scale used two methane tie points for synchroniza-tion with the layer-counted Greenland GICC05 chronology. Other age markers include an absolutely dated ash layer (Dunbar et al., 2008), peaks in cosmogenic isotopes (Raisbeck et al., 2007), and a speleothem-derived absolute age link with the abrupt
15
methane increase at Termination II, and only orbital tuning and a single absolute age
marker (the Brunhes-Matuyama reversal recorded in 10Be) beyond (Parrenin et al.,
2007). The overall uncertainty attached to the EDC3 time scale is estimated to 6000 years from 130 ka BP down to the bottom of the record.
2.4 EPICA Dronning Maud Land (EDML) ice core record 20
The EPICA Dronning Maud Land EDML-1 timescale covering the last 150 ka BP has been derived directly from the EDC3 timescale (Parrenin et al., 2007) by stratigraphic matching and data synchronization between the two ice records (Ruth et al., 2007). Over the last 128 ka BP, 322 volcanic common volcanic horizons were identified in both ice cores. Additional chronological control has been derived from dated volcanic events
25
CPD
8, 6011–6049, 2012The Antarctic ice core chronology AICC2012: 0–120 ka
D. Veres et al.
Title Page
Abstract Introduction
Conclusions References
Tables Figures
◭ ◮
◭ ◮
Back Close
Full Screen / Esc
Printer-friendly Version Interactive Discussion
Discussion
P
a
per
|
Dis
cussion
P
a
per
|
Discussion
P
a
per
|
Discussio
n
P
a
per
|
EDML-1 and EDC3 was estimated as less than 450 yr over the last 128 ka BP, and lower than 130 yr over the last 60 ka BP (Ruth et al., 2007).
2.5 Talos Dome (TALDICE) ice core record
The TALDICE ice core record drilled at Talos Dome in East Antarctica covers the last 250 ka BP (Stenni et al., 2011). The TALDICE-1 chronology first published by Buiron
5
et al. (2011) uses stratigraphic (ice and gas) markers to constrain the inverse mod-elling method of Lemieux-Dudon et al. (2010). This chronology is principally based on methane synchronizations (Blunier et al., 2007; Spahni et al., 2005; Loulergue et al., 2007) with Greenland composite and EDC records. Due to the high accumulation rates in the area, TALDICE provides decadal time resolution during the Holocene and the
10
last deglaciation. The absolute uncertainties reported were relatively small, 300 yr for early Holocene and the last deglaciation, 500 yr back to 17.5 ka BP, and up to 1500 yr for the last glacial, but increased significantly for older periods (Buiron et al., 2011).
A chronological refinement for the period 55–112 ka BP and called TALDICE-1a has been proposed by Sch ¨upbach et al. (2011) using high-resolution methane
synchroniza-15
tion to the EDC methane record (Loulergue et al., 2007, 2008). Based on this approach, and employing several newly defined tie-points, the relative uncertainties were lowered to less than 1100 yr for this interval.
3 Methodology and approach
3.1 The Datice inverse modelling 20
CPD
8, 6011–6049, 2012The Antarctic ice core chronology AICC2012: 0–120 ka
D. Veres et al.
Title Page
Abstract Introduction
Conclusions References
Tables Figures
◭ ◮
◭ ◮
Back Close
Full Screen / Esc
Printer-friendly Version Interactive Discussion
Discussion
P
a
per
|
Dis
cussion
P
a
per
|
Discussion
P
a
per
|
Discussio
n
P
a
per
|
rates, thinning function, and lock-in-depth in ice equivalent (LIDIE), and taking into ac-count independent stratigraphic markers for the ice (based on volcanogenic sulfate,
tephra, and10Be data) and gas (derived from CH4 andδ
18
Oatm), as well as absolute
and orbital age estimates. The optimization of this approach is therefore dependent also on the number, distribution and uncertainties associated with the tie-points (Buiron
5
et al., 2011). The optimization of the system provides analyzed ice and gas chronolo-gies for each ice core as well as modified glaciological quantities (i.e. thinning function, accumulation rate, and LIDIE respectively).
A detailed description of the model and its application is provided in Lemieux-Dudon et al. (2010), and information on the current constraints and application updates are
10
presented in more detail in the SOM and Bazin et al. (2012).
3.2 Application
3.2.1 Background information
A comprehensive presentation of the background parameters used (initial thinning, accumulation rate, and LID with the associated variances) is given in the SOM. For
15
our application, the aim was to produce an Antarctic chronology that was tied to GICC05 over the last 60 ka BP. This decision enables straightforward comparisons be-tween Greenland and Antarctica, without introducing a new Greenland age scale for the last 60 ka BP that based on our observations would very closely follow GICC05. We consider this approach to be justified until significant and validated new absolute
20
age markers in this age interval will be available. As a consequence, the background thinning and accumulation rate profiles for NGRIP are exactly those of GICC05 and
GICC05modelext (Svensson et al., 2008; Wolffet al., 2010). For the Antarctic ice cores,
the background thinning scenarios were deduced from glaciological models, whilst the accumulation rate was deduced from the water isotopes records through a simple
ex-25
CPD
8, 6011–6049, 2012The Antarctic ice core chronology AICC2012: 0–120 ka
D. Veres et al.
Title Page
Abstract Introduction
Conclusions References
Tables Figures
◭ ◮
◭ ◮
Back Close
Full Screen / Esc
Printer-friendly Version Interactive Discussion
Discussion
P
a
per
|
Dis
cussion
P
a
per
|
Discussion
P
a
per
|
Discussio
n
P
a
per
|
drilling sites with a complicated ice flow history (e.g. EDML (Huybrechts et al., 2007) and Vostok (Parrenin et al., 2001) on a dome flank; TALDICE (Stenni et al., 2011) with probably increased ice sheet thickness at the Last Glacial Maximum); and (2) the final accumulation rates were allowed to deviate more from the background scenarios when far from present-day values based on which the exponential law linking accumulation
5
rate and water isotopes had been calibrated.
Finally, where modelling outputs agreed with constraints from theδ15N-based
esti-mates, the background LIDIE has been calculated from firn densification models such as for TALDICE (Capron et al., 2012) or NGRIP (Landais et al., 2004; Huber et al.,
2006), respectively. At the other sites, a background scenario derived fromδ15N has
10
been chosen since it gives more plausible results over the last deglaciation at EDC (Parrenin et al., 2012b). This choice of LIDIE background scenario is important since in remote sites of East Antarctica such as Vostok and EDC, the LIDIE is almost 65 %
smaller for the glacial period when using theδ15N scenario assuming no increase of
convective zone (during glacial period) compared to the outputs derived from classical
15
firn densification modelling (Schwander et al., 1997; Arnaud et al., 2000; Goujon et al., 2003). Moreover, because there are still questions of what is the best background LIDIE
to choose between densification modelling andδ15N, larger variances for LIDIE have
been associated for these last mentioned sites where model and δ15N-derived
con-straints strongly disagree (see SOM). Finally, both LIDIE scenarios have been tested
20
(SOM), and although none of the LIDIE background scenario is fully satisfying, it con-firms the results of Parrenin et al. (2012b) that over the last deglaciation at EDC, the
LIDIE calculated from δ15N is in much better agreement with the combination of ice
and gas stratigraphic markers that the LIDIE calculated by firn densification models alone.
25
3.2.2 Ice stratigraphic markers
CPD
8, 6011–6049, 2012The Antarctic ice core chronology AICC2012: 0–120 ka
D. Veres et al.
Title Page
Abstract Introduction
Conclusions References
Tables Figures
◭ ◮
◭ ◮
Back Close
Full Screen / Esc
Printer-friendly Version Interactive Discussion
Discussion
P
a
per
|
Dis
cussion
P
a
per
|
Discussion
P
a
per
|
Discussio
n
P
a
per
|
volcanic sulphate stratigraphic marker horizons. 104 volcanic tie links were proposed following on the previous work of Udisti et al. (2004) that covered only the 0–45 ka BP interval. The synchronization-related uncertainties included in our study were grouped into three ranges, 200 yr for the last 40 ka BP, 150–350 yr between 105–145 ka BP and 500 yr for the glacial period, respectively. The relatively large uncertainty reflects the
5
fact that volcanic tie-points are not retrieved from a single core at Vostok but from a combination of ice cores with possible shifts of up to 3 m in-between the individually logged core depths (Parrenin et al., 2012a).
The EDC and EDML ice core records have also been synchronized using mainly volcanic stratigraphic markers identified in the ice phase (Ruth et al., 2007; Severi et
10
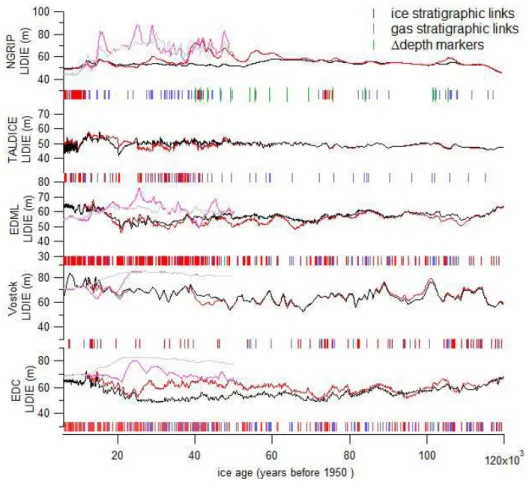
al., 2007). We have translated the original EDC96 core depths on which these markers were first proposed to the corresponding depths of core EDC99 (following the approach of Parrenin et al. (2012a)), and include in our analysis 273 stratigraphic tie links derived from these two records. The majority of the tie points cover the last 120 ka (Fig. 1). Uncertainties attached to these points were 20 yr for “certain” tie points and 100 yr for
15
“probable” tie-points, respectively, depending on the proposed confidence levels and our revision (Ruth et al., 2007; Severi et al., 2007).
The work by Severi et al. (2012) reports on the recently accomplished age scale syn-chronization between the TALDICE and the EDC ice cores, and carried on through the identification of common chemical volcanic signatures. From the range of markers
pro-20
posed we employed in our analysis 112 markers stretching over the last 42 ka BP, with attached uncertainties of 20 and 100 yr. Prior to the analysis the original EDC96 core depths on which these markers were first proposed were translated to the depths of core EDC99 (Fig. 1). Moreover, two stratigraphic tie links with uncertainties of 110 yr tie the EDC and the NGRIP records at the Laschamp geomagnetic excursion (Loulergue
25
et al., 2007).
CPD
8, 6011–6049, 2012The Antarctic ice core chronology AICC2012: 0–120 ka
D. Veres et al.
Title Page
Abstract Introduction
Conclusions References
Tables Figures
◭ ◮
◭ ◮
Back Close
Full Screen / Esc
Printer-friendly Version Interactive Discussion
Discussion
P
a
per
|
Dis
cussion
P
a
per
|
Discussion
P
a
per
|
Discussio
n
P
a
per
|
around 41 ka BP, at the time of the Laschamp geomagnetic excursion (Svensson et al., 2012). The EDML – NGRIP synchronization is further constrained by annual layer counting between the tie points, resulting in a strong interhemispheric link at decadal precision between GI-20 and AIM19/20 at the time of the Toba eruption, around 74 ka BP. From the data points proposed we used 87 tie links with 50 yr
uncertain-5
ties for the Holocene and MIS 3, and 100 yr uncertainty for these identified in late MIS 5 (Fig. 1).
No ice tie-points have been reported between Vostok and EDML, TALDICE or NGRIP, or between TALDICE and EDML, nonetheless doing such an exercise could provide redundant information given the stratigraphic ice core pairing already reported
10
above.
3.2.3 Gas stratigraphic markers
Methane and the isotopic composition of oxygen (δ18Oatm) from air bubbles entrapped
in ice provide exceptional tools for synchronizing ice core records (Bender et al., 1994; Blunier et al., 1998; Capron et al., 2010; K ¨ohler, 2010). With a decadal resolution in
15
some ice records, methane shows variations strongly linked to rapid climatic fluctu-ations such as the centennial-to-millennial climate variability (Chappellaz et al., 1993; Mitchell et al., 2011). The same pattern of change is recorded by both CH4andδ18Oatm
in Greenland or Antarctic ice core records, even though theδ18Oatm shows lower
am-plitude variations because of the longer O2lifetime driven by precession variations as
20
well as millennial-scale climate events (Landais et al., 2010).
The gas stratigraphic links employed were derived primarily from literature following
established inter-core methane synchronizations, but also from the availableδ18Oatm
data. Additionally, the δ15N data are also used as markers of rapid warming in the
NGRIP ice core record in sections where methane constraints are not yet available
25
(Louler-CPD
8, 6011–6049, 2012The Antarctic ice core chronology AICC2012: 0–120 ka
D. Veres et al.
Title Page
Abstract Introduction
Conclusions References
Tables Figures
◭ ◮
◭ ◮
Back Close
Full Screen / Esc
Printer-friendly Version Interactive Discussion
Discussion
P
a
per
|
Dis
cussion
P
a
per
|
Discussion
P
a
per
|
Discussio
n
P
a
per
|
gue, 2007; Lemieux-Dudon et al., 2010), EDML (Loulergue, 2007; Loulergue et al., 2007; Schilt et al., 2010), TALDICE (Buiron et al., 2011; Sch ¨upbach et al., 2011; Par-renin et al., 2012b), or NGRIP (Greenland composite: Capron et al., 2010; EPICA Com-munity Members, 2006; Fl ¨uckiger et al., 2004; Huber et al., 2006; Schilt et al., 2010), respectively. NGRIP is another ice core record that has already been synchronized
5
in the gas phase to all other records analyzed here including Vostok (Landais et al., 2006), EDML (Capron et al., 2010; Lemieux-Dudon et al., 2010; Schilt et al., 2010), or more recently TALDICE (Buiron et al., 2011). Other available gas stratigraphic pairing includes only these between EDML and TALDICE with data derived from Sch ¨upbach et al. (2011) (details in SOM).
10
3.2.4 Absolute age markers
The imprint of the Laschamp geomagnetic excursion has been detected in the ice cores
based on the cosmogenic isotopes (10Be,14C) concentration trends in both Greenland
(Yiou et al., 1997) and Antarctic (Raisbeck et al., 2007) records. We use the latest age
constraints associated with this event, 40.65±0.95 ka (Singer et al., 2009) as
abso-15
lute tie-points for EDC and Vostok. Other absolute markers include a Holocene10Be
point for Vostok (Parrenin et al., 2001) and the Mount Moulton tephra layer (Narcisi et al., 2006; Dunbar et al., 2008) for EDC, the latter with an updated40Ar/39Ar age of
93.2±4.4 ka (see SOM). Absolute age markers have not yet been reported for EDML
and TALDICE records. For the NGRIP on the other hand we used a set of absolute
20
markers from the GICC05 depth-age relationship with artificially small uncertainties to force the model not to deviate from this chronology. Tie points spaced 60 yr apart were used, leading to 990 data points to which we associated uncertainties of maximum 50 yr rather than the reported GICC maximum counting errors. In return, the absolute gas age markers employed in LD2010 were not used for this work. For periods older
25
CPD
8, 6011–6049, 2012The Antarctic ice core chronology AICC2012: 0–120 ka
D. Veres et al.
Title Page
Abstract Introduction
Conclusions References
Tables Figures
◭ ◮
◭ ◮
Back Close
Full Screen / Esc
Printer-friendly Version Interactive Discussion
Discussion
P
a
per
|
Dis
cussion
P
a
per
|
Discussion
P
a
per
|
Discussio
n
P
a
per
|
3.2.5 Additional markers
The∆depth markers given for NGRIP are derived from a depth comparison between
δ18Oice and air δ15N over a succession of interstadials as detailed in the SOM. The
new orbital points are discussed in Bazin et al. (2012).
4 Results and discussion 5
4.1 The new AICC2012 gas and ice chronologies
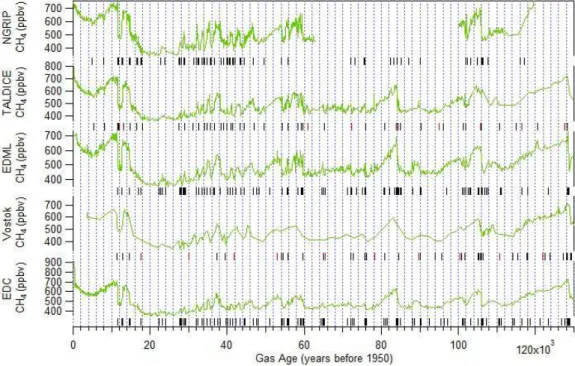
As expected from the chronological constraints provided by the numerous gas strati-graphic markers employed, the methane records for all five ice cores display very similar variations over the rapid millennial variability of the last glacial period and last deglaciation, respectively (Fig. 2). The uncertainties attached to the gas and ice
strati-10
graphic tie-points as well as uncertainties in the analyzed LIDIE may lead locally to
some minor offsets up to a few centuries between the five methane records. In
addi-tion, small differences between the records could also reflect a combination of (1) dif-ferent analytical resolution (e.g. the low resolution in the Vostok record) and precision, (2) the existence of the interhemispheric methane gradient because of stronger
proxi-15
mal methane sources from Northern Hemisphere landmasses (D ¨allenbach et al., 2000; Sch ¨upbach et al., 2011), and (3) different speeds for the lock-in process that could mod-ulate the trace gases’ peak attenuation observed in low accumulation sites (Spahni et al., 2003; K ¨ohler, 2010).
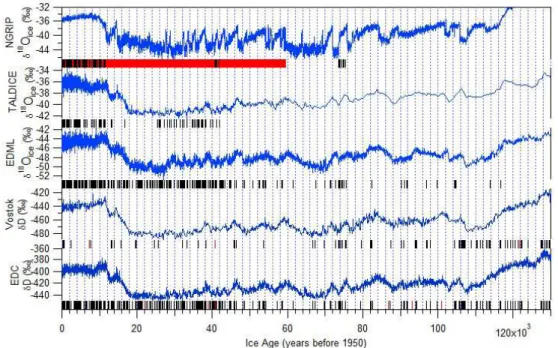
At first order, the water isotopic profiles show consistent similarity between all
Antarc-20
tic sites despite the fact that none of the ice stratigraphic tie-points are derived from wa-ter isotopic data. This confirms that the AIM succession observed individually on the
different Antarctic ice cores (EPICA Community Members, 2006; Jouzel et al., 2007;
Wolffet al., 2009; Buiron et al., 2012) is a persistent feature of the Antarctic climate of the last glacial period even if some differences are clearly visible on the shapes of the
CPD
8, 6011–6049, 2012The Antarctic ice core chronology AICC2012: 0–120 ka
D. Veres et al.
Title Page
Abstract Introduction
Conclusions References
Tables Figures
◭ ◮
◭ ◮
Back Close
Full Screen / Esc
Printer-friendly Version Interactive Discussion
Discussion
P
a
per
|
Dis
cussion
P
a
per
|
Discussion
P
a
per
|
Discussio
n
P
a
per
|
AIM for the different ice core records (Fig. 1). The EDML water isotope record hence
shows AIM characterized by broader peaks or even extended periods of high isotope values, whereas the EDC and TALDICE exhibit a more triangular shape over the same AIM events. The temperature maximum over each AIM is thus reached earlier at EDML compared to EDC or TALDICE (see Fig. 4), potentially reflecting that the EDML area
5
picks up a South Atlantic temperature signal that is opposite to the North Atlantic signal, and that according to the bipolar seesaw theory would be expected to increase more rapidly than Antarctic temperatures (Stocker and Johnsen, 2003). The water isotopic record is often of too coarse resolution in Vostok to clearly see the shape of the AIM.
Within the new coherent chronological scenario, we have chosen to discuss two
as-10
pects for the last glacial cycle: first, the dating of the last glacial inception in Greenland; second, the implication for the bipolar sequences of events and the seesaw picture over middle MIS 3.
4.2 Comparison with previous chronological constraints in the 70–120 ka BP period as derived from EDC3 and GICC05modelext
15
By construction, the AICC2012 chronology closely follows the GICC05 timescale over
the last 60 ka with a maximum difference of 5 yr locally. This is due to the high
num-ber of absolute ice markers with artificially small uncertainties included for this period derived from the GICC05 chronology (Fig. 1). For older periods such as MIS 5, a com-promise had to be found between data constraints and initial input from glaciological
20
modelling (SOM). Because the initial background scenario for the thinning function for Vostok, EDML, and TALDICE records was associated with quite a large variance over
MIS 5, the AICC2012 is mainly constrained by a few orbital markers such asδ18Oatm
and air content with large uncertainties of 6000 yr and respectively 4000 yr, and the
background age model for EDC (Parrenin et al., 2007) and NGRIP (Wolffet al., 2010)
25
ice cores (see also Bazin et al., 2012).
CPD
8, 6011–6049, 2012The Antarctic ice core chronology AICC2012: 0–120 ka
D. Veres et al.
Title Page
Abstract Introduction
Conclusions References
Tables Figures
◭ ◮
◭ ◮
Back Close
Full Screen / Esc
Printer-friendly Version Interactive Discussion
Discussion
P
a
per
|
Dis
cussion
P
a
per
|
Discussion
P
a
per
|
Discussio
n
P
a
per
|
GICC05modelext and EDC3-based timescales, respectively, as discussed in Capron et al. (2010). In that study, the EDC3-based chronology was applied to the NGRIP record
by using gas stratigraphic links (CH4 and δ
18
Oatm) between the EDML and NGRIP
ice core records, the EDML record being drawn on the EDML-1 timescale (Ruth et al., 2007) initially tuned to the EDC3 chronology (Parrenin et al., 2007) through many
5
volcanic tie-points.
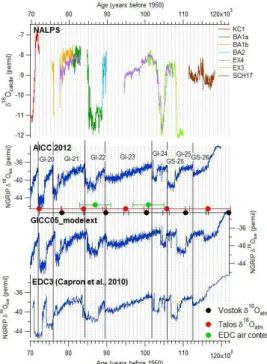
Significant differences of several millennia are observed in the timing of the NGRIP
glacial inception record between the AICC2012, the GICC05modelext, and the EDC3 chronologies, respectively (Fig. 3). The timing of the onsets of GI-25, GI-23, and GI-22, respectively are comparable between the EDC3-based and AICC2012 timescales, but
10
younger than the onset of the same interstadial according to the GICC05modelext. In our view, this difference is likely due to the high uncertainty on the NGRIP thinning
func-tion in sectors near the bedrock (NGRIP members, 2004; Wolffet al., 2010), but also
because it is mainly the EDC background scenario and the few orbital points (Fig. 3) that are driving the AICC2012 chronology over the interval 85–120 ka BP. The
con-15
strain linked to the orbital points is especially important around 100 ka BP, which makes the timing of GI-24 in AICC2012 younger than both GICC05modelext and EDC3 (by
∼2500 and∼1000 yr respectively). For period 60–85 ka BP, the AICC2012 chronology
provides a compromise between EDC3 and GICC05modelext with for example the on-sets of GI-21 and GI-20 being dated in AICC2012 at intermediate ages between these
20
of corresponding events on the EDC3 and GICC05modelext timescales.
The duration of events has been strongly modified for the NGRIP δ18Oice record
between the EDC3-based and the AICC2012 chronology. Especially the duration of
the δ18Oice decrease from the climatic optimum of MIS 5.5 and GS-26 is similarly
shorter on the GICC05modelext and AICC2012 time scales compared to the
EDC3-25
CPD
8, 6011–6049, 2012The Antarctic ice core chronology AICC2012: 0–120 ka
D. Veres et al.
Title Page
Abstract Introduction
Conclusions References
Tables Figures
◭ ◮
◭ ◮
Back Close
Full Screen / Esc
Printer-friendly Version Interactive Discussion
Discussion
P
a
per
|
Dis
cussion
P
a
per
|
Discussion
P
a
per
|
Discussio
n
P
a
per
|
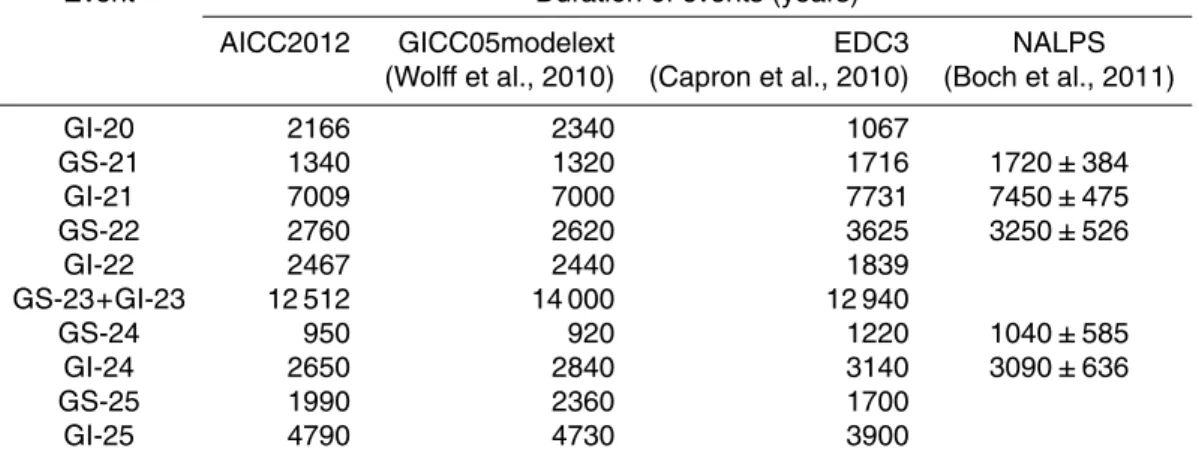
Table 1 shows a comparison on the duration of selected Greenlandic climate events
as constrained by AICC2012, the GICC05modelext (Wolffet al., 2010), and the
EDC3-based NGRIP timescale of Capron et al. (2010). As mentioned above, the event du-rations calculated from AICC2012 are in better agreement with GICC05modelext than with the EDC3-based timescale (Table 1). This is expected from the fact that both
5
GICC05modelext and AICC2012 chronologies use glaciological information, ie., the
glaciological kink model for GICC05modelext (Wolffet al., 2010), and a combination of
this same NGRIP kink model with the EDC glaciological model of Parrenin et al. (2007)
for the AICC2012 chronology. Still, some differences remain between the AICC2012
and the GICC05modelext chronologies (Fig. 3), as is for example the case for the
du-10
ration of events GI-20, GS-22, GI-24, or GS-25, respectively (Table 1).
4.3 Comparison with NALPS in the 70–120 ka BP period
U/Th absolutely dated speleothem isotopic data provide valuable contributions for bet-ter constraining the uncertainties associated with ice core dating and assessing leads and lags in the regional response to past climate change (Drysdale et al., 2007; Wang
15
et al., 2008; Fleitmann et al., 2009). Although detailed comparison between AICC2012 and other independent and absolutely dated archives will be attempted in the near fu-ture, we briefly compare the AICC2012 chronological constraints over the last glacial inception with the recently published NALPS record (Boch et al., 2011).
The NALPS composite speleothem record extends between 120 and 60 ka BP and
20
provides a precisely dated cave paleoclimate time series from the northern Alpine re-gion. The observed calciteδ18O variations were interpreted to reflect the North Atlantic type climate variability (Boch et al., 2011). There is good agreement for the timing
of DO events 19 to 25 between NALPS and GICC05modelext, but differences such
as younger ages for speleothem stadial and interstadial transitions over the period
25
between ca. 106 and 60 ka have also been reported. However, as NALPS is
CPD
8, 6011–6049, 2012The Antarctic ice core chronology AICC2012: 0–120 ka
D. Veres et al.
Title Page
Abstract Introduction
Conclusions References
Tables Figures
◭ ◮
◭ ◮
Back Close
Full Screen / Esc
Printer-friendly Version Interactive Discussion
Discussion
P
a
per
|
Dis
cussion
P
a
per
|
Discussion
P
a
per
|
Discussio
n
P
a
per
|
during stadials, the record is highly discontinuous, and not all DO event boundaries could securely be identified.
The timing of events over the period 70–85 ka is well constrained between AICC2012 and NALPS, particularly for the onsets of GI-19 and GI-20 (Fig. 3). The onset of GI-21 is however around 500 yr younger in AICC2012, and the discrepancy already reported
5
between NALPS and GICC05modelext over the length of GS-22 is also visible in AICC2012. It is likely the cause of this discrepancy resides in the NALPS record, or arises from different expressions of climate variability in the different records.
A significant offset is however observed over the early part of the Last Glacial
pe-riod between NALPS and AICC2012, the speleothem derived event boundaries being
10
older by∼2000 yr on average compared to AICC2012 over the sequence of DO events
23–25. Over the same interval there is however better agreement between NALPS
and GICC05modelext (Fig. 3). Nonetheless, differences exist in the timing and shape
of events over DO events 24–25 between NALPS and other well-dated speleothem records such as Corchia, south of the Alps (Drysdale et al., 2007), Sofular, near the
15
Black Sea (Badertscher et al., 2011), or the Sanbao record from China (Wang et al., 2008). A rigorous chronological analysis of various speleothem records is underway (D. Fleitmann, personal communication, 2012). It is expected that it will provide strong constraints for further comparison of such records with the ice core chronological data, including AICC2012. As for the length of events, the error bars associated with the
20
NALPS record make it compatible, at least for some events, with any of the ice core chronologies discussed in Fig. 3.
4.4 Middle MIS 3 – comparison with the LD2010 chronology
One of the strengths of the Datice tool is that it allows for a close assessment of the
sequence of events between the different ice cores analyzed. This is particularly
rel-25
CPD
8, 6011–6049, 2012The Antarctic ice core chronology AICC2012: 0–120 ka
D. Veres et al.
Title Page
Abstract Introduction
Conclusions References
Tables Figures
◭ ◮
◭ ◮
Back Close
Full Screen / Esc
Printer-friendly Version Interactive Discussion
Discussion
P
a
per
|
Dis
cussion
P
a
per
|
Discussion
P
a
per
|
Discussio
n
P
a
per
|
has immediate implications for the timing of the interhemispheric coupling over the last glacial period with respect to the seesaw mechanism (Stocker and Johnsen, 2003; EPICA Community Members, 2006; Barker et al., 2011; Buiron et al., 2012).
A central period for investigating the classical bipolar expression of the millennial variability over the last glacial period is MIS 3 (Blunier and Brook, 2001; EPICA
Com-5
munity Members, 2006; Jouzel et al., 2007; Wolff et al., 2010). With the AICC2012
chronology, the classical pattern where the peaks of AIM correspond with the GI on-sets is indeed confirmed (Fig. 4), as already reported in the previous Datice-derived LD2010 chronology (Lemieux-Dudon et al., 2010).
Nevertheless, slight differences were expected between the two chronological
frame-10
works given the improved constraints applied here compared to LD2010. For exam-ple, for AIM5, 6, 7 and 12 respectively, the AICC2012 age estimates for the Antarctic
records are younger by∼500 yr compared to the LD2010 chronology (Fig. 4). However,
the slight differences in the AIM timing between the two Datice-derived chronologies
do not impact significantly on the understanding of the sequence of events over the
15
last glacial period between Antarctica and Greenland and hence on the seesaw mech-anism. As an example at the onset of the large GI-12, there is a very good synchrony
between the abrupt increase ofδ18Oice at NGRIP and the δ18Oice maximum at EDC
on the AICC2012 chronology. Using the LD2010 chronology, the isotopic maximum
at EDC is lagging the abrupt increase ofδ18O
ice at NGRIP by some 500 yr. Similarly,
20
EDML displays generally youngerδ18Oice maximum over AIM by several centuries in
AICC2012 than in LD2010. Despite these small differences, the sequence of events
remains in agreement with the seesaw classical pattern (Stocker and Johnsen, 2003; Svensson et al., 2012) within the limitations given by dating as well as the short-term variability of the water isotopic signal and related uncertainties derived from the
tem-25
poral and analytical constraints employed (see SOM).
CPD
8, 6011–6049, 2012The Antarctic ice core chronology AICC2012: 0–120 ka
D. Veres et al.
Title Page
Abstract Introduction
Conclusions References
Tables Figures
◭ ◮
◭ ◮
Back Close
Full Screen / Esc
Printer-friendly Version Interactive Discussion
Discussion
P
a
per
|
Dis
cussion
P
a
per
|
Discussion
P
a
per
|
Discussio
n
P
a
per
|
the AICC2012 are due to higher density of ice and gas stratigraphic points employed
in the latter, as well as differences between the background LIDIE scenarios (SOM).
Altogether, this approach had important implications for improving the accuracy of the new time scale. For example, the LD2010 LIDIE background scenarios were all based on firn densification models. On the contrary, for AICC2012 the background LIDIE for
5
EDML, EDC, and Vostok ice core records were deduced from theδ15N of N2in air
en-trapped in the ice (see Parrenin et al., 2012b; Capron et al., 2012). With this approach, LIDIE are systematically smaller in AICC2012 than in LD2010 (Fig. 5). The main
impli-cation is that a smaller LIDIE induces a smaller age difference,∆age, between age of
the ice and age of the gas at the same depth. It thus decreases the age of ice when
10
using gas stratigraphic links as CH4abruptly increases at each GS/GI transition.
5 Conclusions and outlook
Significant progress has been made recently in synchronizing the long ice core records, and this is an important benchmark in advancing paleoenvironmental research and more carefully assessing both temporal and spatial leads and lags between regions.
15
Here we provided new chronological outputs from a multi-core inverse modelling ap-proach applied to the more recent 120 ka of four Antarctic ice core records, and the NGRIP record, in the frame of the AICC2012 chronology. The development of the new chronology to depict the millennial scale variability of the last glacial period has strongly benefited from the addition of numerous ice and gas stratigraphic tie-points as well as
20
a revised expression for the background scenario of LIDIE.
The new AICC2012 chronology provides improved temporal constraints in order to asses the timing of past climate events, and we have shown two such examples in selected time intervals over the last 120 ka BP. First, the dating of the last glacial incep-tion shares many features with the EDC3 chronology developed for the EDC record, but
25
CPD
8, 6011–6049, 2012The Antarctic ice core chronology AICC2012: 0–120 ka
D. Veres et al.
Title Page
Abstract Introduction
Conclusions References
Tables Figures
◭ ◮
◭ ◮
Back Close
Full Screen / Esc
Printer-friendly Version Interactive Discussion
Discussion
P
a
per
|
Dis
cussion
P
a
per
|
Discussion
P
a
per
|
Discussio
n
P
a
per
|
Second, we have shown that the bipolar sequence of events over the succession of GI/GS is slightly modified in AICC2012 compared to the previous LD2010 chronol-ogy, with the Antarctic records in general being about 500 yr younger according to the AICC2012.
Several other well-resolved Antarctic ice core records are available for the last
cli-5
matic cycle and even beyond, with a wealth of dating information including layer count-ing (Mitchell et al., 2012; Vinther et al., 2012) or orbital markers (Kawamura et al., 2007). Moreover, radiometric age data from well-resolved speleothem profiles could provide absolute chronostratigraphic tie-points that can refine the ice core chronolo-gies providing that the response to climate forcing is proven coeval between regions. It
10
is therefore expected that the future contribution of both other ice cores and other type of chronological constraints to the Datice effort will lead to further refinements in the ice core chronologies beyond the AICC2012 chronology.
Supplementary material related to this article is available online at:
http://www.clim-past-discuss.net/8/6011/2012/cpd-8-6011-2012-supplement. 15
pdf.
Acknowledgements. The authors thank the EDC4 discussion team for stimulating the discus-sion around the building of AICC2012 and helping to decide on the best parameters to feed the DATICE tool. We are particularly indebted to V. Masson-Delmotte, C. Ritz, H. Fisher, and D. Fleitmann for their constructive suggestions. This work was financially endorsed by LGGE
20
the CNRS/INSU LEFE program and “Fondation Ars Cuttoli”. It was also supported by the Past4Future project of the European Commission’s 7th Framework Programme under Grant agreement no. 243908 and is Past4Future contribution number XX. This work is also a contri-bution to the European Project for Ice Coring in Antarctica (EPICA), a joint European Science Foundation/European Commission scientific program, funded by the EU and by national
con-25
CPD
8, 6011–6049, 2012The Antarctic ice core chronology AICC2012: 0–120 ka
D. Veres et al.
Title Page
Abstract Introduction
Conclusions References
Tables Figures
◭ ◮
◭ ◮
Back Close
Full Screen / Esc
Printer-friendly Version Interactive Discussion
Discussion
P
a
per
|
Dis
cussion
P
a
per
|
Discussion
P
a
per
|
Discussio
n
P
a
per
|
The publication of this article is financed by CNRS-INSU.
References
Arnaud, L., Barnola, J.-M., and Duval, P.: Physical modeling of the densification of snow/firn and ice in the upper part of polar ice sheets, in: Physics of Ice Core Records, edited by:
5
Hondoh, T., Hokkaido University Press, Sapporo, Japan, 285–305, 2000.
Badertscher, S., Fleitmann, D., Cheng, H., Edwards, R. L., G ¨okt ¨urk, O. M., Zumb ¨uhl, A., Leuenberger, M., and T ¨uys ¨uz, O.: Pleistocene water intrusions from the Mediterranean and Caspian seas into the Black Sea, Nat. Geosci., 4, 4–11, 2012.
Barker, S., Knorr, G., Edwards, R. L., Parrenin, F., Putnam, A. E., Skinner, L. C., Wolff, E., and
10
Ziegler, M.: 800 000 years of abrupt climate variability, Science, 334, 347–351, 2011. Bazin, L., Landais, A., Lemieux-Dudon, B., Toy ´e Mahamadou Kele, H., Veres, D., Parrenin,
F., Martinerie, P., Ritz, C., Capron, E., Lipenkov, V., Loutre, M.-F., Raynaud, D., Vinther, B., Svensson, A., Rasmussen, S., Severi, M., Blunier, T., Leuenberger, M., Fischer, H., Masson-Delmotte, V., Chappellaz, J., and Wolff, E.: An optimized multi-proxy, multi-site Antarctic ice
15
and gas orbital chronology (AICC2012): 120–800 ka, Clim. Past Discuss., in press, 2012. Bender, M., Sowers, T., and Labeyrie, L. D., The Dole effect and its variation during the last
130 000 years as measured in the Vostok core, Global Biogeochem. Cy., 8, 363–376, 1994. Blaauw, M., Wohlfarth, B., Christen, J. A., Ampel, L., Veres, D., Hughen, K. A., Preusser, F.,
and Svensson, A.: Were last glacial climate events simultaneous between Greenland and
20
France? A quantitative comparison using non-tuned chronologies, J. Quaternary Sci., 25, 387–394, 2010.
CPD
8, 6011–6049, 2012The Antarctic ice core chronology AICC2012: 0–120 ka
D. Veres et al.
Title Page
Abstract Introduction
Conclusions References
Tables Figures
◭ ◮
◭ ◮
Back Close
Full Screen / Esc
Printer-friendly Version Interactive Discussion
Discussion
P
a
per
|
Dis
cussion
P
a
per
|
Discussion
P
a
per
|
Discussio
n
P
a
per
|
Synchronisation of palaeoenvironmental records over the last 60 000 years, and an extended INTIMATE event stratigraphy to 48 000 b2k, Quat. Sci. Rev., 36, 2–10, 2012.
Blunier, T. and Brook, E. J.: Timing of millennial-scale climate change in Antarctica and Green-land during the last glacial period, Science, 291, 109–112, 2001.
Blunier, T., Chappellaz, J., Schwander, J., D ¨allenbach, A., Stauffer, B., Stocker, T., Raynaud, D.,
5
Jouzel, J., Clausen, H., Hammer, C., and Johnsen, S.: Asynchrony of Antarctic and Green-land climate change during the last glacial period, Nature, 394, 739–743, 1998.
Blunier, T., Spahni, R., Barnola, J.-M., Chappellaz, J., Loulergue, L., and Schwander, J.: Synchronization of ice core records via atmospheric gases, Clim. Past, 3, 325–330, doi:10.5194/cp-3-325-2007, 2007.
10
Boch, R., Cheng, H., Sp ¨otl, C., Edwards, R. L., Wang, X., and H ¨auselmann, P.: NALPS: a pre-cisely dated European climate record 120–60 ka, Clim. Past, 7, 1247–1259, doi:10.5194/cp-7-1247-2011, 2011.
Braun, H., Ditlevsen, P., Kurths, J., and Mudelsee, M.: A two-parameter stochastic process for Dansgaard-Oeschger events, Paleoceanography, 26, PA3214, doi:10.1029/2011pa002140,
15
2011.
Brook, E. J., Sowers, T., and Orchardo, J.: Rapid variations in atmospheric methane concen-tration during the past 110 000 years, Science, 273, 1087–1091, 1996.
Buiron, D., Chappellaz, J., Stenni, B., Frezzotti, M., Baumgartner, M., Capron, E., Landais, A., Lemieux-Dudon, B., Masson-Delmotte, V., Montagnat, M., Parrenin, F., and Schilt, A.:
20
TALDICE-1 age scale of the Talos Dome deep ice core, East Antarctica, Clim. Past, 7, 1–16, doi:10.5194/cp-7-1-2011, 2011.
Buiron, D., Stenni, B., Chappellaz, J., Landais, A., Baumgartner, M., Bonazza, M., Capron, E., Frezzotti, M. Kageyama, M., Lemieux-Dudon, B., Masson-Delmotte, V., Parrenin, F., Schilt, A., Selmo, E., Severi, M., Swingedouw, D., and Udisti, R.: Regional imprints of millennial
25
variability during the MIS 3 period around Antarctica, Quaternary Sci. Rev., 48, 99–112, 2012.
Caillon, N., Severinghaus, J. P., Jouzel, J., Barnola, J.-M., Kang, J., and Lipenkov, V. Y.: Timing of atmospheric CO2and Antarctic temperature changes across Termination III, Science, 299, 1728–1731, 2003.
30
CPD
8, 6011–6049, 2012The Antarctic ice core chronology AICC2012: 0–120 ka
D. Veres et al.
Title Page
Abstract Introduction
Conclusions References
Tables Figures
◭ ◮
◭ ◮
Back Close
Full Screen / Esc
Printer-friendly Version Interactive Discussion
Discussion
P
a
per
|
Dis
cussion
P
a
per
|
Discussion
P
a
per
|
Discussio
n
P
a
per
|
NorthGRIP ice cores usingδ18O of atmospheric oxygen (δ18O
atm) and CH4measurements
over MIS5 (80–123 kyr), Quaternary Sci. Rev., 29, 222–234, 2010.
Capron, E., Landais, A., Buiron, D., Cauquoin, A., Chappellaz, J., Debret, M., Jouzel, J., Leuen-berger, M., Martinerie, P., Masson-Delmotte, V., Mulvaney, R., Parrenin, F., and Pri ´e, F.: Glacial-interglacial dynamics of Antarctic firns: comparison between simulations and ice core
5
air-δ15N measurements, Clim. Past Discuss., accepted, 2012.
Chappellaz, J., Blunier, T., Raynaud, D., Barnola, J.-M., Schwander, J., and Stauffer, B.: Syn-chronous changes in atmospheric CH4 and Greenland climate between 40 and 8 kyr BP, Nature, 366, 443–445, 1993.
Dahl-Jensen, D., Mosegaard, K., Gundestrup, N., Clow, G. D., Johnsen, S. J., Hansen, A. W.,
10
and Balling, N.: Past temperatures directly from the Greenland ice sheet, Science, 282, 268– 271, 1998.
Dansgaard, W., Clausen, H. B., Gundestrup, N., He, C. U., Johnsen, S. F., Kristinsdottir, P. M., and Reeh, N.: A new Greenland deep ice core, Science, 218, 1273–1277, 1982.
Dansgaard, W., Johnsen, S., Clausen, H. B., Dahl-Jensen, D., Gundestrup, N., Hammer, C. U.,
15
and Oeschger, H.: North Atlantic climatic oscillations revealed by deep Greenland ice cores, in: Climate processes and climate sensitivity, edited by: Am. Geophys. Union, Washington, edited by: Hansen, J. E., Takahashi T., 288–298, 1984.
D ¨allenbach, A., Blunier, T., Fl ¨uckiger, J., Stauffer, B., Chappellaz, J., and Raynaud, D.: Changes in the atmospheric CH4 gradient between Greenland and Antarctica during the
20
Last Glacial and the transition to the Holocene, Geophys. Res. Lett., 27, 1005–1008, doi:200010.1029/1999GL010873, 2000.
Dreyfus, G. B., Parrenin, F., Lemieux-Dudon, B., Durand, G., Masson-Delmotte, V., Jouzel, J., Barnola, J.-M., Panno, L., Spahni, R., Tisserand, A., Siegenthaler, U., and Leuenberger, M.: Anomalous flow below 2700 m in the EPICA Dome C ice core detected using ∆18O
25
of atmospheric oxygen measurements, Clim. Past, 3, 341–353, doi:10.5194/cp-3-341-2007, 2007.
Drysdale, R. N., Zanchetta, G., Hellstrom, J. C., Fallick, A. E., McDonald, J., and Cartwright, I.: Stalagmite evidence for the precise timing of North Atlantic cold events during the early last glacial, Geology, 35, 77–80, 2007.
30
CPD
8, 6011–6049, 2012The Antarctic ice core chronology AICC2012: 0–120 ka
D. Veres et al.
Title Page
Abstract Introduction
Conclusions References
Tables Figures
◭ ◮
◭ ◮
Back Close
Full Screen / Esc
Printer-friendly Version Interactive Discussion
Discussion
P
a
per
|
Dis
cussion
P
a
per
|
Discussion
P
a
per
|
Discussio
n
P
a
per
|
EPICA Community Members: Eight glacial cycles from an Antarctic ice core, Nature, 429, 623– 628, 2004.
EPICA Community Members: One-to-one coupling of glacial climate variability in Greenland and Antarctica, Nature, 444, 195–198, 2006.
Fleitmann, D., Cheng, H., Badertscher, S., Edwards, R. L., Mudelsee, M., G ¨okt ¨urk, O. M.,
5
Fankhauser, A., Pickering, R., Raible, C. C., Matter, A., Kramers, J., and T ¨uys ¨uz, O.: Timing and climatic impact of Greenland interstadials recorded in stalagmites from northern Turkey, Geophys. Res. Lett., 36, L19707, doi:10.1029/2009GL040050, 2009.
Fl ¨uckiger, J., Blunier, T., Stauffer, B., Chappellaz, J., Spahni, R., Kawamura, K., Schwan-der, J., Stocker, T. F., and Dahl-Jensen, D.: N2O and CH4 variations during the last
10
glacial epoch: Insight into global processes, Global Biogeochem. Cy., 18, GB1020, doi:10.1029/2003GB002122, 2004.
Goujon, C., Barnola, J. M., and Ritz, C.: Modeling the densification of polar firn including heat diffusion: Application to close-offcharacteristics and gas isotopic fractionation for Antarctica and Greenland sites, J. Geophys. Res., 108, 101–1018, 2003.
15
Grootes, P. M., Stuiver, M., White, J. W. C., Johnsen, S. J., and Jouzel, J.: Comparison of the oxygen isotope records from the GISP2 and GRIP Greenland ice cores, Nature, 366, 552–554, 1993.
Huber, C., Leuenberger, M., Spahni, R., Fl ¨uckiger, J., Schwander, J., Stocker, T., Johnsen, S., Landais, A., and Jouzel, J.: Isotope calibrated Greenland temperature record over Marine
20
Isotope Stage 3 and its relation to CH4, Earth Planet. Sc. Lett., 243, 504–519, 2006. Huybrechts, P., Rybak, O., Pattyn, F., Ruth, U., and Steinhage, D.: Ice thinning, upstream
ad-vection, and non-climatic biases for the upper 89 of the EDML ice core from a nested model of the Antarctic ice sheet, Clim. Past, 3, 577–589, doi:10.5194/cp-3-577-2007, 2007. Jouzel, J., Masson-Delmotte, V., Cattani, O., Dreyfus, G., Falourd, S., Hoffmann, G., Minster, B.,
25
Nouet, J., Barnola, J. M., Chappellaz, J., Fischer, H., Gallet, J. C., Johnsen, S., Leuenberger, M., Loulergue, L., Luethi, D., Oerter, H., Parrenin, F., Raisbeck, G., Raynaud, D., Schilt, A., Schwander, J., Selmo, E., Souchez, R., Spahni, R., Stauffer, B., Steffensen, J. P., Stenni, B., Stocker, T. F., Tison, J. L., Werner, M., and Wolff, E. W.: Orbital and Millennial Antarctic climate variability over the past 800 000 years, Science, 317, 793–796, 2007.
30