www.hydrol-earth-syst-sci.net/16/1805/2012/ doi:10.5194/hess-16-1805-2012
© Author(s) 2012. CC Attribution 3.0 License.
Earth System
Sciences
Flood occurrence mapping of the middle Mahakam lowland area
using satellite radar
H. Hidayat1,2, D. H. Hoekman3, M. A. M. Vissers4, and A. J. F. Hoitink1,5
1Hydrology and Quantitative Water Management Group, Wageningen University, Wageningen, The Netherlands 2Research Centre for Limnology, Indonesian Institute of Sciences, Cibinong, Indonesia
3Earth System Science and Climate Change Group, Wageningen University, The Netherlands 4SarVision BV, Wageningen, The Netherlands
5Institute for Marine and Atmospheric Research Utrecht, Department of Physical Geography, Utrecht University,
Utrecht, The Netherlands
Correspondence to:H. Hidayat (hidayat.hidayat@wur.nl)
Received: 2 December 2011 – Published in Hydrol. Earth Syst. Sci. Discuss.: 22 December 2011 Revised: 16 May 2012 – Accepted: 6 June 2012 – Published: 3 July 2012
Abstract.Floodplain lakes and peatlands in the middle Ma-hakam lowland area are considered as ecologically important wetland in East Kalimantan, Indonesia. However, due to a lack of data, the hydrological functioning of the region is still poorly understood. Among remote sensing techniques that can increase data availability, radar is well-suitable for the identification, mapping, and measurement of tropical wet-lands, for its cloud unimpeded sensing and night and day op-eration. Here we aim to extract flood extent and flood occur-rence information from a series of radar images of the mid-dle Mahakam lowland area. We explore the use of Phased Array L-band Synthetic Aperture Radar (PALSAR) imagery for observing flood inundation dynamics by incorporating field water level measurements. Water level measurements were carried out along the river, in lakes and in peatlands, using pressure transducers. For validation of the open wa-ter flood occurrence map, bathymetry measurements were carried out in the main lakes. A series of PALSAR images covering the middle and lower Mahakam area in the years 2007 through 2010 were collected. A fully inundated region can be easily recognized on radar images from a dark sig-nature. Open water flood occurrence was mapped using a threshold value taken from radar backscatter of the perma-nently inundated river and lakes areas. Radar backscatter in-tensity analysis of the vegetated floodplain area revealed con-sistently high backscatter values, indicating flood inundation under forest canopy. We used those values as the threshold for flood occurrence mapping in the vegetated area.
1 Introduction
Flood maps that include the occurrence of flooding are an important source of input for integrated assessment of flood dynamics, ecological processes, and vulnerability required in planning, designing, and operating flood works, nature re-serves, and land management policies (Qi et al., 2009). Reg-ular acquisition of remotely sensed inundation extents allows for mapping flood occurrences over a large area. In areas with less cloud cover, data from optical sensors such as Landsat imagery can be used for this purpose (e.g. Qi et al., 2009; Ran and Lu, 2012). Ran and Lu (2012) noted that images with cloud cover of less than 5 % are preferred. However, for the humid tropics area, the preferred limit of cloud cover is hard or even impossible to be satisfied.
of the inundated forest on radar images as a result of double bounce reflections between water surfaces and tree trunks or branches (Hess et al., 1990).
The Phased Array L-band Synthetic Aperture Radar (PAL-SAR) is one of the remote sensing instruments onboard of the Advanced Land Observing Satellite (ALOS). PALSAR is a polarimetric instrument operating at a wavelength of 23.6 cm with a 46-day satellite cycle period for global envi-ronmental monitoring (Rosenqvist et al., 2007). The modes of observation include Fine Beam Single Polarization (FBS), Fine Beam Dual Polarization (FBD), Polarimetric (POL), and ScanSAR. FBS and FBD are designed for land cover changes and forest monitoring. POL is dedicated to re-search related to polarimetry and polarimetric interferometry. ScanSAR is intended for seasonal phenomena studies, such as inundation extent monitoring and rice-field mapping. All land areas on the globe are covered at least once every year by the FBS, FBD, and ScanSAR modes. The typical repeti-tion frequency for most areas is three to five times per year (Rosenqvist et al., 2007).
The application of remote sensing and GIS plays an im-portant role in filling the gaps in wetland inventory and could reduce uncertainties due to data availability constraints (Re-belo et al., 2009). Radar data sets are gradually obtaining a more prominent role in wetland mapping, not only in sci-entific projects but also in operational practices that require information on wetlands’ presence, extent, and conditions (Henderson and Lewis, 2008). SAR technology has been used for remote monitoring of inundation patterns, dura-tion of hydroperiods and computadura-tion of surface water level changes in the Everglades wetlands in Florida (Bourgeau-Chavez et al., 2005; Wdowinski et al., 2008). Rosenqvist and Birkett (2002) investigate the use of JERS-1 SAR mosaics in the Congo river basin for hydrological application. They pro-posed that SAR mapping missions need at least three repet-itive observations within one year to describe the hydrology in such a complex region. Recently, Salvia et al. (2011) used Envisat ASAR and AMSR-E data to estimate flooded area extent and mean water level in the wetlands of the Parana River Delta floodplain. They found that both active and pas-sive microwaves data can be used to estimate water level in flooded vegetation. The specular reflection of microwaves from open smooth water bodies resulting in dark tones on the SAR image can be used to evaluate 1-D or 2-D flood in-undation models (Schumann et al., 2008).
The suitability of radar techniques for spatial characteriza-tion of floods (e.g. Hess et al., 1990; Oberstadler et al., 1997) draws researchers’ interest to explore and apply methods for extracting flood information from satellite radar images. Based on backscattering coefficients of the L-band JERS-1 SAR images, Hess et al. (2003) used a pixel-based classifier to map wetland vegetation and flooding state for the central Amazon basin. They delineated wetlands and classified the masked area into “cover states” that consisted of vegetation cover classes and inundation states for high- and low-water
conditions. They obtained a cover-state map for large regions with an accuracy of 78–91 % for open water, nonflooded for-est, and flooded forest cover-state classes. Lower accuracies were reported for aquatic macrophytes and for flooded wood-land. Hostache et al. (2009) proposed a SAR image analysis method for spatiotemporal characterization of flood events that includes extracting flood extent limit, estimating wa-ter level, and constraining wawa-ter level estimates using hy-draulic coherence concepts. The method was applied to an ENVISAT SAR image during the January 2003 flood of the Alzette river. They showed that SAR imagery offers the pos-sibilities to obtain distributed remote-sensing-derived water levels over a large area with sufficient accuracy for calibra-tion of a hydraulic model. Matgen et al. (2011) proposed a hybrid approach to automatically extract flood extent from SAR images by estimating the statistical distribution of open water backscatter values from SAR images of floods, radio-metric thresholding to extract the core of the water bodies, and region growing to extract all water bodies. They pro-posed a change detection procedure using pre- or post-flood SAR reference images to remove over-detection of inundated areas. The methods were evaluated through the 2007 flood of the Severn river (using ENVISAT SAR images) and the 1997 flood of the Red river (using RADARSAT-1 images). Their study showed that the automated method that includes a change detection procedure yields the same performance as optimized manual approaches.
This study explores the use of PALSAR imagery for floodplain dynamics mapping of the Mahakam River Basin (MRB). The MRB is located in Kalimantan, the Indonesian part of Borneo, between 2◦N to 1◦S and 113◦E to 118◦E. It represents a poorly gauged meso-scale river basin with a complex land cover mosaic. Part of the runoff that feeds the Mahakam is derived from peat domes, which are difficult to monitor. In studies at the plot scale, piezometers are com-monly used to analyze water levels in peat, which are labour intensive to maintain (Devito et al., 1996; Baird et al., 2004; Fraser et al., 2001). SRTM data, time series of radar images and field measurement can be combined to study the tempo-ral dynamics of lake water mixtures, and fluxes between the river and the floodplain adjacent to the river (Bonnet et al., 2008). Using the difference in mean brightness levels from SIR-B L-band radar images of coastal lowlands in East Kali-mantan, Ford and Casey (1988) characterized three classes of forest canopy (swamp, coastal lowland forest and tidal forest) and two classes of open land cover (wetland and clear cuts). Ford and Casey (1988) also noted the enhanced backscat-ter returns from the inundated area covered by mangrove and nipah swamps. Time series of L-band radar data such as the JERS-1 SAR, the predecessor of PALSAR, have been applied to acquire information on the hydrology in Central Kalimantan peat swamps (Hoekman, 2007).
Fig. 1.Land use/land cover map of the Mahakam river basin based on PALSAR images of 2007 (Hoekman et al., 2010). The black line indicates the catchment boundary.
classification of FBS and FBD polarization (path) image pairs. The classification was performed with 18 land cover classes including seven forest types, two woodland types, two shrubland types, two grassland types and three anthro-pogenic vegetation types. They obtained good results for a sub-continental high resolution map, except for grassland, cropland and shrubland. Based on the confusion matrix anal-ysis, the obtained land use/land cover (LULC) map was for 85.5 % fully in agreement with the independent reference dataset, for 7.8 % in partial agreement, while 6.7 % was in disagreement. Herein, partial agreement is defined as confu-sion with an adjacent class along a continuum with a fairly similar biophysical characterization, which may be related to the dynamic behaviour of low biomass areas (Hoekman et al., 2010). For a wide coverage area of about 750 000 km2 and a relatively detailed classification, the overall result is promising. Application of longer or denser time series were expected to improve results significantly. Figure 1 shows the LULC map of Borneo, zoomed in on the MRB area. The middle Mahakam region has a complex land cover mo-saic that mainly consists of degraded forest, riverine for-est, shrub, agriculture area, swamp and peat forfor-est, which is strongly related to the inundation pattern and anthropogenic disturbances.
In this study we aim to extract flood extent and flood oc-currence information from a series of radar images of the middle Mahakam lowland area, including both open water and areas under vegetation. We mapped the flood occurrence as counts of flood marks obtained from the evaluation of radar backscatter from PALSAR data series against flood-ing thresholds. The remainder of this paper is structured as follows. Section 2 describes the study area and a brief hydro-logical background of the middle Mahakam area. Descrip-tions of data collection and data processing are presented in
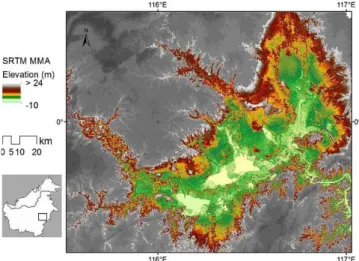
Fig. 2.Study area in East Kalimantan with a colour coded SRTM digital elevation model for the middle Mahakam lowland area.
Sect. 3. Section 4 presents the results discussion and finally Sect. 5 presents the conclusions.
2 Study area
The Middle Mahakam Area (MMA) is characterized by low relief (Fig. 2) with around 40 shallow lakes on both sides of the river. Lakes Semayang, Melintang, and Jempang are the three largest lakes in this region. Lakes in the MMA reg-ulate the discharge in the lower Mahakam area. They have a function as a buffer by storing water during the high flow conditions, and releasing it during low flows. Lake filling and emptying mechanisms play a role to shave water level peaks downstream of the Mahakam lakes area (Hidayat et al., 2011b). The MMA is also surrounded by peatland, as part of the Kutai lowland spreading over an area of 35 km NW– SE by 130 km SW–NE, with elevations of around sea level in the Mahakam River to ca. 24 m a.s.l. (Hope et al., 2005). The peat in Kalimantan is of the ombrogenous type (Jaenicke et al., 2010; Page et al., 2004). This type of land potentially stores more water than any other type of land because of the sponge nature of the pores.
in December and in May. The normal dry season lasts from June to September. However, it may begin as early as March and last until November, as was the case during the ENSO event in 1997.
The flooding regime in the MMA is generally charac-terised by long duration floods during the peak of the rainy season in December through January and in May, with sev-eral short duration high water events in between. Water lev-els at the upstream stations are fluctuating primarily in re-sponse to rainfall in the catchment, while more downstream they are also influenced by the tidal motion. Bank overtop-ping occurs during a flood situation in Penyinggahan (Fig. 3). During this period, the Penyinggahan floodplain is flooded and water flows through the floodplain to Lake Melintang, then to Lake Semayang, and finally meets the Mahakam again through a tie-channel. Downstream of the middle Ma-hakam area, water level fluctuation is relatively low. Beside the lakes, the vast area of the Kutai wetland is believed to also control the River Mahakam water level and discharges downstream. The information on flood duration and inunda-tion extent obtained in the context of the present study will be used in a future stage to model the hydrological functioning of the area, which has not been quantified to date.
3 Methodology
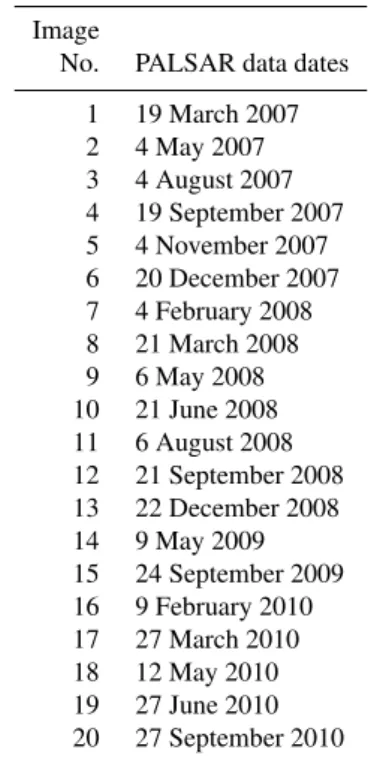
A series of PALSAR images with HH polarization and a pixel spacing of 75 m was provided by the Japan Aerospace Explo-ration Agency (JAXA), covering the middle and lower Ma-hakam areas for the years 2007 through 2010 (Table 1). The PALSAR images were radiometrically calibrated, orthorec-tified using 3′′SRTM data and corrected for slope illumina-tion effects. Next, these geocoded data were chronologically stacked into a layered multi-temporal radar image suitable for time-series analysis. Figure 4 shows the spatial and tem-poral dynamics of radar backscatter from PALSAR images of the study area during wet and dry seasons. These dynamics are related to flood conditions and soil moisture.
The flood occurrence was determined by evaluating pixels in the images used as input against the lower and the up-per threshold values. The pixel was flagged as flooded if its backscatter value falls within the range between the lower and upper thresholds. An image with pixel values of counts of the flooded flag was obtained, which was then colour mapped. As radar returns for flooding in open areas and for flooding under vegetation result in contrasting behavior (dark for the former and bright for the latter), the two types of flooding were mapped separately. The crucial part in the thresholding step is to determine the upper threshold value for open water and the lower threshold value for flooding under vegetation cover. From the input images we acquired radar backscatter statistics in regions covering the main river and lakes that are known to be permanently inundated, to determine threshold values for open water flood occurrence
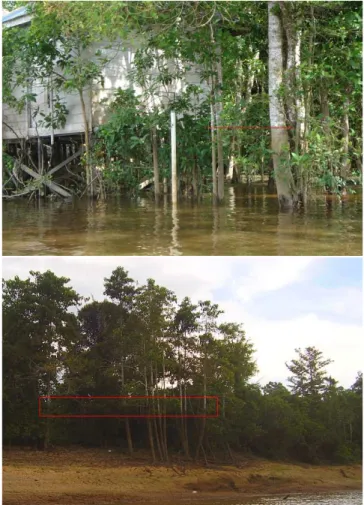
Fig. 3.(top) River bank overtopping in Penyinggahan during the high water event in March 2009. The red line indicates water level marks on trees, from a previous flood event. (bottom) A view to the floodplain upstream of the MMA during low water event in August 2009. Flood marks on trees (red rectangle) indicate the height of the previous inundation in the vegetated floodplain area.
117°E 117°E
116°E 116°E
0° 0°
±
0 1020 40 km 6 may 2008
117°E 117°E
116°E 116°E
0° 0°
±
0 1020 40 km 24 September 2009
Fig. 4.PALSAR images of the middle Mahakam area during a wet season (top) and a dry season (bottom). Dark areas indicate open water extent, bright areas indicate inundation under vegetation cover.
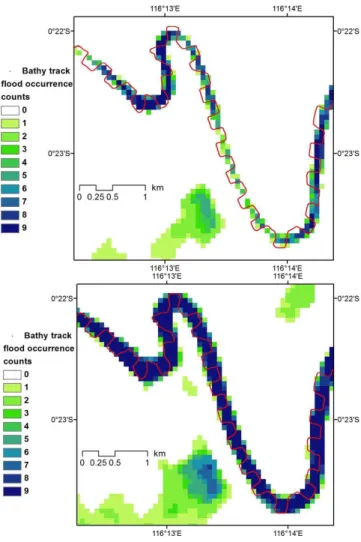
between the river banks lines from bathymetry mapping and those apparent in the flood occurrence map.
It is generally accepted in SAR literature that flooded veg-etation results in enhanced backscatter returns (e.g. Ford and Casey, 1988; Hess et al., 1990; Townsend, 2002). Our field observations confirmed that floodplain areas in Penyingga-han showing bright returns are indeed flooded during high water conditions (Fig. 3 top panel). During our stream re-connaissance survey further upstream of the MMA, we also noted several flood marks on trees that provide an indica-tion of the maximum height of the previous inundaindica-tion in the vegetated floodplain area (Fig. 3 bottom panel). The latter inundation event resulted in a consistently enhanced radar backscatter, as further discussed in Sect. 4.2. For flooding under vegetation cover, we determined the threshold from backscatter statistics obtained from about 7900 pixels sam-pled from the floodplain region upstream of the MMA that was mainly covered by riverine forest, riverine shrubland, and cropland classes. Taking the mean as the lower thresh-old and the maximum as the upper threshthresh-old, we obtained
Table 1.PALSAR images used in this study.
Image
No. PALSAR data dates
1 19 March 2007 2 4 May 2007 3 4 August 2007 4 19 September 2007 5 4 November 2007 6 20 December 2007 7 4 February 2008 8 21 March 2008 9 6 May 2008 10 21 June 2008 11 6 August 2008 12 21 September 2008 13 22 December 2008 14 9 May 2009 15 24 September 2009 16 9 February 2010 17 27 March 2010 18 12 May 2010 19 27 June 2010 20 27 September 2010
the threshold values −7.52 and −2.26 dB for detection of flooding under vegetation cover. Based on Hope et al. (2005), the upstream boundary of the flood occurrence maps are at 24 m a.s.l. (see Fig. 2), which is considered to be the highest elevation in the MMA. The downstream end of the mapped area is the region of Senoni village, where the relief shifts to a steeper terrain that marks the transition to a different geological setting in the downstream region.
Speckle filtering was applied prior to flood occurrence mapping. In a preliminary flood occurrence map derived from unfiltered images, contours of the river and lake ex-tent, which coincide with the circumferences of the areas with maximum flood occurrence, were rather noisy. The en-hanced Lee filter was used to reduce speckle in the radar im-ages while preserving texture information. We applied the filter using a 3 by 3 pixel window. The enhanced Lee filter uses coefficients of variation within an individual filter win-dow. All pixels are divided into three classes: homogeneous, heterogeneous, or point target. Each class type is treated dif-ferently. The pixel value is replaced by the average of the filter window, replaced by the weighted average, or is not changed for homogeneous, heterogeneous, and point target classes, respectively (Lopes et al., 1990).
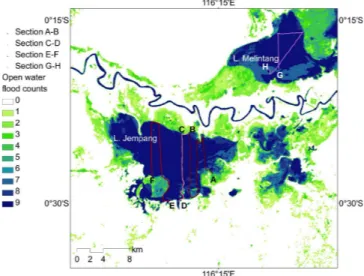
Fig. 5.Bathymetry measurement tracks in the Mahakam River plot-ted on open water flood occurrence maps using the upper threshold values of−14.9 dB (top) and−11.2 dB (bottom).
position of the pressure transducers and water levels to the ground surface. Bathymetry data of lakes were collected using a single beam echosounder.
4 Results and discussion
4.1 Water level and radar backscatter relationship
An analysis of the relationship between radar backscatter and water levels is reported in Hidayat et al. (2011a). For lakes and shrub covered floodplain peatland, where the range of water level variations was large, high water level-backscatter correlations of 0.87–0.98 for the lakes and 0.72–0.99 for the floodplain peatland were obtained. In forest covered peat-land subject to a small range of water level variation, wa-ter level-backscatwa-ter correlations were poor (r= 0.18–0.48). This poor correlation between water level and radar backscat-ter for this area could be related to the limitation of PALSAR over certain thresholds of biomass on the forest canopy. The
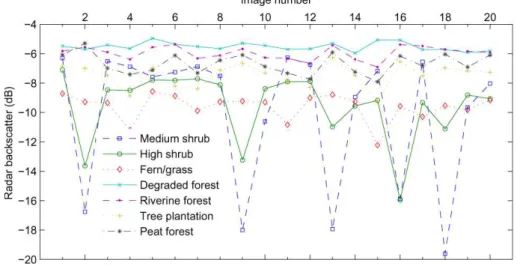
backscatter changes induced by water level variation at loca-tions of water level gauges are likely due to vegetation suc-cession related to inundation dynamics in the study area. This is reflected by high correlations at gauges located in the lakes and floodplain areas with seasonal cycle shrub-type vegeta-tion, and low correlations at gauges located in the peat forest. Radar backscatter intensity depends on land cover type. The land use/land cover map by Hoekman et al. (2010) iden-tified 19 classes of land cover types including water bodies. Figure 6 shows time series of radar backscatter intensity for several key land cover types in the middle Mahakam area, re-vealing a markedly diverging response to flooding. Regularly inundated medium shrub and high shrub were very sensitive to flooding, yielding low backscatter returns when fully in-undated. Other land cover classes representing vegetated ar-eas generally feature a moderate incrar-ease of radar backscatter intensity with flood inundation.
4.2 Temporal analysis of PALSAR data
A temporal analysis of radar backscatter was carried out based on the statistics from 20 images. A standard deviation image captures the backscatter intensity standard deviation for all pixels in the image. From the maximum and minimum value of radar backscatter we obtained the range image. The average absolute difference of consecutive images resulted in the mean change image. The color composite of the latter three images (Fig. 7) reveals a zoning that provides details in an area that was poorly classified in the work of Hoekman et al. (2010), for its complexity. The map shows land cover types that are related to the dynamics of inundation, i.e. the regularly inundated shrubland, reeds/sedges growing during dry season and floating vegetation, such as water hyacinth in lake areas, and rice growing in lake areas in years when flood levels are not too high.
From the mean of three images representing the wettest conditions, we obtained a map with the maximum inundation extent of the MMA, covering inundated areas in both open water and in vegetated areas. Figure 8 shows that a vast area of the MMA is inundated during the flood conditions, includ-ing villages along the Mahakam river and floodplain area, which appear as open water. The open water inundation ex-tent was indicated by dark radar returns. Flooding under veg-etation showed bright radar returns that were colour mapped in Fig. 8 to distinguish flooding under vegetation from open water flooding.
4.3 Flood occurrence mapping of open water extent
Fig. 6.Radar backscatter mean values of land cover classes in the Mahakam lakes area. Image numbers correspond with image acquisition dates in Table 1.
Fig. 7.Results of a temporal analysis of 20 PALSAR images col-lected in the period between 19 March 2007 and 27 September 2010. Light purple indicates the regularly inundated shrubland (1), green indicates reeds/sedges (2), yellow at the southern lake indi-cates rice growing areas in years when flooding is not too high (3).
main river and lakes, by taking the minimum as the lower threshold and mean plus one standard deviation as the up-per threshold. Permanently inundated lake areas and main river sections were well-mapped with the maximum proba-bility of flood occurrence. During the peak flooding events in the rainy seasons in May 2008 and December 2008, a vast area of the MMA was inundated, including villages and cities along the river. These radar-inferred flood events were quali-tatively confirmed by flood marks on houses and trees in the study area, besides water level records from pressure sen-sors. Quantitatively, the open water flood occurrence was
Fig. 8.Inundation extent obtained by averaging three images in wet periods (4 May 2007, 22 December 2008, and 9 February 2010). Dark areas indicate open water inundation extent, cyan indicates flooding under vegetation.
Table 2. Correlation between lake depth and flood occurrence mapped using different periods of PALSAR images for lake sec-tions depicted in Fig. 10.
Period of images # images rA−B rC−D rE−F rG−H 2008–2009 9 0.85 0.84 0.83 0.83 2007–2010 20 0.39 0.41 0.54 0.82
Fig. 9.Flood occurrence map of the middle Mahakam area obtained from the filtered (enhanced Lee) PALSAR images collected in 2008 and 2009.
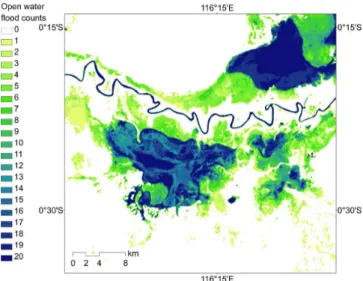
To investigate the occurrence of floods in the MMA over a longer time period, open water flood occurrence maps were produced further using 20 images from the period between 2007 and 2010, adopting the threshold values described in the previous sections. Flooding extents are generally similar between the two flood occurrence maps. However, significant differences can be observed when zooming into the lakes area (Figs. 12 and 10). Table 2 shows the correlations be-tween lake depth and flooding occurrence for the two maps. Depth-occurrence correlations remained relatively high for Lake Melintang (r= 0.82) but dropped for all bathymetry sections in Lake Jempang (r= 0.39–0.54). This may be at-tributed to the stronger influence of human activity in Lake Jempang relative to Lake Melintang. During the dry season, large parts of Lake Jempang are used by local farmers to grow rice. This agricultural activity is not suitable in Lake Melintang due to the low pH values of water derived from peat forest. Compared to 2007, 2008 was a wet year and continued to remain wet in the first half of 2009, which re-sulted in relatively high lake water levels so that rice growth was not possible. In the second half of 2009, however, a rel-atively long dry period occurred. In addition, floating and emergent aquatic vegetation has been growing fast during the dry season and, to some extent, was maintained by local fishermen in Lake Jempang as nesting grounds for fish. Dur-ing the lake emptyDur-ing period followDur-ing the end of the flood
Fig. 10.Bathymetry measurement track in Lake Jempang and Lake Melintang plotted on the flood occurrence map from nine PALSAR images in 2008 and 2009.
event, large parts of the floating plants were flushed down-stream as a drifting bulk of biomass (Fig. 13). These vegeta-tion dynamics and anthropogenic factors hindered validavegeta-tion of flood occurrence maps using lake bathymetry data.
4.4 Flood occurrence mapping of area under vegetation
Fig. 11.Lake depth vs. flood occurrence from nine PALSAR images collected in 2008 and 2009,rvalues indicate correlation coefficients.
Fig. 12.Flood occurrence map from 20 PALSAR images collected in 2007 through 2010, zoomed in to the lakes area.
inundated during the high water period, such that it becomes an extension of the lakes. When the flood recedes, shrub veg-etation falls down and the vegveg-etation succession starts again. Consequently, some of the underestimation or overestima-tion of the extent of the inundated areas cannot be avoided, as noted previously by Romshoo (2006). Figure 15 shows the composite flood occurrence map of the MMA, overlay-ing results for open water and for inundation under
vegeta-Fig. 13. Bulks of floating vegetation flushed off Lake Jempang, drifting downstream during a lake emptying period.
tion. The flood occurrence of the peat swamps in Fig. 15 was mapped using the open water results, which neglects flooding of the peat swamp areas under vegetation. This problem was solved by using a simple procedure to count the total num-ber of flood cases per pixel, which represents open water and flooding under vegetation canopy (Fig. 16). From Fig. 16, it can be inferred that at least 91 % of the mapped area was in-undated during the wettest period, and only about 12 % of the mapped area was inundated during the driest period.
Fig. 14.Water level and radar backscatter return values obtained from a block of nine pixels at the water level gauge locations in the peat forest near Lake Melintang. Blue lines indicate ground levels at the gauge locations. Water levels are with respect to the subterrain position of each pressure sensor. Green circles, upper and lower dots indicate mean, maximum and minimum backscatter values, respectively. The dashed green line indicates the ground level for the radar backscatter return.
Fig. 15. Composite flood occurrence map of the Kutai wet-lands from nine PALSAR images collected in 2008 and 2009 as an overlay of results for open water and for inundation under vegetation cover.
local gauge location is assumed to represent the complete pixel area, which features local topographic irregularities. Consequently, the gauge location may better represent one of the eight pixels surrounding the pixel in which the gauge is located. Figure 14 therefore shows the mean, minimum and maximum backscatter return values within a block of nine pixels at the gauge location, relative to the flooding under vegetation threshold line, and compares those values with the water level relative to the local ground level. In 78 % of the cases, radar-based assessments from one or more of the nine pixels correctly indicated the water level to be above or below the ground level. This gives merely a rough indication of the quality of the map produced, at least showing radar backscat-ter to offer a promising means of monitoring flooding under vegetation. A much larger suite of level gauges and detailed information about the micro topography would be required to achieve a more quantitative accuracy assessment.
5 Conclusions
Flood extent and flood occurrence information were in-ferred from a series of radar images of the middle Ma-hakam lowland area. Relative radar backscatter levels sam-pled in regions of interest and a land use/land cover map showed that different land cover types yield markedly dif-ferent backscatter returns in response to flooding. Regularly inundated medium shrub and high shrub were sensitive to flooding, with decreasing radar backscatter during flood peri-ods, while peat forest, riverine forest and tree plantation sig-natures featured a slight increase of radar backscatter with flood inundation.
Image statistics of the river and main lakes areas were used to determine thresholds to map open water flood occurrence. The minimum was taken as the lower threshold, and the mean plus a standard deviation was taken as the upper threshold. The bathymetry of lakes obtained during a high water period served as validation data for the open water flood occurrence map. High correlations between lake depth and flooding oc-currence were obtained for the map derived for the wet year of 2008–2009, which is the period when field surveys were carried out. For the map derived from input images of 2007– 2010, covering a longer dry period, the correlation between lake depth and flooding occurrence dropped for one partic-ular lake, which was subject to high vegetation dynamics and rice growing activity. In a separate procedure, the av-erage radar backscatter value of the floodplain area was used as a threshold to map flooding under forest canopy. Valida-tion with water level data gave an indicaValida-tion that the flood occurrence map under vegetation cover is fairly accurate.
The flood occurrence map obtained from a newly devel-oped algorithm offers a detailed insight into the hydroperiod and flood extent of the Mahakam lowland area, illustrating the added value of radar remote sensing to wetland hydro-logical studies. As a side effect, we found that simple
statis-tics of the radar backscatter maps such as mean, total range and mean change can be used to improve land classifica-tion maps. This may help future efforts to classify flat and complex wetland areas such as the one under study, where existing classification methods fall short.
Acknowledgements. This research has been supported by the Netherlands organization for scientific research (NWO grant number WT76-268). This work has been undertaken in part within the framework of the ALOS Kyoto & Carbon Initiative. ALOS PALSAR data have been provided by JAXA EORC. The help from Maximiliano Sassi, Bart Vermeulen, Fajar Setiawan, Unggul Handoko, Ulfah Karmilasari and Supriadi in data collection is gratefully acknowledged. Wawan Kustiawan and Y. Budi Sulis-tioadi (Mulawarman University) are thanked for facilitating the field campaign in many ways. We thank Remko Uijlenhoet for the discussion and comments on the early draft of this paper. Renaud Hostache, anonymous reviewers, and the Editor are thanked for their comments and suggestions that helped improve the manuscript.
Edited by: L. Pfister
References
Baird, A. J., Surridge, B. W. J., and Money, R. P.: An assessment of the piezometer method for measuring the hydraulic conductivity of aCladium mariscus-Phragmites australisroot mat in a Nor-folk (UK) fen, Hydrol. Process, 18, 275–291, 2004.
Bonnet, M. P., Barroux, G., Martinez, J. M., Seyler, F., Moreira-Turcq, P., Cochonneau, G., Melack, J. M., Boaventura, G., Maurice-Bourgoin, L., Leon, J. G., Roux, E., Calmant, S., Ko-suth, P., Guyot, J. L., and Seyler, P.: Floodplain hydrology in an Amazon floodplain lake (Lago Grande de Curuai), J. Hydrol., 349, 18–30, 2008.
Bourgeau-Chavez, L. L., Smith, K. B., Brunzell, S. M., Kasis-chke, E. S., Romanowicz, E. A., and Richardson, C. J.: Remote monitoring of regional inundation patterns and hydroperiod in the Greater Everglades using synthetic aperture radar, Wetlands, 25, 176–191, 2005.
Devito, K. J., Hillb, A. R., and Roulet, N.: Groundwater-surface wa-ter inwa-teractions in headwawa-ter forested wetlands of the Canadian Shield, J. Hydrol., 181, 127–147, 1996.
Ford, J. P. and Casey, D. J.: Shuttle radar mapping with diverse in-cidence angles in the rainforest of Borneo, Int. J. Remote Sens., 5, 927–943, 1988.
Fraser, C. J. D., Roulet, N. T., and Lafleur, M.: Groundwater flow patterns in a large peatland, J. Hydrol., 246, 142–154, 2001. Henderson, F. M. and Lewis, A. J.: Radar detection of wetland
ecosystems: a review, Int. J. Remote Sens., 29, 5809–5835, doi:10.1080/01431160801958405, 2008.
Hess, L. L., Melack, J. M., and Simonett, D. D. S.: Radar detection of flooding beneath the forest canopy: a review, Int. J. Remote Sens., II, 1313–1325, 1990.
Hidayat, Hoekman, D. H., Vissers, M. A. M., and Hoitink, A. J. F.: Combining ALOS-PALSAR imagery with field water level mea-surements for flood mapping of a tropical floodplain, SPIE 8286, Proc. Int. Symp. on LIDAR and Radar Mapping: Technolo-gies and Applications, Nanjing, China, doi:10.1117/12.912735, 2011a.
Hidayat, H., Vermeulen, B., Sassi, M. G., Torfs, P. J. J. F., and Hoitink, A. J. F.: Discharge estimation in a backwater affected meandering river, Hydrol. Earth Syst. Sci., 15, 2717–2728, doi:10.5194/hess-15-2717-2011, 2011b.
Hoekman, D. H.: Satellite radar observation of tropical peat swamp forest as a tool for hydrological modelling and environmental protection, Mar. Freshw. Ecosyst., 17, 265–275, 2007.
Hoekman, D. H.: Monitoring tropical peat swamp deforestation and hydrological dynamics by ASAR and PALSAR, in: Geoscience and Remote Sensing, In-Tech, Vienna, 257–275, 2009.
Hoekman, D. H., Vissers, M. A. M., and Wielaard, N.: PALSAR Wide-area mapping of Borneo: methodology and validation, IEEE J. Sel. Topics Appl., 3, 605–617, 2010.
Hope, G., Chokkalingam, U., and Anwar, S.: The stratigraphy and fire history of the Kutai Peatlands, Kalimantan, Indonesia, Qua-ternary Res., 64, 407–417, 2005.
Hostache, R., Matgen, P., Schumann, G., Puech, C., Hoffmann, L., and Pfister, L.: Water level estimation and reduction of hydraulic model calibration uncertainties using satellite SAR images of floods, IEEE T. Geosci. Remote, 47, 431–441, 2009.
Jaenicke, J., W¨osten, H., Budiman, A., and Siegert, F.: Planning hy-drological restoration of peatlands in Indonesia to mitigate car-bon dioxide emissions, Mitig. Adapt. Strateg. Global Change, 15, 223–239, doi:10.1007/s11027-010-9214-5, 2010.
Lewis, A. J.: Geomorphic and hydrologic applications of active mi-crowave remote sensing in principles and application of imaging radar, in: Manual of Remote Sensing, Vol., 2, John Wiley & Sons Inc., New York, 567–618, 1998.
Lopes, A., Touzi, R., and Nezry, E.: Adaptive speckle filters and scene heterogeneity, IEEE T. Geosci. Remote Sens., 28, 992– 1000, 1990.
Matgen, P., Hostache, R., Schumann, G., Pfister, L., Hoffmann, L., and Savenije, H.: Towards an automated SAR-based flood monitoring system: lessons learned from two case studies, Phys. Chem. Earth, 36, 241–252, 2011.
Meehl, G. and Arblaster, J.: The Asian-Australian Monsoon and El Nino-Southern oscillation in the NCAR climate system model, J. Climate, 11, 1356–1385, 1998.
Oberstadler, R., Honsch, H., and Huth, D.: Assessment of the map-ping capabilities of ERS-1 SAR data for flood mapmap-ping: a case study in Germany, Hydrol. Proc., 11, 1415–1425, 1997.
Page, S. E., Wust, R. A. J., Weiss, D., Rieley, J. O., Shotyk, W., and Limin, S. H.: A record of Late Pleistocene and Holocene carbon accumulation and climate change from an equatorial peat bog (Kalimantan, Indonesia): implications for past, present and future carbon dynamics, J. Quarternary Sci., 19, 625–635, doi:10.1002/jqs.884, 2004.
Qi, S., Brown, D. G., Tian, Q., Jiang, L., Zhao, T., and Bergen, K. M.: Inundation extent and flood frequency mapping using LANDSAT imagery and digital elevation models, GISci. Remote Sens., 46, 101–127, doi:10.2747/1548-1603.46.1.101, 2009.
Ran, L. and Lu, X. X.: Delineation of reservoirs using re-mote sensing and their storage estimate: an example of the Yellow River basin, China, Hydrol. Proc., 26, 1215–1229, doi:10.1002/hyp.8224, 2012.
Rebelo, L. M., Finlayson, C. M., and Nagabhatla, N.: Remote sens-ing and GIS for wetland inventory, mappsens-ing and change analy-sis, J. Environ. Manage., 90, 2144–2153, 2009.
Romshoo, S. A.: Radar remote sensing for monitoring of dynamic ecosystem processes related to biogeochemical exchanges in tropical peatlands, Vis. Geosci., 9, 9–28, doi:10.1007/s10069-003-0015-9, 2006.
Rosenqvist, A. and Birkett, C. M.: Evaluation of JERS-1 SAR mo-saics for hydrological applications in the Congo River basin, Int. J. Remote Sens., 23, 1283–1302, 2002.
Rosenqvist, A., Shimada, M., Ito, N., and Watanabe, M.: ALOS PALSAR: a pathfinder mission for global-scale monitoring of the environment, IEEE T. Geosci. Remote Sens., 45, 3307–3316, 2007.
Salvia, M., Grings, F., Ferrazzoli, P., Barraza, V., Douna, V., Perna, P., Bruscantini, C., and Karszenbaum, H.: Estimating flooded area and mean water level using active and passive microwaves: the example of Paran´a River Delta floodplain, Hydrol. Earth Syst. Sci., 15, 2679–2692, doi:10.5194/hess-15-2679-2011, 2011. Schumann, G., Pappenberger, F., and Matgen, P.: Estimating
uncer-tainty associated with water stages from a single SAR image, Adv. Water Sci., 31, 1038–1047, 2008.
Townsend, P. A.: Relationships between forest structure and the de-tection of flood inundation in forested wetlands using C-band SAR, Int. J. Remote Sens., 23, 443–460, 2002.