Predicting Interactions between HIV-1 and Human
Proteins
Suyu Mei*
Software College, Shenyang Normal University, Shenyang, China
Abstract
Reconstruction of host-pathogen protein interaction networks is of great significance to reveal the underlying microbic pathogenesis. However, the current experimentally-derived networks are generally small and should be augmented by computational methods for less-biased biological inference. From the point of view of computational modelling, data scarcity,data unavailabilityandnegative data samplingare the three major problems for host-pathogen protein interaction networks reconstruction. In this work, we are motivated to address the three concerns and propose a probability weighted ensemble transfer learning model for HIV-human protein interaction prediction (PWEN-TLM), wheresupport vector machine (SVM) is adopted as the individual classifier of the ensemble model. In the model,data scarcityanddata unavailabilityare tackled by homolog knowledge transfer. The importance of homolog knowledge is measured by theROC-AUCmetric of the individual classifiers, whose outputs are probability weighted to yield the final decision. In addition, we further validate the assumption that only the homolog knowledge is sufficient to train a satisfactory model for host-pathogen protein interaction prediction. Thus the model is more robust againstdata unavailabilitywith less demanding data constraint. As regards withnegativedata construction, experiments show thatexclusiveness of subcellular co-localized proteinsis unbiased and more reliable thanrandom sampling. Last, we conduct analysis of overlapped predictions between our model and the existing models, and apply the model to novel host-pathogen PPIs recognition for further biological research.
Citation:Mei S (2013) Probability Weighted Ensemble Transfer Learning for Predicting Interactions between HIV-1 and Human Proteins. PLoS ONE 8(11): e79606. doi:10.1371/journal.pone.0079606
Editor:Luis Mene´ndez-Arias, Centro de Biologı´a Molecular Severo Ochoa (CSIC-UAM), Spain
ReceivedMay 3, 2013;AcceptedSeptember 24, 2013;PublishedNovember 18, 2013
Copyright:ß2013 Suyu Mei. This is an open-access article distributed under the terms of the Creative Commons Attribution License, which permits unrestricted use, distribution, and reproduction in any medium, provided the original author and source are credited.
Funding:This author has no support or funding to report.
Competing Interests:The author has declared that no competing interests exist. * E-mail: [email protected]
Introduction
Accurate mapping of protein interactome is essential to reveal protein functions, biological processes, signal transduction path-ways. In recent years, although high throughput experimental techniques have drastically accumulated much knowledge about protein-protein interactions (PPI), the derived PPI networks are far incomplete and noisy [1,2]. As a good complement to the labour-intensive biological experiments, computational methods can accelerate the reconstruction of PPI networks at low cost [3].
At present most of the existing computational methods are
developed for intra-speciesPPI networks reconstruction, e.g. yeast
PPI network [3],Arabidopsis thalianaPPI network [4], human PPI
network [5], etc. As compared to intra-species PPI networks
reconstruction, inter-species host-pathogen PPI networks (the
interacting partners are from two different species) reconstruction is faced up with more challenges in that the scale of the host-pathogen PPI networks is generally rather small. Small PPI
network results in data scarcity that would easily lead to poor
generalization ability of computational model.Data integrationis an
effective method to compensate fordata scarcity. By simultaneously
leveraging a catalog of biological feature information, data
integration can greatly increase the information abundance for
sufficient model training. Tastan et al. [6] appliedRandom Forestto
integrate the feature information of binding motif, gene expression
profile, gene ontology, sequence similarity, post-translational modification, tissue distribution and PPI network topology for HIV-human protein interaction prediction. Based on the work, Qi et al. [7] further proposed a semi-supervised multi-task learning method to exploit
the weakly labelled data. Dyer et al. [8] combinedprotein domain
profile, sequence k-mer and PPI network properties for HIV-human protein interaction prediction. For another pathogenetic microbe Plasmodium falciparum, Dyer et al. [9] combinedprotein domain profile, gene expression, gene ontology and gene co-expression to predict and validate the host-pathogen protein interactions. Wuchty S [10]
combinedsequence k-mer, interlog, gene ontologyand signal transduction
pathwaysto predict and validate the protein interactions between Plasmodium falciparumandHomo sapiens. In the latter two models, the
validation information (gene co-expression,signal transduction pathways,
gene ontology) was used to manually filter the predicted PPIs. It has
been claimed thatgene ontology(GO) is one of the strongest indicators
for host-pathogen PPI prediction [6] and intra-species PPI
prediction [3,4,11,12,13,14,15,16,17] among the catalog of feature
information. The work [14] explained the reasons whyGOfeature
outperformed the other feature information based on the
observations: (1) proteins localized in identicalcellular compartments
are more likely to interact than are proteins that reside in spatially distant compartments; (2) proteins that participate in similar biological processesor perform similarmolecular functionsare likely to
biological processesandmolecular functions) are informative to indicate PPI.
Although data integration can simultaneously exploit multiple
aspects of biological knowledge, the difficulty in availability of
some feature information such as gene co-expression poses a great
challenge on host-pathogen PPI networks reconstruction [9]. Once the feature information is unavailable for the proteins to be
predicted, thedata integration methods [4,6,7,11,16] would fail to
work. Even for those methods that exploit only one type of
non-sequence feature information (e.g.gene ontology) [14],data integration
would also fail to work because the information required for
prediction (e.g.GOannotations) may be potentially not available.
For the reasons,data integrationmodel should deliberately take into
account the case ofdata unavailabilityand provide effective solutions
to information substitution. Less demanding data constraint helps the model gain wide applicability. Like the other feature
information,structural similarity, is also a strong indicator of
protein-protein interaction. Doolittle et al. [18] exploited the information
of protein structural similarity to predict host-pathogen PPI.
However, the potential unavailability of the spatial structural
information would likewise restrict the model application. As
compared to the costly feature information such as structural
information,gene ontology,gene co-expressionandmetabolic pathways, etc., obtaining protein sequence information is less expensive, thus the computational model based on protein sequence only has the least
data constraint nearly without the problem of data unavailability.
Unfortunately, the work [19] argued that protein sequence alone was not sufficient to train a satisfactory model for PPI prediction. HIV-human PPI prediction can be viewed as a problem of
2-class 2-classification that needs bothpositivedata andnegativedata to
define the decision function.Positivedata contains the information
of interaction and negative data contains the information of
non-interaction. Unfortunately, there are far few experimentally
derived negative data available to computational modelling for
host-pathogen PPI networks reconstruction. At present negative
data construction is a hard-tackling problem and the common
method is random sampling. Random sampling is simple but has the
demerits of model uncertainty and potential inclusion of
interact-ing protein pairs. The work [20] proposed one-class Biclustering
method to mine association rules from thepositivedata for
HIV-human PPI prediction. Biclusteringneed not construct thenegative
data, so that the computational modelling is much simplified.
However, the model that does not learn thenon-interactingpatterns
would run the risk of high rate offalse positive.
In this work, we are motivated to address the concerns ofdata
scarcity,data unavailabilityandnegative data samplingfor HIV-human
PPI prediction. To reduce data dependency, we choosegene ontology
as the only feature information for host-pathogen PPI prediction.
Unlike the existing GO-based PPI prediction models [3,4,6,7,
11,12,13,14,15,16,17], we attempt to exploit the homolog GO
information (GO annotations from the homologs) to compensate
for data scarcity and data unavailability. We deliberately investigate
the assumption that only the homologGOinformation is sufficient
to train a satisfactory model for HIV-human PPI prediction. If the assumption is validated, effective information substitution could
make the model more robust against data unavailability with less
demanding data constraint. To validate the assumption, we
conduct three experimental settings, namely theOptimistic case, the
Moderate caseand thePessimistic case. TheOptimistic caseassumes that
both the targetGOinformation (GOannotations from the protein
itself) and the homologGO information are available for model
training and model evaluation. Good performance can indicate that data scarcity is properly tackled to a certain degree. The Moderate case assumes that the target GO information of the test
data is not available and thePessimistic caseassumes that the target
GO information of the training data and the test data is not
available. If any of the two cases achieves good performance, it can
be convincingly concluded thatdata unavailabilityis well tackled. As
regards with negative data sampling, we further conduct two
experimental settings for each case, one is random sampling and
the other isexclusiveness of subcellular co-localized proteins. All the tasks
are implemented by our proposedprobabilityweightedensemble
transferlearningmodel (PWEN-TLM). The targetGOinformation
and the homolog GO information are used to train individual
support vector machine (SVM) and are assigned different weights according to their contributions to the model performance. The merit is that the weights could depress the potential noise from the
homolog GO information. To investigate the importance of
molecular functions, cellular compartments and biological processes (three
aspects ofgene ontology) to HIV-human PPI prediction, the three
aspects of the target GO information and the homolog GO
information are used to train three individual classifiers respec-tively, thus there are totally 6 individual classifiers. The ensemble classifier yields the final decision in the form of probability by linearly weighting the probability outputs of the individual classifiers. For critical model performance estimation, we conduct cross validation, independent test and novel PPI detection on the benchmark HIV-human PPI dataset [21].
Methods
Transfer Learning
Transfer learning is a hot research topic in machine learning community. As compared to traditional supervised learning, transfer learning aims at leveraging useful information from auxiliary data. In most cases, the auxiliary data and the target data show different distributions or heterogeneous representations [22]. Especially in bioinformatics field, the biological data from different laboratories are usually subjected to different distributions, heterogeneous representations and noise levels [23]. Thus it is necessary for us to develop sophisticated transfer learning models to exploit useful information from the auxiliary data for the target domain learning. The work [24,25,26] proposed several non-parametric multiple kernel learning based transfer learning models (GO-TLM, MK-TLM and MLMK-TLM) to reduce the risk of negative knowledge transfer. In this work, we propose a probability
weighted ensemble learning model (PWEN-TLM) to transfer the
homologGOinformation to enrich or substitute for the targetGO
information. As compared to multiple kernel learning based transfer learning models, the ensemble based transfer learning
method can take full advantages of SVM (support vector machine)
sparsenessto reduce the computational complexity. The details are
described in the sectionProbability weighted ensemble learning.
GOFeature Construction
The homologs are extracted fromSwissProt57.3 database [27]
usingPSI-BLast[28]. Here we adopt thedefaultparameters setting
(e.g. defaultE-value= 10) to enlarge theGOterm coverage. TheGO
terms are extracted from the latest GOA database [29] (114
Release, as of 28 November, 2012). For each proteini, we separate
the target set ofGOterms (denoted asSi
T) from the homolog set of
GO terms (denoted as Si
H), and further divide S
i T,S
i
H into three
subsets corresponding to the three aspects ofgene ontology, denoted
asSi
T,F,S i T,C,S
i T,P;S
i H,F,S
i H,C,S
i
H,P, respectively. Here Tdenotes the
target protein,Hdenotes the homolog protein,Fdenotesmolecular
protein itself (comparative tohomolog), it does not refer to the virus -targeted protein. Let capital Idenote the set of proteins, then the
total set ofGOterms can be defined as follows:
SuI,v~|
i[IS i
u,v,u[fT,Hg,v[fF,C,Pg ð1Þ
Based on the denotations, we can formally define the feature
vector for each PPI pair (i1,i2) as follows:
Bu,v½g~
0,g=[Si1
u,v^g=[S i2 u,v
2,g[Si1
u,v^g[S i2 u,v 1,otherwise 8
> <
> :
g[SIu,v,u[fT,Hg,v[fF,C,Pg ð2Þ
whereBu,v½gdenotes the componentgof PPI feature vectorBu,v
(each PPI pair follows the same feature representation, so we use
Bu,vinstead ofB(ui,1,vi2)as the general definition). Formula (2) means
that if the interacting protein pair shares the sameGOtermg, then
the corresponding component in the feature vectorBis set 2; if
neither protein in the protein pair (i1,i2) possessesGOtermg,then
the value is set 0; otherwise the value is set 1. From the formula, we
can see that the above definition is symmetrical, i.e., (i1,i2) and
(i2,i1) have identical feature representation, thus the order of the
proteins in each protein pair does not change the feature representation.
Probability Weighted Ensemble Learning
Sparseness is one of the graceful characteristics of SVM, which
means that the parameters are optimized on a small working set
instead of the whole training set [30].Kuhn-Tucker Theoremstates
that only the training examples that lie on the surface of the
optimal hypersphere have their correspondingLagrangeparameters
non-zero, and the correspondingLagrangeparameters are all zero
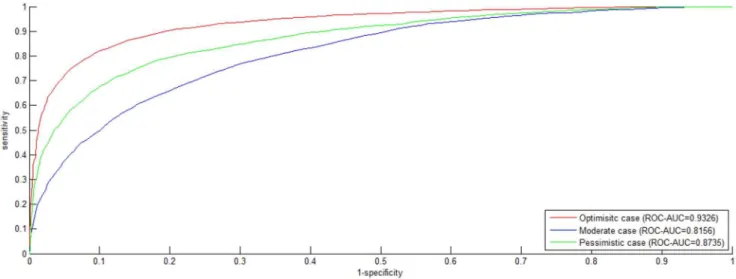
Figure 1.ROC curveonS1dataset.The negative data is constructed by the negative data sampling method ofexclusiveness of subcellular co-localized proteins. TheROCcurves in red, blue and green indicate the performance for theOptimisticcase, theModeratecase and thePessimisticcase, respectively.
doi:10.1371/journal.pone.0079606.g001
Figure 2.Precision-Recall (PR) curveonS1dataset.The negative data is constructed by the negative data sampling method ofexclusiveness of subcellular co-localized proteins. ThePRcurves in red, blue and green indicate the performance for theOptimisticcase, theModeratecase and the
Pessimisticcase, respectively.
for the remaining examples. The training examples with non-zero Lagrange parameters are referred to as support vectors. Only the support vectorsare informative to support the optimal hypersphere
and the other data can be discarded. Assuming there are‘training
data, theworking set that helps define the final decision function
generally contains rather small number of data points d, d%‘,
that’s, we only need to compute the kernel matrix on theworking set
(O(d2)) instead of the whole training dataset (O(‘2)), thus the
runtime complexity and the space complexity are greatly reduced.
In our method, the six independent individualSVMs (denoted as
SVMu,v,u[fT,Hg,v[fF,C,Pg) trained by the six feature vectors
(Bu,v,u[fT,Hg,v[fF,C,Pg) have time complexityO(6d2), much
smaller than themultiple kernel learningmethodO(6‘2).
Traditional two-class labels {21, +1} are not convenient to
reveal the confidence level of the prediction. Probability output is a good alternative to the classical 2-class output and is especially applicable to vote-weighted ensemble learning for the final decisions combination. Platt [31] proposed a method to yield
posterior class probability output for binarySVMas defined below:
hy(x)~p(yDx)~1=(1zeAf(x)zB) ð3Þ
where the coefficientAand Bcan be derived from data by cross
validation, andf(x)is the decision value of binarySVM. The final
decision function of the ensemble classifier is defined as follows:
l(x)~max argj( X u[fT,Hg
X
v[fF,C,Pg
wu,v|p(u,v),j),j~{1,z1 ð4Þ
where x denotes the test protein, wu,v,u[fT,Hg,v[fF,C,Pg
denotes the weight of the individual classifierSVMu,v,u[fT,Hg,
v[fF,C,Pgandp(u,v),j denotes the probability that the individual
classifierSVMu,v,u[fT,Hg,v[fF,C,Pgassigns proteinxto the jth
class. ROC curve [32] is a frequently-used statistical tool to illustrate the predictive performance of 2-class classification. In this work, we use AUC score (area under the ROC curve) to measure
the individual SVM weightwu,v,u[fT,Hg,v[fF,C,Pg:
wu,v~AUCu,v
,
P
u
P
v
AUCu,v,u[fT,Hg,v[fF,C,Pg ð5Þ
where AUCu,v,u[fT,Hg,v[fF,C,Pg can be derived by 2-fold
cross validation on the training set. The individual
SVMu,v,u[fT,Hg,v[fF,C,Pgadopts Gaussian kernel defined as
follows:
K(x,y)~exp ({cDDx{yDD2) ð6Þ
whereDDDDdenotes 2-norm of a vector, and the hyperparameterc
controls the flexibility of the kernel.
Model Evaluation and Model Selection
We design three experimental settings, namely theOptimistic case,
theModerate caseand thePessimistic case, to validate the assumptions
that the homologGOinformation is useful to tackle the problems
ofdata scarcityanddata unavailability. To formally define the three cases, we first define the following sets:
Table 1.Cross validation performance estimation on datasetS1.
PWEN-TLM-I (Optimistic) PWEN-TLM-II (Moderate) PWEN-TLM-III (Pessimistic)
SP SE MCC SP SE MCC SP SE MCC
Positive (interacting) 0.8774 0.8282 0.7439 0.6015 0.9612 0.5733 0.8160 0.7804 0.6589
Negative (non-interacting) 0.8373 0.8843 0.7471 0.9036 0.3631 0.4604 0.7896 0.8241 0.6631
[AUC;Acc;MCC] [0.9326; 85.62%; 0.7446] [0.8155; 66.22%; 0.4606] [0.8735;80.22%;0.6605]
doi:10.1371/journal.pone.0079606.t001
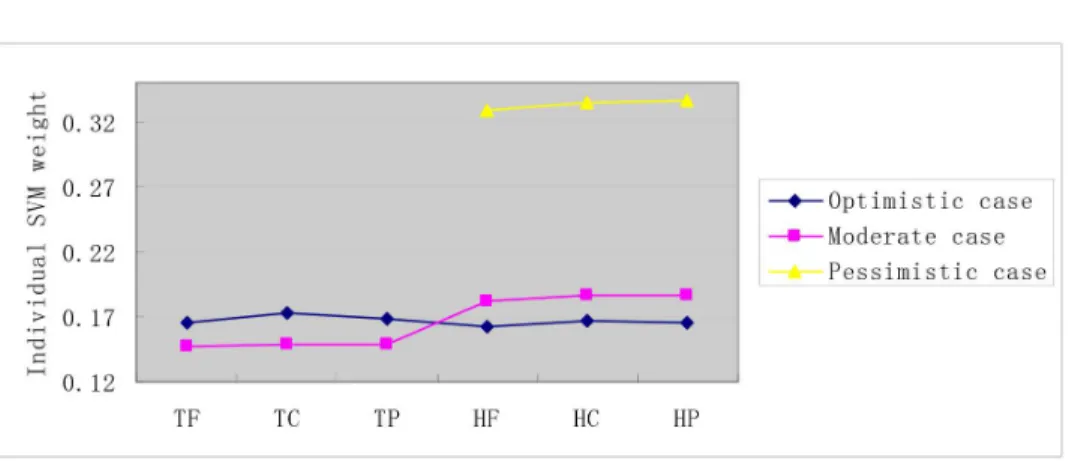
Figure 3. IndividualSVMweight distribution onS1dataset.The negative data is constructed by the negative data sampling method of
exclusiveness of subcellular co-localized proteins. The horizontal axis is the combination of two sets {T, H} and {F,C, P}. T denotes the target protein, H denotes the homolog protein; F denotesmolecular function, C denotescellular componentand P denotesbiological process.
Strain
u ~|
i[I1
|
v[fF,C,Pg Si
u,vu[fT,Hg
Stest
u ~|
i[I2
|
v[fF,C,Pg Si
u,vu[fT,Hg
ð7Þ
whereI1,I2denote the training set and the test set,Strainu u[fT,Hg
denotes the targetGOterm set and the homologGOterm set of the
training data, Stest
u u[fT,Hgdenotes the target GOterm set and
the homologGOterm set of the test data. Based on the notations,
we can formally define the three cases as follows:
1:PWEN{TLM{I(Optimistic): (Strain
T =w^S
test
T =w)^(S train
H =w^S
test H =w) 2:PWEN{TLM{II(Moderate):
(Strain
T =w^S
test
T ~w)^(S train
H =w^S
test H =w) 3:PWEN{TLM{III(Pessimistic): (Strain
T ~w^S
test
T ~w)^(S train
H =w^S
test H =w)
8 > > > > > > > > > <
> > > > > > > > > :
ð8Þ
From the formula, we can see that both the training set and the
test set abound in targetGOinformation in theOptimisticcase, the
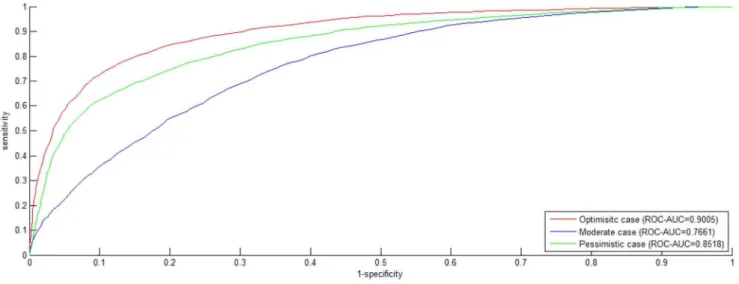
Figure 4.ROC curveonS2dataset.The negative data is constructed by by the negative data sampling method ofrandom sampling. TheROC
curves in red, blue and green indicate the performance for theOptimisticcase, theModeratecase and thePessimisticcase, respectively. doi:10.1371/journal.pone.0079606.g004
Figure 5.Precision-Recall (PR) curveonS2dataset.The negative data is constructed by by the negative data sampling method ofrandom sampling. ThePR curves in red, blue and green indicate the performance for theOptimistic case, theModeratecase and thePessimisticcase, respectively.
test set contains no targetGOinformation in theModerate case, and
neither the training set nor the test set contains target GO
information in thePessimistic case.In theModerate case, we substitute
the homolog GO information Stest
H for the missing target GO
informationStest
T . In thePessimistic case, we use the homologGO
information (Strain
H ,S test
H ) alone.
We conduct model estimation and mode selection by two-level cross validation. The outer 3-fold cross validation is conducted for model estimation and the inner 2-fold cross validation is
conducted to derive the weights of individual SVM classifiers.
For the outer 3-fold cross validation, the dataset is randomly divided into three nearly-even disjoint subsets that have the same
distributions as the original dataset (stratified cross validation). For
each outer fold, one subset is used as test set and the other two subsets are merged as training set, which repeat three times until all data are estimated. Within each outer fold, 2-fold inner cross validation is further conducted for weight derivation on the training set.
HIV-1 protein can be catalogued as Env, Gag, Nef, Pol, Rev, Tat, Vif, Vpr and Vpu [21]. For the sake of critical assessment of model performance, we also conduct several independent tests by treating one catalogue of HIV-1 proteins (e.g. Env) as independent test set and the other catalogues of HIV-1 proteins (e.g. Gag, Nef, Pol, Rev, Tat, Vif, Vpr, Vpu) are merged as training set. In such a way, the independent test is more challenging because the test data (e.g. Env) have no corresponding training data in the training set (e.g. Gag, Nef, Pol, Rev, Tat, Vif, Vpr, Vpu). Wide variance between the test set and the training set helps conduct more critical performance estimation on the proposed model.
The model performance is measured by Receiver Operating
Characteristic (ROC) AUC (Area Under Curve) (ROC-AUC), Precision recall curve AUC(PR-AUC),Specificity(SP),Sensitivity(SE) andMCC (Matthews correlation coefficient). The performance metricsSP,SEand
MCCcan be calculated through confusion matrixM. By means of
the intermediate variables defined as formula (9), we can calculate
SP, SEandMCC for each label (SPl,SEl andMCCl) by formula
(10), and further calculate the overall accuracy (Acc) and the overall
MCC (MCC) by formula (11).
pl~Ml,l,ql~
XL
i~1,i=l
XL
j~1,j=l
Mi,j,rl~
XL
i~1,i=l
Mi,l,sl
~ X
L
j~1,j=l
Ml,j
p~X
L
l~1 pl,q~
XL
l~1 ql,r~
XL
l~1 rl,s~
XL
l~1 sl
ð9Þ
SPl~pl=plzrl,l~1,2:::,L
SEl~pl=plzsl,l~1,2:::,L
MCCl~(plql{rlsl)
. ffiffiffiffiffiffiffiffiffiffiffiffiffiffiffiffiffiffiffiffiffiffiffiffiffiffiffiffiffiffiffiffiffiffiffiffiffiffiffiffiffiffiffiffiffiffiffiffiffiffiffiffiffiffiffiffiffiffiffiffi (plzrl)(plzsl)(qlzrl)(qlzsl)
p
,l
~1,2:::,L
ð10Þ
Acc~XL
l~1Ml,l .XL
i~1 XL
j~1Mi,j MCC~(pq{rs).p(ffiffiffiffiffiffiffiffiffiffiffiffiffiffiffiffiffiffiffiffiffiffiffiffiffiffiffiffiffiffiffiffiffiffiffiffiffiffiffiffiffiffiffiffiffiffiffiffiffipzr)(pzs)(qzr)(qzs)
ð11Þ
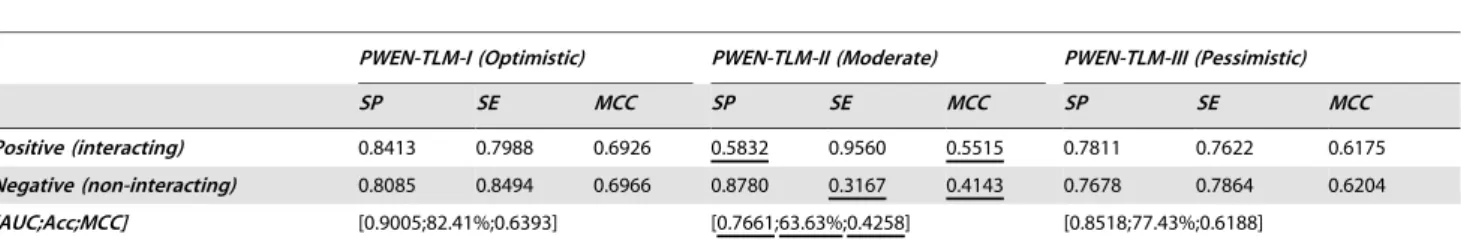
Table 2.Cross validation performance estimation on datasetS2.
PWEN-TLM-I (Optimistic) PWEN-TLM-II (Moderate) PWEN-TLM-III (Pessimistic)
SP SE MCC SP SE MCC SP SE MCC
Positive (interacting) 0.8413 0.7988 0.6926 0.5832 0.9560 0.5515 0.7811 0.7622 0.6175
Negative (non-interacting) 0.8085 0.8494 0.6966 0.8780 0.3167 0.4143 0.7678 0.7864 0.6204
[AUC;Acc;MCC] [0.9005;82.41%;0.6393] [0.7661;63.63%;0.4258] [0.8518;77.43%;0.6188]
doi:10.1371/journal.pone.0079606.t002
Figure 6. IndividualSVMweight distribution onS2dataset.The negative data is constructed by by the negative data sampling method of
random sampling. The horizontal axis is the combination of two sets {T, H} and {F,C, P}. T denotes the target protein, H denotes the homolog protein; F denotesmolecular function, C denotescellular componentand P denotesbiological process.
where the confusion matrixMi,jrecords the counts that classiare
classified to class j and L denotes the number of labels.AUC is
calculated based on the weightedSVMdecision values.
Results
Data and Materials
The interactions between HIV-1 and human proteins are taken from the database available at http://www.ncbi.nlm.nih.gov/ projects/RefSeq/HIVInteractions/[21]. In order to acquire
corresponding gene ontology annotations, we map the protein
accessions to Uniprot accessions via the id mapping file available at ftp://ftp.uniprot.org/pub/databases/uniprot/current_release/ knowledgebase/idmapping/idmapping.dat.gz. After removing du-plicate PPIs and putative PPIs, we totally get 3,638 PPIs including 539 Env PPIs, 487 Gag PPIs, 349 Nef PPIs, 272 Pol PPIs, 278 Rev PPIs, 1,101 Tat PPIs, 126 Vif PPIs, 338 Vpr PPIs and 148 Vpu
PPIs. All the PPIs are treated aspositive data. As far, there is no
gold-standardnegativedata available for model training and model
assessment. How to construct negative data is still a challenging
problem for PPI prediction. At present, the common practice to
generate negative data is random sampling from the huge
protein-protein pair space exclusive of those experimentally derived PPIs.
Unbiased as it is, random sampling would probably introduce a
certain level of noise. For the reason, the work [33] proposed to
exclude those subcellularco-localizedproteins out of thenegativedata
(hereinafter calledexclusiveness of subcellular co-localized proteins), based
on the common sense that subcellularco-localizationis the premise
of protein-protein physical interaction. But even so, the method still received criticism that the information about protein subcellular localization is likely to dominate the prediction and thus yields bias. In this work, we will compare the two methods of negative data samplingand investigate whether or notexclusiveness of subcellular co-localized proteins yields model bias. For simplicity of
reference, we call S1 the dataset with negative data exclusive of
subcellularco-localizedproteins, andS2the dataset with randomly
samplednegativedata. DatasetS1andS2both contain 3,638positive
data and 3,638negativedata.
How to determine the ratio ofpositivedata tonegative data is a
second concern to be addressed. The work [7,8] solved the
problem by introducing different ratio of positive data to negative
data (e.g. 1:1, 1:100) to train the model. Actually, the true ratio is
hard to determine and pooling so large anegativedata makes little
sense to computational modelling. Contrarily, the adverse effect is that extremely unbalanced training data would yield a highly
biased model. For the reason, we construct anegativedata with the
same size as thepositive data. To randomly select a quality and
representativenegative data is a hard and important problem to
computational biologists, though maybe not so appealing to experimental biologists. For reliable computational modelling,
experimental evidences ofnegatomeshould be collected and made
available to academic use.
Model comparison is a third concern for the reasons: (1) there is no standard benchmark data available for model evaluation and
comparison; (2) some positive data are outdated and some novel
positivedata are included; (3)random samplingofnegativedata yields different training data; (4) there are no identical data partition of cross validation, etc. Hence, what we can do is to conduct critical
assessment on the proposed model and conduct aroughcomparison
with other models for biologists’ reference.
Model Performance Evaluation
Cross validation performance evaluation. Dataset S1
totally contains 7,672 data including 3,638 positive data and
3,638negative data. The ROC curvefor 3-fold cross validation on
datasetS1is shown in Figure 1, where theROC curvesare drawn for
the three cases. In theOptimistic case,PWEN-TLMachievesROC
-AUC score 0.9326, a little better than SMLR (ROC-AUC score
0.919) [7] that combined 16 catalogs of feature information
includinggene ontology. From Figure 1, we can see thatPWEN-TLM
performs the best in theOptimisticcase (AUC= 0.9326), the second
in thePessimisticcase (AUC= 0.8735) and the worst in theModerate
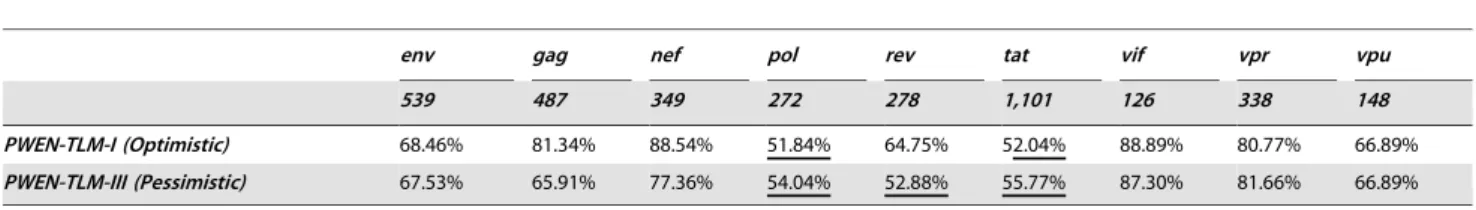
Table 3.Independent test performance estimation.
env gag nef pol rev tat vif vpr vpu
539 487 349 272 278 1,101 126 338 148
PWEN-TLM-I (Optimistic) 68.46% 81.34% 88.54% 51.84% 64.75% 52.04% 88.89% 80.77% 66.89%
PWEN-TLM-III (Pessimistic) 67.53% 65.91% 77.36% 54.04% 52.88% 55.77% 87.30% 81.66% 66.89%
doi:10.1371/journal.pone.0079606.t003
Figure 7. Degree distribution of the HIV-targeted human proteins in human PPI network.The horizontal axis denotes protein degree and the vertical axis denotes the number of proteins that possess that degree.
case (AUC= 0.8156). The relatively small performance difference
between theOptimisticcase and thePessimisticcase (ROC-AUCscore
difference = 0.0591) demonstrates that PWEN-TLM still works
soundly when the targetGOinformation is not available, and thus
the homolog GO information can be treated as an effective
substitute for the potentially unavailable targetGOinformation. If
the protein pair to be predicted contains novel protein, we can
choose the model that is trained for thePessimisticcase. The results
thatPWEN-TLMperforms the worst in the Moderatecase can be
explained that the heterogeneous distribution betweenStest
T and Stest
H deteriorates the model performance. The performance
deterioration reveals thatdata unavailabilityis an important concern
to be addressed for computational modelling. The data integration
modelSMLR[7] did not deliberately dwell on the problem ofdata
unavailability.
Dyer et al. [8] adoptedPR-AUC(AUCofPrecision-Recall Curve) as
the performance metric of HIV-human PPI prediction. In their
work, the bestPR-AUCscore among different ratios ofpositivedata
tonegativedata is 0.707. As compared toROC Curve,Precision-Recall Curveis more suited to highly skewed (extremely unbalanced) data
[34]. For comparison, we also plot Precision-Recall Curve and
indicate the correspondingPR-AUCscore in Figure 2. As shown in
Figure 2,PWEN-TLMachievesPR-AUCscore 0.9361, 0.8172 and
0.8799 in theOptimisticcase, theModeratecase and the Pessimistic
case, respectively. ThePR-AUC scores demonstrate that
PWEN-TLMsignificantly outperforms the baseline model (PR-AUCscore
0.707) [7]. By comparing Figure 1 and Figure 2, we can see that
there is little difference between ROC-AUC score and PR-AUC
score. The reason is that dataset S1 is not skewed but perfectly
balancedwith 1:1 ratio ofpositivedata tonegativedata.Skewedtraining data is prone to yield a biased model.
ROC curveplots the truepositiverate against the falsepositiverate and Precision-Recall curveplots the precision againstrecall. Both the
curves focus on the reliability ofpositivepredictions, but thenegative
Table 4.Predicted interactions between env_gp160 and human proteins.
GO
category Predicted interacting human partners
GO term GO description Rate Main cluster of interacting human partners Biological
process
GO:0044267 cellular protein metabolic process
23% Q9NR34[0.91];Q5I7T1[0.67];Q9NYU2[0.92];Q8N3T1[0.71]; Q9NY97[0.86];O43173[0.70];Q13454[0.72];Q9BV94[0.81]; O60476[0.91];Q8IUC8[0.70]
GO:0043687 post-translational protein modification
23% Q9NR34[0.91];Q5I7T1[0.67];Q9NYU2[0.92];Q8N3T1[0.71];Q9NY97[0.86];O43173[0.70];Q13454[0.72]; Q9BV94[0.81];O60476[0.91];Q8IUC8[0.70]
GO:0006486 protein glycosylation
18% Q9NR34[0.91];Q5I7T1[0.67];Q9NYU2[0.92];Q8N3T1[0.71];Q9NY97[0.86];O43173[0.70];O60476[0.91]; Q8IUC8[0.70]
GO:0006457 protein folding 16% Q9UDY4[0.79];Q9NYU2[0.92];O14967[0.87];O60884[0.79];P30414[0.78];Q14696[0.81];Q9BV94[0.81]
GO:0006810 transport 9% P13866[0.75];Q01650[0.86];Q13454[0.72];>O75947[0.73]
GO:0006954 inflammatory response
9% O43916[0.87];Q96E93[0.78];Q9NYK1[0.62];Q9H293[0.62]
GO:0045087 innate immune response
7% Q96E93[0.78];Q9NYK1[0.62];Q9NY25[0.61]
Cellular component
GO:0016020 membrane 77% O43916[0.87];Q86Z14[0.72];Q9NR34[0.91];Q9UDY4[0.79];O75509[0.63];P13866[0.75];Q96E93[0.78]; Q8IXI1[0.82];Q5I7T1[0.67];O14967[0.87];Q8N3T1[0.71];Q01650[0.86];P41732[0.63];O75096[0.61]; O60884[0.79];Q9NY97[0.86];P30414[0.78];O43173[0.70];P06126[0.82];Q9NYK1[0.62];P04062[0.79]; Q13454[0.72];P43626[0.66];Q9P035[0.89];Q9NY25[0.61];O75947[0.73];Q9H293[0.62];Q6UW60[0.69]; P23435[0.65];Q9BV94[0.81];O14548[0.71];O60476[0.91]0.70];P09669[0.77]
GO:0016021 integral to membrane
57% O43916[0.87];Q86Z14[0.72];Q9NR34[0.91];O75509[0.63];P13866[0.75];Q96E93[0.78];Q8IXI1[0.82]; Q5I7T1[0.67];O14967[0.87];Q8N3T1[0.71];Q01650[0.86];P41732[0.63];O75096[0.61];Q9NY97[0.86]; O43173[0.70];P06126[0.82];Q9NYK1[0.62];Q13454[0.72];P43626[0.66];Q9P035[0.89];Q9NY25[0.61]; Q6UW60[0.69];O60476[0.91];Q8IUC8[0.70];P09669[0.77]
GO:0005886 plasma membrane 32% Q86Z14[0.72];Q9UDY4[0.79];O75509[0.63];P13866[0.75];Q96E93[0.78];Q8IXI1[0.82];Q5I7T1[0.67]; Q01650[0.86];O75096[0.61];P06126[0.82];Q9NYK1[0.62];P43626[0.66];Q9NY25[0.61];Q14696[0.81]
GO:0000139 Golgi membrane 18% O43916[0.87];Q9NR34[0.91];Q8N3T1[0.71];Q9NY97[0.86];O43173[0.70];Q9NYK1[0.62];O60476[0.91]; Q8IUC8[0.70]
Molecular function
GO:0016787 hydrolase activity 20% Q9NR34[0.91];Q8IXI1[0.82];O00754[0.85];P04062[0.79];P04746[0.63];Q9NTJ4[0.74];Q9NRW3[0.67]; Q6UW60[0.69];O60476[0.91]
GO:0016740 transferase activity 18% O43916[0.87];Q08188[0.81];Q5I7T1[0.67];Q9NYU2[0.92];Q8N3T1[0.71];Q9NY97[0.86];O43173[0.70]; Q8IUC8[0.70]
GO:0005515 protein binding 18% Q9UDY4[0.79];O75509[0.63];P13866[0.75];Q8IXI1[0.82];O75096[0.61];P13667[0.87];P06126[0.82]; P43626[0.66]
GO:0051082 unfolded protein binding
11% Q9UDY4[0.79];Q9NYU2[0.92];O14967[0.87];O14657[0.61];O60884[0.79]
Illustrations:
[1] Rate denotes that the cluster of interacting human proteins possessing the same corresponding GO term accounts for the total predicted env_gp160-interacting human proteins;
classis largely ignored. For 2-class classification,predictive balanceis an important aspect of model performance. Highly biased predictions are not reliable. From the point of view of biomedical
research, true protein-protein non-interaction (i.e.true negative) also
provides much insight into functional proteomics and drug
research. Hence we also report SP, SE, MCC and Accuracy for
comprehensive survey of model performance. As shown in Table 1, PWEN-TLM achieves goodpredictive balance in theOptimisticcase
(Acc= 85.62%, MCC= 0.7446) and in the Pessimistic case
(Acc= 80.22%, MCC= 0.6605). But PWEN-TLM shows bias
towards the positive class in the Moderate case (Acc= 66.22%,
MCC= 0.4606,positive SP= 0.6015,negative SE= 0.3631).
Compar-atively, AUC scores do not detect the bias (ROC-AUC
score = 0.8156,PR-AUCscore = 0.8172), implying that the
perfor-mance metrics of SP, SE, MCC and Accuracy are important to
model estimation. Summarizing all the performance metrics, we
can see thatPWEN-TLMperforms well in theOptimisticcase and in
thePessimisticcase. If the targetGOinformation of the test data is
available, we choose the model trained in the Optimistic case;
otherwise,we choose the model trained in thePessimisticcase.
To attenuate the noise from the homologGO information, we
explicitly investigate the importance of the three aspects of gene
ontology(molecular function,cellular component,biological process) to
HIV-human PPI prediction. As illustrated in Figure 3, the targetGO
information and the homologGO information contribute
equiv-alently to the model performance in the Optimistic case. In the
Moderatecase, the targetGOinformation unexpectedly makes less
contribution than the homologGOinformation. The result is not
surprising, because we substitute the homolog GO information
Stest
H for the missing target GO information S
test
T to derive the
weights of the target GO information. The heterogeneous
distribution between Stest
H and S
test
T unjustly decreases the
importance of the target GO information. The three aspects of
gene ontologyunexceptionally make equivalent contributions to the
model performance in all the three cases. The GO information
about cellular component does not predominate the contributions to
model performance, indicating that thenegativedata constructed by
exclusiveness of subcellular co-localized proteinsdoes not yield predictive bias as worried about.
DatasetS2similarly contains 7,672 data including 3,638positive
data and 3,638negativedata, with the exception to datasetS1that
thenegativedata are randomly sampled. TheROC curveand thePR curveare plotted in Figure 4 and Figure 5. Comparing Figure 1 with Figure 4 and Figure 2 with Figure 5, we can see that dataset
S1 achieves higher ROC-AUC score and PR-AUC score than
datasetS2for all the three cases. The highest difference of
ROC-AUCscore is 0.0495 and the highest difference ofPR-AUCscore is
0.0692. Table 2 demonstrates the performance metrics ofSP,SE,
MCCandAccuracyon datasetS2. Comparing Table 1 and Table 2,
we can see that dataset S1demonstrates much better predictive
balance than datasetS2, with highestMCCdifference 0.1053. The
results demonstrate thatexclusiveness of subcellular co-localized proteins is
Table 5.Predicted interactions between Rev and human proteins.
GO
category Predicted interacting human partners
GO term GO description Rate Main cluster of interacting human partners Biological
process
GO:0010467 gene expression 14% Q9P2I0[0.87];P46781[0.90];P62899[0.90];Q9Y3U8[0.86];P62280[0.82]
GO:0019083 viral transcription 11% P46781[0.90];P62899[0.90];Q9Y3U8[0.86];P62280[0.82]
GO:0016071 mRNA metabolic
process
11% P46781[0.90];P62899[0.90];Q9Y3U8[0.86];P62280[0.82]
GO:0016032 viral reproduction 11% P46781[0.90];P62899[0.90];Q9Y3U8[0.86];P62280[0.82]
GO:0006355 regulation of
transcription, DNA-dependent
11% Q9NRC8[0.61];O00472[0.60];Q92925[0.64];Q13342[0.65]
GO:0006413 translational
initiation
11% P46781[0.90];P62899[0.90];Q9Y3U8[0.86];P62280[0.82]
GO:0006414 translational
elongation
11% P46781[0.90];P62899[0.90];Q9Y3U8[0.86];P62280[0.82]
Cellular component
O:0005634 nucleus 41% Q9H1A4[0.69];Q9P2I0[0.87];Q99877[0.82];Q8IX01[0.62];Q8WWL7[0.70]; Q9NRC8[0.61];O00472[0.60];Q9NYP9[0.66];Q92925[0.64];Q9H668[0.66]; Q13342[0.65];Q15003[0.67];Q8NDV3[0.74];Q13601[0.76];O15523[0.63]
GO:0005737 cytoplasm 38% Q96C10[0.74];P09972[0.63];Q9UBB4[0.76];Q08188[0.68];P46781[0.90]; Q06210[0.70];Q01650[0.75];Q9NRC8[0.61];Q9NYP9[0.66];Q9Y3U8[0.86]; Q13342[0.65];Q15003[0.67];Q13601[0.76];O15523[0.63]
GO:0005829 cytosol 30% Q9H1A4[0.69];P09972[0.63];Q9UBB4[0.76];Q8IXI1[0.72];P46781[0.90]; Q06210[0.70];Q01650[0.75];P62899[0.90];Q9Y3U8[0.86];Q9BU89[0.66]; P62280[0.82]
GO:0005730 nucleolus 22% P46781[0.90];Q8WWL7[0.70];Q9NRC8[0.61];O00472[0.60];Q9H668[0.66]; Q9Y3U8[0.86];Q13342[0.65];Q13601[0.76]
Molecular function
GO:0005515 protein binding 35% Q96C10[0.74];P09972[0.63];Q9UBB4[0.76];
P13866[0.64];Q9P2I0[0.87];Q8IXI1[0.72];P46781[0.90];Q8WWL7[0.70];Q9NRC8[0.61];P06126[0.70];Q9H668[0.66];Q15003[0.67];Q9BU89[0.66]GO:0003723RNA binding24%Q96C10[0.74];Q9P2I0[0.87];Q9Y6V7[0.63];P46781[0.90];Q8IX01[0.62];P62899[0.90];Q13601[0.76];P62280[0.82];O15523[0.63]GO:0003677DNA binding16%96C10[0.74];Q99877[0.82];Q9H668[0.66];Q13342[0.65];Q8NDV3[0.74];O15523[0.63]
more reliable to construct a reliable and unbiased classifier than random sampling.
The weight distribution for the three aspects ofgene ontology is
illustrated in Figure 6. Comparing Figure 3 with Figure 6, we can see that there is little difference of weight distribution between
datasetS1and datasetS2.
Independent test performance evaluation. The
HIV-human PPI database [18] is catalogued into 9 categories (539 Env PPIs, 487 Gag PPIs, 349 Nef PPIs, 272 Pol PPIs, 278 Rev PPIs, 1,101 Tat PPIs, 126 Vif PPIs, 338 Vpr PPIs and 148 Vpu PPIs). To evaluate the generalization ability, we simply use one catalog of PPI (e.g. Env PPI) as independent test set and other catalogs of PPIs (e.g. Gag, Nef, Pol, Rev, Tat, Vif, Vpr, Vpu) are
merged together aspositivetraining set. The correspondingnegative
training set is derived for each catalog of HIV protein with the
constraints: (1) thenegativePPIs and thepositivePPIs are of the same
size; (2) the human proteins that are subcellularco-localizedwith the
HIV proteins are excluded; (3) the human proteins are randomly sampled. Constraint (2) is based on the above experimental
conclusion that exclusiveness of subcellular co-localized proteins yields
unbiased and better performance. We don’t conduct independent
test for theModeratecase because of its poor performance in the
cross validation performance evaluation.
The experimental results of the independent test are shown in
Table 3. We can see thatPWEN-TLMcan recognize most catalogs
of HIV-human PPIs with highrecall rateexcept one small Pol PPIs
(272 PPIs,Optimistic51.84%,Pessimistic54.04%) and one large Tat
PPIs (1,101 PPIs, Optimistic 52.04%, Pessimistic 55.77%). As
compared to the generally small overlap between experimental host-pathogen PPIs and predicted host-pathogen PPIs, e.g. 10% overlap between siRNA screen and predictions [7] and 5.29%
recall rate (57 PPIs were computationally recognized out of the 1,078 experimental PPIs) [10], the results are considerably
promising. From the results, we also see that the Optimisticcase
is unsurprisingly better than thePessimisticcase, because the target
GOinformation is available. Nevertheless,PWEN-TLMstill works
well in thePessimisticcase. The independent test again validates the
assumption that the homologGOinformation alone is sufficient to
train a satisfactory HIV-human PPI classifier.
Novel PPI Prediction
Overlap analysis of predicted interactions between
PWEN-TLM and the existing models. Overlap analysis of predicted interactions between different computational models is of significance to reveal the confidence and complementariness of predictions. In this work, we investigate the overlap of predictions
betweenPWEN-TLMand the latestbi-clusteringmethod [20], for
the reason thatbi-clusteringhas found several supporting evidences
from the recent literature. In bi-clusteringmethod, there are 180
predicted interactions, among which there are 80 interactions overlapped with the work [6]. As pointed out in the work [20], some predicted interactions have been validated by the recent literatures, e.g. env_gp120:CASP8[83.33%] [35], env_gp120: CD86[83.33%] [36], env_gp120: NOS3[74.67%] [37], env_ gp120:SOD2[88.89%] [38,], env_gp120:SRC[78%] [39], en-v_gp41:MAPK1[77.78%] [40], Gag_Pr55:MAPK1[71.43%] [41], Tat:TNFSF[86.30%]) [42]. The square bracketed percentage follow-ing the protein pair denotes the confidence level of predictions.
We apply PWEN-TLM to validate the 180 predicted
interac-tions for overlap analysis. Among the HIV-1 proteins, the protein
env_gp120 (Envelope surface glycoprotein gp120, NP_579894.2) has no
reviewed entry in the UniprotKB database (http://www.uniprot.
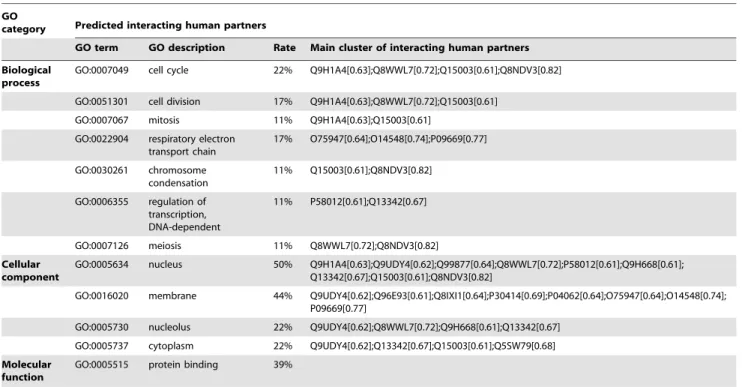
Table 6.Predicted interactions between Vpr and human proteins.
GO
category Predicted interacting human partners
GO term GO description Rate Main cluster of interacting human partners Biological
process
GO:0007049 cell cycle 22% Q9H1A4[0.63];Q8WWL7[0.72];Q15003[0.61];Q8NDV3[0.82]
GO:0051301 cell division 17% Q9H1A4[0.63];Q8WWL7[0.72];Q15003[0.61]
GO:0007067 mitosis 11% Q9H1A4[0.63];Q15003[0.61]
GO:0022904 respiratory electron transport chain
17% O75947[0.64];O14548[0.74];P09669[0.77]
GO:0030261 chromosome condensation
11% Q15003[0.61];Q8NDV3[0.82]
GO:0006355 regulation of transcription, DNA-dependent
11% P58012[0.61];Q13342[0.67]
GO:0007126 meiosis 11% Q8WWL7[0.72];Q8NDV3[0.82]
Cellular component
GO:0005634 nucleus 50% Q9H1A4[0.63];Q9UDY4[0.62];Q99877[0.64];Q8WWL7[0.72];P58012[0.61];Q9H668[0.61]; Q13342[0.67];Q15003[0.61];Q8NDV3[0.82]
GO:0016020 membrane 44% Q9UDY4[0.62];Q96E93[0.61];Q8IXI1[0.64];P30414[0.69];P04062[0.64];O75947[0.64];O14548[0.74]; P09669[0.77]
GO:0005730 nucleolus 22% Q9UDY4[0.62];Q8WWL7[0.72];Q9H668[0.61];Q13342[0.67]
GO:0005737 cytoplasm 22% Q9UDY4[0.62];Q13342[0.67];Q15003[0.61];Q5SW79[0.68]
Molecular function
GO:0005515 protein binding 39%
Q9UDY4[0.62];Q8IXI1[0.64];Q8WWL7[0.72];P58012[0.61];Q9H668[0.61];Q15003[0.61];Q5SW79[0.68]GO:0003677DNA binding28%Q99877[0.64];P58012[0.61];Q9H668[0.61];Q13342[0.67];Q8NDV3[0.82]GO:0003700sequence-specific DNA binding transcription
factor activity11%P58012[0.61];Q13342[0.67]
org/uniprot/). The targetGOinformation of protein env_gp120 can not be retrieved from the database and thus is treated as novel protein in our model. For reliable training, env_gp120 is not
included in the training data. Thus the training data ismore stringent
than that ofbi-clusteringmethod, because it contains no interaction
patterns between env_gp120 and human proteins. The 180
interactions predicted by bi-clustering method are treated as test
data without overlap with the training data.
The experimental results show thatPWEN-TLM predicts 132
interactions in theOptimistic case(File S1) and 165 interactions in
thePessimistic case(File S2). Comparing the results of the two cases,
we find that PWEN-TLM can not recognize most env_gp120
interactions in the Optimistic case, but PWEN-TLM behaves
contrarily very well in the Pessimistic case. The results are not
surprising because the unreviewed env_gp120 is treated as novel
protein (the targetGOinformation is treated asnulland only the
homolog GO information takes effect). In the Pessimistic case,
PWEN-TLMcorrectly recognizes all the literature-validated
inter-actions (env_gp120:CASP8[81.63%];env_gp120:CD86[83.51%];
env_gp120:NOS3[84.34%];env_gp120:SOD2[70.78%];env_gp120: SRC[79.54%];env_gp41:MAPK1[89.88%];Tat:TNFSF[90.90%]) ex-cept Gag_Pr55:MAPK1 [20]. The results once again validate our
model assumption that the homologGOinformation can be effectively
exploited to compensate for data scarcityanddata unavailability. Especially,
we can safely draw the conclusion that the homologGOinformation
alone is sufficient to train a satisfactory model for HIV-human PPI
prediction. We can see thatPWEN-TLMhas less demanding data
constraint and hardly fails to work even in the worst case (thePessimistic
case). As long asGOannotated homologs can be retrieved,
PWEN-TLM can convincingly predict the protein pairs that contain novel
proteins. It is noted that although the model is trained without
env_gp120 interaction patterns, the env_gp120-related interactions are
still soundly recognized, which implies that PWEN-TLMhas good
generalization ability.
Besides the validation of the 180 predicted interactions, we also
validate against PWEN-TLM the 80 overlapped interactions
between the two work [6,20]. The results show that
PWEN-TLMpredicts 46 interactions in theOptimistic case(File S3) and 61
interactions in thePessimistic case (File S4). From the results, we
can see thatPWEN-TLMnarrows down the predictions and thus is
relatively more conservative than the bi-clustering method [20].
Conservative prediction has the merit of lowfalse positiverate but
meanwhile has the demerit of missing some true interactions (e.g. Gag_Pr55:MAPK1). From the 8 literature-validated interactions, only one unrecognized interaction is acceptable.
Predicted interactions with peripheral human proteins. In
addition to validating the interactions predicted by the existing
models, we also independently apply PWEN-TLM to detect novel
HIV-human PPIs for further biological research. To narrow down the scope of potential HIV-targeted human proteins, we first statistically investigate the way that HIV proteins attack the human PPI network. Some diseases, like lung squamous cell carcinoma [43], are prone to attack the densely-connected human proteins (hub proteins). Here we attempt to acquire the knowledge about the behaviour that HIV-1 attacks the human PPI network. We can calculate the degree distribution of the HIV-targeted human proteins from HPRD database (http://hprd.org/) [44]. The degree distribution of the HIV-targeted human proteins in human PPI network is plotted in
Figure 7, where thehorizontal axisdenotes the protein degree and the
vertical axis denotes the number of proteins possessing that degree. From Figure 7, we can intuitively see that the number of HIV-targeted human proteins exponentially decreases with protein degree. It can be inferred from the figure that the HIV proteins are prone to target the peripheral human proteins. For the sake, we choose the peripheral
human proteins as test candidates. For each type of HIV proteins, we
randomly choose 400distinct human proteins with lowest degree(e.g.
degree = 1, 2, 3) that do not occur in datasetS1. The predicted results
are shown in File S5 (Optimistic case) and File S6 (Pessimistic case). Since
literature could offer very sparse direct information about the interactions we are concerned about, we analyse the predicted
interactions based on the study ofgene ontology.
Interactions with env_gp160. Among the 400 human
proteins, PWEN-TLM predicts 64 interactions with env_gp160
(P04578) in theOptimistic case(File S5) and 66 interactions in the
Pessimistic case (File S6). After filtering the weak interactions (probability within [0.5, 0.6]), there are 44 interactions in the Pessimistic caseand 45 interactions in the Optimistic case. Take the Optimistic casefor example, Table 4 clusters the interacting human
partners according toGOterms (see Table 4Main cluster of interacting
human partners). From Table 4, we can see that env_gp160 mainly
interacts with the host membrane proteins (GO:0016020,
GO:0016021, GO:0005886), and the interacting human partners
are mainly involved in the biological processes of metabolic process
(GO:0044267), post-translational modification (GO:0043687, GO:0006486), transport (GO:0006810), host immune response (GO:0006954, GO:0045087), etc. From the aspect of molecular functions, env_gp160 mainly affects host protein binding activity (GO:0005515), transferase activity (GO:0016740), etc. From the
analysis of gene ontology, we can see that the interactions with
env_gp120 may affect themetabolic process, molecule transfer,binding
activityof the host proteins and may also activate thehost immune response.
Interactions with Rev. Among the 400 human proteins,
PWEN-TLM predicts 37 interactions with Rev (P04618) in the Optimistic caseand 54 interactions in the Pessimistic case
(probabil-ity.0.6). From Table 5, we can see that Rev mainly interacts with
the host nucleus proteins (GO:0005634) and cytoplasm proteins
(GO:0005737), and participates in the biological processes of viral reproduction(GO:0010467, GO:0019083, GO:0016032, GO:0006355), viral mRNA translation (GO:0016071, GO:0006413, GO:0006414), etc. These predicted interactions indicate that Rev plays important
roles inviral mRNA transcriptionandmRNA translation into viral proteins.
Interactions with Vpr. Similarly, the predicted interactions
with Vpr (Q77YF9) are shown in Table 6 (18 predicted interactions with probability greater than 0.6). From the results
we can see that Vpr mainly affects thehost cell cycle(GO:0007049,
GO:0051301, GO:0007067, GO:0030261, GO:0007126) and the regulation of DNA transcription(GO:0006355). The predicted interac-tions are consistent with our prior knowledge about HIV-1 Vpr proteins.
Interactions with other HIV-1 proteins. The predicted
interactions with other HIV-1 proteins (Gag, Pol, Tat, Vpu, Nef,
Vif) are shown inFile S5andFile S6. The experimental results
show that Gag mainly interacts with the human proteins that
participate in the biological processes of signal transduction
(GO:0007165, the interacting partners include O75509[0.67]; Q9NYK1[0.69]; Q9NY25[0.63]; O60609[0.61]), innate immune re-sponse (GO:0045087, Q96E93[0.64]; Q9NYK1[0.69]; Q9NY25 [0.63]),apoptotic process(GO:0006915, P09972[0.67];O75509[0.67]; Q8IXI1[0.81]), etc. Tat mainly affects the regulation of transcription (GO:0006355, Q9NRC8[0.67]; O00472[0.74]; Q92925[0.72]; Q13342[0.80]),host cell defense response to virus(GO:0051607, Q96C10 [0.67]; Q9NYK1[0.70]; Q9NRW3[0.69]), etc. Vpu mainly interacts
with the human proteins oftransport activity(GO:0006810, P13866
Discussion
Data scarcity, data unavailability and negative data samplingare the three major concerns to be addressed for the computational reconstruction of HIV-human PPI networks. At present feature-level data integration is still the major effective method to
compensate for data scarcity, but potential unavailability of some
feature information is likely to make the existing data integration methods fail to work. In this work, we are motivated to develop a less data-demanding computational model for HIV-human PPI prediction that hardly fails to work in most cases. We investigate
the assumption that the homologGOinformation is useful to well
tackle the problems ofdata scarcityanddata unavailability. To fulfil
the motivation and assumption, we propose a probability weighted ensemble transfer learning model for HIV-human PPI prediction (PWEN-TLM). In this model, gene ontology is the only feature information used for model training and model evaluation. The
target GO information and the homolog GO information are
separately extracted to cope withdata unavailability, and the three
aspects of gene ontology are further separated to evaluate their
contributions to the model performance. The contributions are
measured in terms of weights byROC-AUCperformance metric of
the individual classifiers. The weights of the homolog GO
information play the role of enhancing positive knowledge transfer
and depressingnegative knowledge transfer.
To validate the assumption that the homologGOinformation is
effective to enrich or substitute for the targetGOinformation, we
conduct three experimental settings, namely theOptimisticcase, the
Moderatecase and thePessimisticcase. The latter two cases take into
account the unavailability of the target GO information. 3-fold
cross validation and independent test are used to evaluate the model performance. The performance measured by multiple
metrics (ROC-AUC,PR-AUC,MCC,SP,SEandAccuracy) show that
PWEN-TLM performs well in the Optimistic case and in the Pessimistic case. The sound performance in the Optimistic case
demonstrates that the homologGOinformation is useful to solve
the problem ofdata scarcityby enriching the targetGOinformation.
The good performance in the Pessimistic case shows that the
homologGOinformation is an effective substitute for the targetGO
information to solve the problem ofdata unavailability.
Negative data sampling is another important concern to be addressed for HIV-human PPI prediction. In this work, we have
comparedexclusiveness of subcellular co-localizationtorandom sampling.
We find that theGO information about cellular components makes
equivalent contributions to the model performance as the GO
information about biological processes and molecular functions does.
This result shows that exclusiveness of subcellular co-localized proteins
outperformsrandom samplingwithout introducing model bias.
Lastly, we apply PWEN-TLM to novel HIV-human PPIs
detection. The overlap analysis of the predictions between PWEN-TLMand the existing models show thatPWEN-TLMcan recognize most of the literature-validated interactions and is
relatively more conservative than thebi-clusteringmethod. We also
report some novel interactions for further biological research. The
analysis based on gene ontologyshows that the information revealed
by the predicted interactions is consistent with our prior knowledge about the HIV-1 proteins.
Supporting Information
File S1 Text file contains the overlapped predictions
between PWEN-TLM and Bi-clustering [20] (Optimistic case).
(TXT)
File S2 Text file contains the overlapped predictions
betweenPWEN-TLMandBi-clustering [20](Pessimistic case).
(TXT)
File S3 Text file contains the overlapped predictions
amongPWEN-TLM,Bi-clustering[20]and the method[6] (Optimistic case).
(TXT)
File S4 Text file contains the overlapped predictions
amongPWEN-TLM,Bi-clustering[20]and the method[6] (Pessimistic case).
(TXT)
File S5 Text file contains the predictions between HIV-1
and peripheral human proteins (Optimistic case). (TXT)
File S6 Text file contains the predictions between HIV-1
and peripheral human proteins (Pessimistic case). (TXT)
Acknowledgments
Thanks for the helpful comments from the anonymous reviewers.
Author Contributions
Conceived and designed the experiments: SM. Performed the experiments: SM. Analyzed the data: SM. Contributed reagents/materials/analysis tools: SM. Wrote the paper: SM.
References
1. von Mering C, Krause R, Snel B, Cornell M, Oliver SG, et al. (2002) Comparative assessment of large-scale datasets of protein-protein interactions. Nature 417: 399–403.
2. Edwards A, Kus B, Jansen R, Greenbaum D, Greenblatt J, et al. (2002) Bridging structural biology and genomics: assessing protein interaction data with known complexes. Trends Genet 18: 529–536.
3. Wu X, Zhu L, Guo J, Zhang D, Lin K (2006) Prediction of yeast protein-protein interaction network: insights from the Gene Ontology and annotations. Nucleic Acids Res 34: 2137–2150.
4. DeBodt S, Proost S, Vandepoele K, Rouze´ P, Peer Y, et al. (2009) Predicting protein-protein interactions in Arabidopsis thaliana through integration of orthology, gene ontology and co-expression. BMC Genomics 10: 288. 5. Shen J, Zhang J, Luo X, Zhu W, Yu K, et al. (2007) Predicting protein–protein
interactions based only on sequences information. Proc Natl Acad Sci U S A 104: 4337–41.
6. Tastan O, Qi Y, Carbonell J, Klein-Seetharaman J (2009) Prediction of interactions between HIV- 1 and human proteins by information integration. In: Proceedings of the Pacific Symposium on Biocomputing (PSB-2009). 516–527.
7. Qi Y, Tastan O, Carbone J, Klein-Seetharaman, Weston J, et al. (2010) Semi-supervised multi-task learning for predicting interactions between HIV-1 and human proteins. Bioinformatics 26: i645–i652.
8. Dyer M, Muralib T, Sobrala B (2011) Supervised learning and prediction of physical interactions between human and HIV proteins. Infect Genet Evol 11: 917–923.
9. Dyer M, Murali T, Sobral B (2007) Computational prediction of host-pathogen protein-protein interactions. Bioinformatics 23: i159-i166.
10. Wuchty S (2011) Computational Prediction of Host-Parasite Protein Interactions between P. falciparum and H. sapiens. PLoS ONE 6: e26960.
11. Miller J, Lo RS, Ben-Hur A, Desmarais C, Stagljar I, et al. (2005) Large-scale identification of yeast integral membrane protein interactions. Proc Natl Acad Sci U S A 102: 12123–12128.
13. Patil A, Nakamura H (2005) Filtering high-throughput protein-protein interaction data using a combination of genomic features. BMC Bioinformatics
6: 100.
14. Maetschke S, Simonsen M, Davis M, Ragan MA (2012) Gene Ontology-driven inference of protein–protein interactions using inducers. Bioinformatics 28: 69– 75.
15. Qi Y, Bar-Joseph Z, Klein-Seetharaman J (2006) Evaluation of different biological data and computational methods for use in protein interaction prediction. Proteins 63: 490–500.
16. Tirosh I, Barkai N (2005) Computational verification of protein-protein interactions by orthologous co-expression. BMC Bioinformatics 6: 40. 17. Yu H, Luscombe N, Lu H, Zhu X, Xia Y, et al. (2004) Annotation transfer
between genomes: Protein-protein interologs and protein-dna regulogs. Genome Res 1: 1107–18.
18. Doolittle J, Gomez S (2010) Structural similarity-based predictions of protein interactions between HIV-1 and Homo sapiens. Virology J 7: 82.
19. Yu J, Guo M, Needham C, Huang Y, Cai L, et al. (2010) Simple sequence-based kernels do not predict protein-protein interactions. Bioinformatics 26: 2610– 2614.
20. Mukhopadhyay A, Maulik U, Bandyopadhyay S (2012) A Novel Biclustering Approach to Association Rule Mining for Predicting HIV-1–Human Protein Interactions. PLoS One 7: e32289.
21. Fu W, Sanders-Beer BE, Katz KS, Maglott DR, Pruitt KD, et al. (2009) Human immunodeficiency virus type 1, human protein interaction database at NCBI. Nucleic Acids Res (Database Issue) 37: D417–22.
22. Pan S, Yang Q (2010) A Survey on Transfer Learning. IEEE Transactions on Knowledge and Data Engineering 22: 1345–1359.
23. Tu Y, Tolovitzky G, Klein U (2002) Quantitative noise analysis for gene expression microarray experiments. Proc Natl Acad Sci U S A 99: 14031–14036. 24. Mei S, Wang F, Zhou S (2011) Gene ontology based transfer learning for protein
subcellular localization. BMC Bioinformatics 12: 44.
25. Mei S (2012) Multi-kernel transfer learning based on Chou’s PseAAC formulation for protein submitochondria localization. J Theor Biol 293: 121– 130.
26. Mei S (2012) Multi-label Multi-kernel Transfer Learning for Human Protein Subcellular Localization. PLoS One 7: e37716.
27. Boeckmann B, Bairoch A, Apweiler R, Blatter MC, Estreicher A, et al. (2003). The SWISS-PROT Protein Knowledgebase and Its Supplement TrEMBL. Nucleic Acids Res 31: 365–370.
28. Altschul S, Madden T, Schaffer A, Zhang J, Zhang Z, et al. (1997) Gapped BLAST and PSI-BLAST: A New Generation of Protein Database Search Programs. Nucleic Acids Res 25: 3389–3402.
29. Barrell D, Dimmer E, Huntley R, Binns D, O’Donovan C, et al. (2009) The GOA database in 2009–an integrated Gene Ontology Annotation resource. Nucleic Acids Res (Database Issue) 37: D396–D403.
30. Dong J, Adam K, Ching Y (2005) Fast SVM Training Algorithm with Decomposition on Very Large Data Sets. IEEE Trans Pattern Anal Mach Intell 27: 603–18.
31. Platt J (1999) Probabilistic outputs for support vector machines and comparison to regularized likelihood methods. In Advances in Large Margin Classifiers. MIT Press.
32. Faraggi D, Reiser B (2002) Estimation of the area under the ROC curve. Stat Med 21: 3093–106.
33. Ben-Hur A, Noble W (2006) Choosing negative examples for the prediction of protein-protein interactions. BMC Bioinformatics 7: S2.
34. Davis J, Goadrich M (2006) The relationship between precision-recall and ROC curves. In: Proceedings of the 23rd International Conference on Machine Learning.
35. Vashistha H, Husain M, Kumar D, Singhal PC (2009) Tubular cell HIV-1 gp120 expression induces caspase 8 activation and apoptosis. Ren Fail 31: 303– 312.
36. Wang X, Chen DG (2009) Recombinant murine cytomegalovirus vector activates human monocytederived dendritic cells in a NF-kappaB dependent pathway. Mol Immunol 46: 3462–3465.
37. Jiang J, Fu W, Wang X, Lin PH, Yao Q, et al. (2010) HIV gp120 induces endothelial dysfunction in tumour necrosis factor-alpha-activated porcine and human endothelial cells. Cardiovasc Res 87: 366–374.
38. Saha RN, Pahan K (2007) Differential regulation of Mn-superoxide dismutase in neurons and astroglia by HIV-1 gp120: Implications for HIV-associated dementia. Free Radic Biol Med 42: 1866–1878.
39. Cheung R, Ravyn V, Wang L, Ptasznik A, Collman RG (2008) Signaling mechanism of HIV-1 gp120 and virion-induced IL-1beta release in primary human macrophages. J Immunol 180: 6675–6684.
40. Zhou C, Lu L, Tan S, Jiang S, Chen YH (2011) HIV-1 Glycoprotein 41 Ectodomain Induces Activation of the CD74 Protein-mediated Extracellular Signal-regulated Kinase/Mitogen-activated Protein Kinase Pathway to Enhance Viral Infection. J Biol Chem 286: 44869–44877.
41. Gupta P, Singhal PK, Rajendrakumar P, Padwad Y, Tendulkar AV, et al. (2011) Mechanism of host cell MAPK/ERK-2 incorporation into lentivirus parti-cles:characterization of the interaction between MAPK/ERK-2 and proline-richdomain containing capsid region of structural protein Gag. J Mol Biol 410: 681–697.
42. Gibellini D, De Crignis E, Ponti C, Borderi M, Clo A, et al. (2010) HIV-1 Tat protein enhances RANKL/M-CSF-mediated osteoclast differentiation. Biochem Biophys Res Commun 401: 429–434.
43. Vidal M, Cusick M, Baraba´si A (2011) Interactome Networks and Human Disease. Cell 144: 986–98.