www.ann-geophys.net/25/2053/2007/ © European Geosciences Union 2007
Annales
Geophysicae
The driving mechanisms of particle precipitation during the
moderate geomagnetic storm of 7 January 2005
N. Longden1, F. Honary1, A. J. Kavanagh1, and J. Manninen2
1Department of Communication Systems, Lancaster University, UK 2Sodankyl¨a Geophysical Observatory, Sodankyl¨a, Finland
Received: 29 March 2007 – Revised: 20 July 2007 – Accepted: 18 September 2007 – Published: 2 October 2007
Abstract.The arrival of an interplanetary coronal mass ejec-tion (ICME) triggered a sudden storm commencement (SSC) at∼09:22 UT on the 7 January 2005. The ICME followed a quiet period in the solar wind and interplanetary magnetic field (IMF). We present global scale observations of ener-getic electron precipitation during the moderate geomagnetic storm driven by the ICME. Energetic electron precipitation is inferred from increases in cosmic noise absorption (CNA) recorded by stations in the Global Riometer Array (GLO-RIA). No evidence of CNA was observed during the first four hours of passage of the ICME or following the sud-den commencement (SC) of the storm. This is consistent with the findings of Osepian and Kirkwood (2004) that SCs will only trigger precipitation during periods of geomagnetic activity or when the magnetic perturbation in the magneto-sphere is substantial. CNA was only observed following en-hanced coupling between the IMF and the magnetosphere, resulting from southward oriented IMF. Precipitation was ob-served due to substorm activity, as a result of the initial in-jection and particles drifting from the inin-jection region. Dur-ing the recovery phase of the storm, when substorm activity diminished, precipitation due to density driven increases in the solar wind dynamic pressure (Pdyn) were identified. A
number of increases inPdynwere shown to drive sudden
im-pulses (SIs) in the geomagnetic field. While many of these SIs appear coincident with CNA, SIs without CNA were also observed. During this period, the threshold of geomagnetic activity required for SC driven precipitation was exceeded. This implies that solar wind density driven SIs occurring dur-ing storm recovery can drive a different response in particle precipitation to typical SCs.
Keywords. Ionosphere (Particle precipitation) – Magne-tospheric physics (Solar wind-magnetosphere interaction; Storms and substorms)
Correspondence to:N. Longden (n.longden@lancs.ac.uk)
1 Introduction
Riometers enable the investigation of precipitation of ener-getic electrons into the D-region of the ionosphere through measurement of the absorption of cosmic noise (CNA).
One mechanism for the enhancement of precipitation in the auroral zones is the compression of the magnetosphere as a result of an increase in the dynamic pressure (Pdyn) of the
solar wind (Brown et al., 1961). Compression of the mag-netosphere results in the stimulation of VLF waves, which in turn drive the pitch-angle diffusion necessary for trapped particles to precipitate into the ionosphere (Perona, 1972). Magnetospheric compression can be observed as an impul-sive perturbation in the horizontal component of the geo-magnetic field measured on the ground; i.e. a sudden com-mencement (SC). When followed by a geomagnetic storm, the event is termed a sudden storm commencement (SSC), and when not a sudden impulse (SI). Conversely, when the solar wind pressure decreases the magnetosphere can expe-rience rapid expansion. The signature of expansion is a neg-ative sudden impulse (SI−) in the horizontal component of
the geomagnetic field measured at mid to low latitudes (e.g. Takeuchi et al., 2002).
Precipitation driven by a SC can be observed by riome-ters as short-lived CNA coincident with the onset of the SC, known as Sudden Commencement Absorption (SCA) (Brown et al., 1961). CNA observed following an SI is termed Sudden Impulse Absorption (SIA). When observed, SCA and SIA exhibit a geomagnetic latitude and local time dependency, with probability of occurrence maximis-ing around local noon between 65◦
and 70◦
magnetic impulse exceeded a threshold of around 30 nT. In their study, SCA was evident during active periods irrespec-tive of the local time of the observing riometer. However, at quiet times, the local time sector altered the threshold of magnetic field perturbation required for SCA to occur, with a greater perturbation required for SCA in the local afternoon than local morning.
Magnetospheric compression has been linked to substorm processes, such as reducing the period of southward IMF re-quired for substorm activity to occur (Burch, 1972) and the triggering of substorms (Brown, 1978). Precipitation due to substorms has been linked to a number of forms of CNA (e.g. Stauning, 1996, and references therein), including CNA around local midnight, presumably close to the injection re-gion of the substorm, and in the morning sector, due to the drift of injected electrons.
Interplanetary Coronal Mass Ejections (ICME) are the interplanetary (IP) counterpart of Coronal Mass Ejections (CME). When earthward directed, ICMEs are known to drive geomagnetic storms with levels of activity ranging from the most intense storms observed (Richardson et al., 2001) to rel-ative inactivity (Gosling et al., 1991). Taylor et al. (1994) have shown that ICMEs are the most likely drivers for SSC events.
In this paper we study the global-scale effects on particle precipitation of a moderate geomagnetic storm triggered by an ICME that collided with the magnetosphere on 7 January 2005 and consider the effects in the context of the survey of SSC-related absorption by Osepian and Kirkwood (2004). The ICME followed a period of low activity in both the so-lar wind and magnetosphere indicating little energy coupling into the system. The storm developed over the course of two days and exhibited at least two periods of substorm activity, observed by the Los Alamos National Laboratory (LANL) satellites at geosynchronous orbit. The recovery phase of the storm on the 8 January 2005 was accompanied by a num-ber of solar wind density-driven sudden impulses that led to precipitation confined mostly to the dayside magnetosphere. There was an advantageous configuration of riometers with coverage of both magnetic noon and midnight at the time of the sudden commencement and during a good portion of the recovery phase of the storm making this an interesting case study on the effects of an ICME on energetic electron precip-itation on global scales.
2 Instrumentation
Observations of the solar wind and IMF during the event are taken from the ACE satellite, in orbit around the L1 point, and the Geotail satellite. During this event, Geotail was lo-cated off the dawn flank moving towards noon close to the Earth. The solar wind velocities and magnetic structure served by the ACE satellite are consistent with those ob-served by Geotail, indicating that Geotail is located outside
the bow shock and magnetosphere, directly in the solar wind throughout this event. The IMF data are obtained from the ACE magnetic fields experiment (MAG) instrument (Smith et al., 1998) and the Geotail Magnetic Field Measurement (MGF) instrument (Kokubun et al., 1994). The ACE solar wind data are obtained from the Solar Wind Electron Pro-ton Alpha Monitor (SWEPAM) instrument (McComas et al., 1998) and the Geotail solar wind data are obtained from the Comprehensive Plasma Instrument (CPI) (Frank et al., 1994).
The global scale effects of the ICME in the ionosphere were investigated using two riometer chains; the NORSTAR riometer chain (formerly CANOPUS), covering CANADA, and the SGO riometer chain in Fennoscandia. Data from the central beam (beam 25) of the imaging riometer (IRIS) located at Kilpisj¨arvi was also used. These riometers are detailed in Table 1 and form part of the GLORIA project (Global Riometer Array). Magnetic latitudes are given in the Corrected Geomagnetic (CGM) coordinate system using the International Geomagnetic Reference Field (IGRF) model for 2005 (e.g. Maus et al., 2005). GLORIA aims to link the data from riometers located throughout the Northern and Southern Hemispheres to enable investigation of the effect of electron precipitation simultaneously across the globe. Small errors in the calculation of the quiet day curves for the riome-ters at Abisko and Rovaniemi could result in errors of the ab-solute magnitude of CNA of the order of 0.1 to 0.2 dB during this event.
The geomagnetic field local to the riometers was inves-tigated using data from ground based magnetometers. The IMAGE magnetometer chain is located close to the SGO chain of riometers and the CARISMA magnetometer chain (formerly CANOPUS) is located close to the NORSTAR ri-ometers. Three of the magnetometer stations used are not located in the region of one of the riometers detailed in Ta-ble 1. These are at Muonio (station code MUO), Rørvik (tion code RVK) and Ouluj¨arvi (sta(tion code OUJ). These sta-tions have a geographic latitude and longitude of 68.02◦
N, 23.53◦
E, 64.94◦
N, 10.98◦
E and 64.52◦
N, 27.23◦
E respec-tively. Pi2 pulsations were investigating using the lowest lat-itude CARISMA station (Pinawa) and the York magnetome-ter (station code YOR) from the SAMNET magnetomemagnetome-ter chain, located at 53.95◦
N, 1.05◦
W (geographic).
Geosynchronous particle flux intensity measurements are taken from the Synchronous Orbit Particle Analyzer (SOPA) instrument (Belian et al., 1992) on board the LANL satel-lites. At the time of the ICME, data was available from five LANL satellites with SOPA instrumentation; 084, 095, 97A, 01A and 02A. These satellites were located at geographic longitudes of 166.13◦
W, 38.54◦
W, 145.36◦
E, 8.16◦
E and 69.30◦
3 Observations of the ICME in the solar wind
At approximately 08:42 UT on the 7 January 2005, the signa-ture of an ICME was first observed in the solar wind and IMF data from the ACE satellite at the L1 point. Figure 2 shows the solar wind and IMF data observed by ACE and Geotail on the 7 and 8 January 2005. Panels (a) to (c) show the IMF total magnetic field strength, the magnetic field strength component in the Y direction GSM (East-West), and the magnetic field strength component in the Z direction GSM (North-South), respectively. Panels (d) and (e) give the solar wind velocity in the X direction GSM and the proton num-ber density in the solar wind from both satellites. Panel (f) displays the solar wind dynamic pressure from Geotail only and panel (g) shows the ratio between the helium alpha num-ber density and the proton numnum-ber density in the solar wind from ACE only. The ICME arrival was evident at Geotail at ∼09:24 UT, indicated by the vertical line on Fig. 2. Solar wind conditions returned to ambient levels by the 9 January 2005.
Comparison of the IMF data from ACE and Geotail indi-cates a consistent magnetic structure in the solar wind. The best cross-correlation between the datasets of the satellites is achieved when the ACE data are delayed by∼42.6 min. The ACE data given in Fig. 2 has been shifted in time by this amount. This value is close to the mean delay time be-tween the satellites of∼45 min, calculated according to their separation and the velocity of the solar wind (e.g. Khan and Cowley, 1999). The ACE solar wind data are unavailable for the period from∼20:59 UT (∼21:41 UT at Geotail) on the 7 January to∼03:11 UT (∼03:53 UT at Geotail) on the 8 January 2005 whereas the Geotail solar wind dataset is com-plete. Data from both satellites are shown as ACE provides information about the helium alpha particle content of the solar wind.
With the onset of the ICME, the solar wind velocity in-creases from approximately 500 km s−1to 600 km s−1. This
is followed by a decrease to pre-ICME levels over the du-ration of the event. The IMF exhibits two periods of extended southward orientation, the first between ∼13:38 and∼15:47 UT on the 7 January and the second between ∼21:41 UT on the 7 January and∼02:00 UT on the 8 Jan-uary. ThePdynis highly variable and elevated from ambient
levels throughout the event, during periods of both northward and southward IMF. It should be noted that thePdynis
calcu-lated for Geotail CPI assuming that the helium alpha particle number density of the solar wind is constantly 5% of the pro-ton number density. From the limited data set available from ACE SWEPAM, it can be seen that the ratio of helium al-pha number density to proton number density exceeds this for extended periods throughout the event, reaching levels of approximately 0.34. Therefore, thePdynwill at times be
un-derestimated in the Geotail data set.
4 Observations of the SSC
At ∼09:22 UT on 7 January, a global scale SC signature was identified in ground based magnetometer readings in the Northern Hemisphere, confirmed by the NOAA NGDC (National Oceanic and Atmospheric Administration National Geophysical Data Center1). The SC signature was identi-fied in mid to low latitude ground based magnetometers. The magnitude of the perturbation of the horizontal component of the geomagnetic field ranged from−4 nT to−6.6 nT at stations from the SAMNET array. The SC was initiated by the step increase in thePdyn at the start of the ICME as the
velocity of the solar wind rises sharply.
Of the ten stations that recorded the SC, four magnetome-ters recorded a class B event (defined as “Fair, ordinary but unmistakable” by the NOAA) while the six remaining mag-netometers recorded a class C event (defined as “Very poor, doubtful observation”). The magnetometers located at mag-netic latitudes of∼47◦
N and above recorded a preliminary reverse impulse (PRI) where the magnetic perturbation was observed to decrease before the main positive impulse (MI), determined as the SC* signature by Araki (1977). Below these latitudes, the standard SC signature of a positive im-pulse only was observed by the magnetometer stations. The stations at which the SC signature was observed are detailed in Table 2.
Quiet conditions were observed prior to the SC; the Kp index did not exceed a value of 0+
between 00:00 and 09:00 UT on the 7 January 2005. This suggests that the mag-netosphere was in a relatively unprimed state before the ar-rival of the ICME. We define unprimed as without sufficient trapped particles for precipitation to be identified in riometer CNA. TheKpindex on the 7 and 8 January 2005 is shown in the top panel of Fig. 3.
The SC was followed by a moderate geomagnetic storm; the definition of a moderate storm as when minimumDst falls in the range of−50 to−100 nT (Gonzalez et al., 1994) has been used. TheDst index during the 7 and 8 January 2005 is given in the second panel of Fig. 3. It should be noted thatDst is not the most appropriate index with which to identify certain types of geomagnetic activity. Fast solar wind streams, for example, cause little deflection inDst but still input significant energy to the system (e.g. Borovsky and Denton, 2006; Denton et al., 2006). However,Dst is consid-ered an appropriate index to use in the identification of ICME driven storms.
The storm develops in two phases with partial recovery between minima; Kamide et al. (1998) termed this a type 2 storm as opposed to a sharp decrease inDst and a gradual re-covery (type 1). The firstDst minimum occurs at 16:00 UT on the 7 January, with a magnitude of−46 nT. It should be
1ftp://ftp.ngdc.noaa.gov/STP/SOLAR DATA/RELATED
Table 1.GLORIA stations used in this study ordered by descending magnetic latitude.
Code Station Geographic Latitude Geographic Longitude Magnetic Latitude MLT (at 00:00 UT) L Shell
TAL Taloyoak 69.54◦N 93.56◦W 78.59◦N ∼17:19
CON Contwoyto 65.75◦N 111.26◦W 73.00◦N
∼15:43 11.86
RAN Rankin Inlet 62.82◦N 92.11◦W 72.53◦N ∼17:35 11.25
FCH Fort Churchill 58.76◦N 94.09◦W 68.62◦N
∼17:28 7.63
RAB Rabbit Lake 58.23◦N 103.68◦W 67.08◦N ∼16:37 6.68
KIL Kilpisj¨arvi 69.05◦N 20.79◦E 65.98◦N
∼02:44 6.12
DAW Dawson 64.05◦N 139.11◦W 65.92◦N ∼13:32 6.09
ABK Abisko 68.40◦N 18.90◦E 65.41◦N ∼02:31 5.86
IVA Ivalo 68.55◦N 27.28◦E 65.17◦N ∼02:59 5.75
SOD Sodankyl¨a 67.42◦N 26.39◦E 64.06◦N ∼02:53 5.30
ROV Rovaniemi 66.78◦N 25.94◦E 63.42◦N
∼02:50 5.07
OUL Oulu 65.09◦N 25.89◦E 61.69◦N ∼02:47 4.51
PIN Pinawa 50.20◦N 96.04◦W 60.24◦N
∼17:22 4.12
JYV Jyv¨askyl¨a 62.42◦N 25.28◦E 58.95◦N ∼02:40 3.81
180oW 120oW 60oW 0o 60oE 120oE 180oW
48oN 54oN 60oN 66oN 72oN 78oN
RAN TAL
FCH
PIN RAB CON DAW
SGO Chain NORSTAR Chain
01A 02A 97A
084 095
Fig. 1.Geographic location of the GLORIA stations used in this study. The geographic longitude of the five LANL satellites in orbit on the 7 January 2005 are shown in red for all riometer latitudes. Red dots indicate the approximate footprint of a geomagnetic field line mapped from the equator at 6.6REat the longitude of each of the LANL satellites. The field line mapping was performed using the Tsyganenko 89C model (Tsyganenko, 1995).
noted thatDst also reaches the value of−46 nT at 18:00 UT after a slight recovery at 17:00 UT. The secondDst mini-mum occurs at 02:00 UT on the 8 January, with a magni-tude of−96 nT. Between the two minima, theDst recovers to−34 nT at 21:00 UT on the 7 January, a recovery of 12 nT. From observations of the onset of the decline inDst prior to each minimum, it can be inferred that ring current en-hancement begins between 14:00 and 15:00 UT and again between 22:00 and 23:00 UT. As Geotail shows extended negative Bz from ∼13:38 UT until ∼15:47 UT and from ∼21:41 UT on the 7 January 2005 until∼02:00 UT on the 8 January 2005 it, therefore, seems probable in this case that the two phase development of the storm is linked to the two significant periods of southward IMF in the ICME pas-sage. Prior to the second enhancement, the storm would have been classified as small or weak, i.e.Dst>−50 nT (Gonzalez et al., 1994).
The third panel of Fig. 3 presents the SYM-H index. The SYM-H index can be considered a high-resolutionDstindex
(Wanliss and Showalter, 2006) and is derived from the hor-izontal component of the geomagnetic field recorded at six mid to low latitude ground based magnetometers. As it pro-vides one minute resolution, this index can be used to inves-tigate the effects ofPdynpulses (e.g. Takeuchi et al., 2002).
The quick look values for the upper and lower auroral elec-trojet indices (AU and AL, respectively) are given in the bot-tom two panels of Fig. 3.
Table 2.Magnetometer stations recording an SC signature at 09:22 UT on 7 January 2005, ordered by descending magnetic latitude.
Code Station Geographic Latitude Geographic Longitude Magnetic Latitude Class SC Type
LER Lerwick 60.13◦N 1.18◦W 57.92◦N B SC*
NUR Nurmij¨arvi 60.50◦N 24.65◦E 56.97◦N C SC*
ESK Eskdalemuir 55.32◦N 3.20◦W 52.57◦N B SC*
HAD Hartland 50.99◦N 4.48◦W 47.44◦N B SC*
BDV Budkov 49.08◦N 14.02◦E 44.43◦N C SC
MMB Memambetsu 43.91◦N 144.19◦E 37.26◦N C SC
SPT San Pablo Toledo 39.55◦N 4.35◦W 32.10◦N C SC
KAK Kakioka 36.23◦N 140.19◦E 29.46◦N C SC
KNY Kanoya 31.42◦N 130.88◦E 24.85◦N C SC
GUI Guima 28.32◦N 16.44◦W 13.03◦N B SC
0 10 20
Solar Wind and IMF Data: 7 to 8 January 2005
−20 0 20
−20 0 20
−550 −450
0 40 80
0 20
00 06 12 18 00 06 12 18 00
0 0.1 0.2 0.3
UT (hh)
Geotail Delayed ACE
IMF |B| (nT)
IMF By (nT)
IMF Bz (nT)
SW Vx (km/s)
SW Np (#/cc)
SW DP(nPa)
SW Na/Np
7 January 2005 8 January 2005
a
b
c
d
e
f
g ICME Onset
0 4 8
−80 −40 0
−120 −80 −40 0
−400 0 400
00 06 12 18 00 06 12 18 00
−2000 −1000 0 Kp
Geomagnetic Indices: 7 to 8 January 2005
ICME Onset
Dst (nT)
SYM−H (nT)
AU (nT)
AL (nT)
UT (hh) 7 January
2005
8 January 2005
Fig. 3. Geomagnetic indices on the 7 and 8 January 2005. From top to bottom, the panels show theKp index, theDst index, the SYM-H index, the AU index and the AL index.
data during the onset of the first period of substorm activ-ity is shown in Fig. 5a, covering the period of 14:00 UT to 15:15 UT on the 7 January 2005. From Fig. 5a, the injec-tion signature of a substorm is evident in the electron flux data of LANL-97A at∼14:12 UT. At this time, the satellite was located at an MLT of∼23:56, inside the injection re-gion. After approximately three minutes, the onset of a dis-persed injection signature of drifting electrons was observed in the electron flux of LANL-084, located at∼03:12 MLT. The dispersed signature results from electrons with different energies orbiting at different velocities away from the injec-tion region; the drift velocity of a particle is directly propor-tional to its energy (e.g. Hargreaves, 1992). Both satellites show evidence of a second enhancement in electron flux at ∼14:53 UT.
This substorm activity follows the first decrease inDst, af-ter 14:00 UT, and a southward turning of the IMF. Conditions remain disturbed following the substorm onset. Large en-hancements of electron flux are not evident after∼16:43 UT, although depletions can be seen at later times by LANL-97A and 02A.
A seemingly dispersionless injection can be seen in the electron flux intensity at LANL-02A at∼22:27 UT on 7 Jan-uary (∼02:39 MLT), indicating the onset of the second pe-riod of substorm activity at this time. The electron flux in-tensity from the LANL SOPA instruments between 22:15 UT and 23:30 UT on the 7 January 2005 are shown in Fig. 5b. This activity follows the second decrease inDst, occurring between 22:00 UT and 23:00 UT, and a period of southward IMF. This was followed by more activity at around 22:50 UT, with a seemingly dispersionless injection signature at LANL-095 (∼19:53 MLT) and 01A (∼22:59 MLT) at this time. The dispersed signature of drifting electrons is evident at LANL-02A (∼03:00 MLT). A clear injection signature can also be seen at LANL-095 at ∼03:33 UT on the 8 January 2005 (∼00:35 MLT), with dispersed signatures evident at the other satellites. The geosynchronous electron flux intensity during this injection is shown in Fig. 5c.
5 Observations of particle precipitation
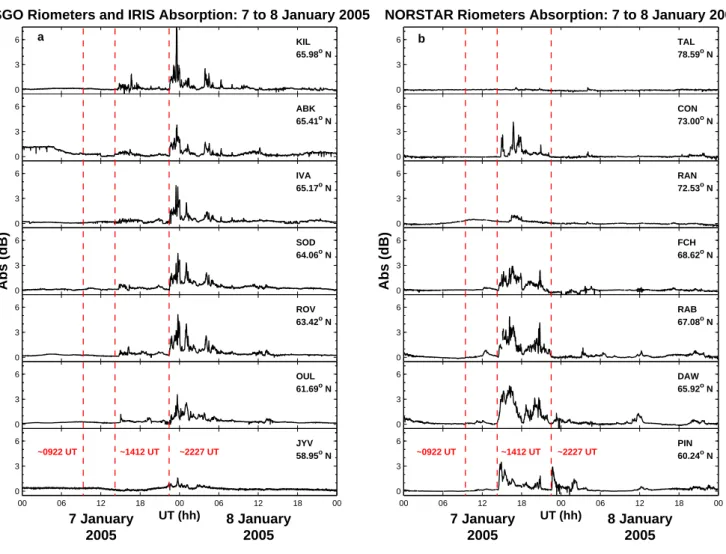
The ionospheric CNA data observed by seven of the SGO ri-ometers and IRIS at Kilpisj¨arvi throughout the ICME event is shown in Fig. 6a. From top to bottom, the plots relate to these stations ordered by descending geomagnetic latitude. The SGO riometers and IRIS have operating frequencies in the range 29.9 MHz to 38.2 MHz. As frequency can be con-sidered to be a scaling factor for absorption magnitude (e.g. Hargreaves, 1969), all absorption data have been scaled to a frequency of 30 MHz. The scaling was performed according to Eq. (1), wheref30is a frequency of 30 MHz,fois the
op-erational frequency of the riometer andAis the absorption at a given frequency.
A(f30)=A(fo) (fo)2 (f30)2
(1) Figure 6b shows the CNA data for the event from seven of the NORSTAR riometers. From top to bottom, the plots re-late to these stations ordered by descending geomagnetic lat-itude. All NORSTAR riometers have a frequency of 30 MHz. The vertical lines on Fig. 6 indicate the timing of the SC, at ∼09:22 UT, and the onset of two substorms, at∼14:12 UT and∼22:27 UT, for both the SGO riometers and IRIS and the NORSTAR riometers.
5.1 Precipitation prior to substorm onset
101 103 105
Flux Intensity (#/cm
2 /s/sr/keV) 101 103 105
101 103 105
00 06 12 18 00 06 12 18 00
101 103 105
UT (hh)
101 103 105
LANL SOPA Electron Flux: 7 to 8 January 2005
50−75 keV 75−105 keV 105−150 keV 150−225 keV 225−315 keV 315−500 keV
1990−095 1994−084
01A
02A 97A
7 January 2005 8 January 2005
Fig. 4. Electron flux for particles with energies in the range of 50 to 500 keV from the LANL satellites used in the study on the 7 and 8 January 2005.
conditions for SCA (Osepian and Kirkwood, 2004) are not met;Kp<2 and geomagnetic perturbation<30 nT.
During the first fours hours of passage of the ICME, prior to the onset of the first substorm at∼14:12 UT on 7 January, CNA is limited. The majority of the riometers show only small fluctuations in CNA of the order of 0.15 dB, which is consistent with CNA fluctuations prior to the ICME. A step increase of∼0.22 dB can be seen at Abisko at∼14:05 UT on 7 January, although this is most likely to be due to the small error in CNA calculation stated in Sect. 2. Isolated instances of CNA are evident at this time at Rabbit Lake, up to∼0.63 dB, and at Dawson, of the order of 0.3 dB.
The horizontal component of the geomagnetic field recorded by ground based magnetometer stations in the IM-AGE chain (panel a) and the CARISMA chain (panel b) are shown in Fig. 7. The plots show the stations ordered by de-scending magnetic latitude. The bottom panels show the hor-izontal magnetic field component of the SAMNET York
sta-tion and the CARISMA Pinawa stasta-tion filtered for Pi2 pulsa-tions. The data show that there is little geomagnetic activity in the period prior to substorm onset. The vertical lines mark the time of the SC and the onset of the two substorm periods. 5.2 Precipitation during the first period of substorm activity At the time of onset of the first period of substorm activity (∼14:12 UT on the 7 January 2005), the NORSTAR riome-ter stations are in the local morning (∼03:44–07:47 MLT) and the SGO riometers and IRIS are located towards dusk (∼16:43–17:11 MLT). Figure 8 shows the CNA data for the event from 14:00 UT until 22:00 UT on the 7 January 2005, covering this period of activity. Figure 9a shows the IMAGE magnetometer data during this period.
101 103 105
Flux Intensity (#/cm
2 /s/sr/keV) 101 103 105
101 103 105
1400 1415 1430 1445 1500 1515 101
103 105
UT (hhmm)
101 103 105
LANL SOPA Electron Flux 7 January 2005
101 103 105
LANL SOPA Electron Flux 7 January 2005
101 103 105
101 103 105
101 103 105
2215 2230 2245 2300 2315 2330 101
103 105
UT (hhmm)
101 103 105
LANL SOPA Electron Flux 8 January 2005
101 103 105
101 103 105
101 103 105
0315 0330 0345 0400 0415 0430 101
103 105
UT (hhmm)
50−75 keV 75−105 keV 105−150 keV 150−225 keV 225−315 keV 315−500 keV
1990−095 1994−084
01A
02A 97A
a b c
Fig. 5.Electron flux for particles with energies in the range of 50 to 500 keV from the LANL satellites used in the study. Panel(a)shows data during the period of 14:00 UT to 15:15 UT on the 7 January 2005. Panel(b)shows data during the period of 22:15 UT to 23:30 UT on the 7 January 2005. Panel(c)shows data during the period of 03:15 UT to 04:30 UT on the 8 January 2005.
Lake, Pinawa and Fort Churchill, show the onset of a sus-tained period of CNA around∼14:26 UT (at∼06:49 MLT, ∼07:34 MLT and ∼07:40 MLT, respectively). Of the three riometers located above 70◦
N geomagnetic latitude (Rankin Inlet, Contwoyto and Taloyoak) only Contwoyto shows sig-nificant CNA during the substorm. However, the onset at this station does not occur until∼14:48 UT (∼06:31 MLT), de-spite being the second most westerly station from the chain. The location of the riometers and the duration of the CNA in-dicate that this is likely to be Slowly Varying (Morning) Ab-sorption (SVA) caused by the hardening of eastward drifting electrons from the substorm injection (e.g. Stauning, 1996, and references therein).
CNA is evident in IRIS and all SGO riometer stations except Jyv¨askyl¨a after∼14:35 UT (∼17:05–17:34 MLT at CNA onset). Jyv¨askyl¨a is located at the lowest magnetic lat-itude of the SGO stations (58.95◦
N, L≈3.81). LANL satel-lites located eastward 02A) and westward
(LANL-01A) of the position of these riometers do not show an crease in electron flux intensities consistent with particle in-jection. They also do not show a significant variation across energy channels consistent with drifting particles at the time of the CNA.
0 3 6
SGO Riometers and IRIS Absorption: 7 to 8 January 2005
0 3 6
0 3 6
0 3 6
Abs (dB)
0 3 6
0 3 6
00 06 12 18 00 06 12 18 00 0
3 6
UT (hh)
0 3 6
NORSTAR Riometers Absorption: 7 to 8 January 2005
0 3 6
0 3 6
0 3 6
Abs (dB)
0 3 6
0 3 6
00 06 12 18 00 06 12 18 00 0
3 6
UT (hh) KIL
65.98o N
ABK 65.41o N
IVA 65.17o N
SOD 64.06o N
ROV 63.42o N
OUL 61.69o N
JYV 58.95o N
TAL 78.59o N
CON 73.00o N
RAN 72.53o N
FCH 68.62o N
RAB 67.08o N
DAW 65.92o N
PIN 60.24o N
7 January 2005
8 January 2005
7 January 2005
8 January 2005
~0922 UT ~1412 UT ~2227 UT ~0922 UT ~1412 UT ~2227 UT
a b
Fig. 6.Ionospheric CNA from the selected GLORIA stations on the 7 and 8 January 2005. The stations are ordered by descending magnetic latitude. Panel(a)shows data from the SGO riometers and IRIS at Kilpisj¨arvi. Panel(b)shows data from the NORSTAR riometers.
increase in CNA is associated with the appearance of the sub-storm current system overhead and precedes the increase in Pdyn; this may influence the subsequent increase in CNA but
that is inconclusive. The lack of electron flux at the local LANL satellite can be explained if the electrons responsible for the absorption are of lower than usual energy and if the current system is confined earthward of geostationary orbit at that magnetic local time. Inspection of a north-south aligned row of beams in IRIS indicates that the CNA drops away with increasing latitude such that the footprint of geostationary or-bit corresponds to essentially background CNA.
Variations in solar wind pressure can be observed at Geo-tail from∼14:30 UT, with an impulse at∼14:57 UT. These variations occur during the first period of substorm activity, when CNA is also observed at the SGO riometers and IRIS. ThePdynincrease is due to an increase in the proton number
density of the solar wind rather than velocity and is highly variable. At this time, theKp index indicates active condi-tions (Kp≥5).
The global geomagnetic field at this time can be investi-gated via the H index. An overall decrease in SYM-H can be observed from the time of the substorm onset at ∼14:12 UT. Some deviations from the trend of SYM-H that seem to reflect changes inPdyncan be seen. However, there
are many Pdyn variations that appear to have no effect on
SYM-H. The sudden decrease inPdynobserved by Geotail
at∼17:56 UT is mirrored by a sudden decrease in SYM-H at∼18:00 UT, indicating rapid expansion of the magneto-sphere. The decreases inPdynand SYM-H occur at the time
at which the period of CNA also finally tails off at both chains of riometers and IRIS.
While the CNA at SGO and IRIS occurs during a period of Pdynvariations, there is no evidence that the CNA is directly
driven byPdynat this time. For example, the most significant
peak in CNA at IRIS, observed from∼16:30 UT, does not correspond to an impulse in thePdynor SYM-H index.
9000 10500
IMAGE Magnetometers: 7 to 8 January 2005
10000 11500
10000 11500
10000 11500
H (nT)
10000 11500
12500 14000
00 06 12 18 00 06 12 18 00 12000
13500
00 06 12 18 00 06 12 18 00 −8
0 8
UT (hh)
Pi2
H (nT)
3500 5000
CARISMA Magnetometers: 7 to 8 January 2005
7000 8500
1000 2500
7500 9000
H (nT)
10000 11500
8500 10000
00 06 12 18 00 06 12 18 00 14000
15500
00 06 12 18 00 06 12 18 00 −40
0 40
UT (hh)
Pi2
H (nT)
KIL 65.98o N
ABK 65.41o N
IVA 65.17o N
MUO 64.81o N
SOD 64.06o N
RVK 62.27o N
OUJ 61.08o N
YOR
50.84o N
7 January 2005
8 January 2005
TAL 78.59o N
CON 73.00o N
RAN 72.53o N
FCH 68.62o N
RAB 67.08o N
DAW 65.92o N
PIN 60.24o N
7 January 2005
8 January 2005 a
b
~0922 UT ~1412 UT ~2227UT ~0922 UT ~1412 UT ~2227UT
PIN
60.24o N
Fig. 7. The horizontal component of the geomagnetic field from ground based magnetometers on the 7 and 8 January 2005. The stations are ordered by descending magnetic latitude. Panel(a)shows data from the IMAGE magnetometer chain. Panel(b)shows data from the CARISMA magnetometer chain. Pi2 filtered data are shown for the SAMNET York station and the CARISMA Pinawa station.
morning at this time, as the impulses occur during ongoing substorm related precipitation. Following the end of the sub-storm activity, CNA is still evident at some of the NORSTAR riometers at latitudes below 70◦
N. However, this does not appear to be linked toPdynvariations as coincident impulses
in SYM-H are not evident.
At∼20:30 UT, a two-step increase in SYM-H of around 30 nT is evident following aPdyn decrease followed almost
immediately by rapid increases. This coincides with a period of enhanced CNA at NORSTAR with multiple peaks. As precipitation is observed prior to the impulse, the CNA may simply be a continuation of the previous activity.
5.3 Precipitation during the second period of substorm ac-tivity
At the time of onset of the second period of substorm activ-ity (∼22:27 UT on the 7 January 2005), the SGO riometers and IRIS were located post-midnight (∼00:58–01:26 MLT)
while the NORSTAR riometers were in the local afternoon (∼11:59–16:02 MLT). Figure 10 shows the CNA data for the event from 22:00 UT on the 7 January 2005 until 02:00 UT on the 8 January 2005, covering this period of activity. The IMAGE magnetometer data for this period is shown in Fig. 9b.
The SGO riometers (except Jyv¨askyl¨a) and IRIS begin to show enhanced CNA from∼22:28 UT. There is evidence of a rapid longitudinal motion westward in the CNA. It is first ob-served in the most easterly station, Ivalo, before progressing to the most westerly station, Abisko, after a time delay of the order of two minutes. This CNA occurs after the onset of the second period of substorm activity with the apparently dis-persionless injection at∼22:27 UT at LANL-02A (Fig. 5b).
0 1 2
SGO Riometers and IRIS Absorption: 7 January 2005
0 1 2
0 1 2
0 1 2
Abs (dB)
0 1 2
0 1 2
14 15 16 17 18 19 20 21 22 0
1 2
UT (hh)
0 2 4
NORSTAR Riometers Absorption: 7 January 2005
0 2 4
0 2 4
0 2 4
Abs (dB)
0 2 4
0 2 4
14 15 16 17 18 19 20 21 22 0
2 4
UT (hh)
14 15 16 17 18 19 20 21 22
0
−50
UT (hh)
SYM−H (nT) 0 20
SW DP (nPa)
0 20
SW DP (nPa)
14 15 16 17 18 19 20 21 22
0
−50
UT (hh)
SYM−H (nT)
KIL 65.98o N
ABK 65.41o N
IVA 65.17o N
SOD 64.06o N
ROV 63.42o N
OUL 61.69o N
JYV 58.95o N
TAL 78.59o N
CON 73.00o N
RAN 72.53o N
FCH 68.62o N
RAB 67.08o N
DAW 65.92o N
PIN 60.24o N
a b
Fig. 8. Ionospheric CNA from the selected GLORIA stations during the period of 14:00 UT until 22:00 UT on the 7 January 2005. The stations are ordered by descending magnetic latitude. Panel(a)shows data from the SGO riometers and IRIS at Kilpisj¨arvi. Panel(b)shows data from the NORSTAR riometers. Solar wind dynamic pressure data from Geotail and the SYM-H index are shown at the bottom of each panel.
vary on a timescale of the order of five minutes. CNA is primarily seen at the higher latitude stations of the SGO chain and IRIS. However, between ∼23:32 and 23:55 UT, CNA reaching levels greater than 1.5 dB can even be seen at Jyv¨askyl¨a. This indicates an expansion of the auroral oval to latitudes below 60◦
N during this time.
The CNA over Fennoscandia also coincides with local geomagnetic disturbances identified in the IMAGE magne-tometer data (Fig. 9b). The later periods of CNA coincide with impulsive short-lived disturbances in the local geomag-netic field.
Prior to 23:30 UT on 7 January 2005, the global geomag-netic field in the form of the SYM-H index appears to be dominated by the effects of the substorm activity. After this, compression and expansion of the magnetic field can be seen following some of the largePdynpulses observed at Geotail.
Initially, while the riometers are located in the night sec-tor, the precipitation appears to be directly related to the sub-storm activity. Much of this CNA occurs at times of elevated
electron flux intensities observed by LANL-01A and 02A. During the progression of the substorms, Pdyn is elevated
and impulsive signatures in the SYM-H index appear coinci-dent with CNA, for example at the time of CNA at Jyv¨askyl¨a. However, at these times some riometers in the SGO chain and IRIS exhibit CNA prior to the impulse and so it is not pos-sible to attribute the CNA to the impulse due to the ongoing precipitation.
10700 11200
IMAGE Magnetometers: 7 January 2005
11300 11800
11000 11500
11400 11900
H (nT)
11300 11800
13000 13500
14 15 16 17 18 19 20 21 22 12800
13300
14 15 16 17 18 19 20 21 22 −8
0 8
UT (hh)
Pi2
H (nT)
22 23 00 01 02
−8 0 8
UT (hh)
Pi2
H (nT)
22 23 00 01 02
12000 14000 10000 12500
12000 14000 10000 12000
H (nT)
10000 11500 10000 12000 11000
9500
IMAGE Magnetometers: 7 to 8 January 2005
KIL 65.98o N
ABK 65.41o N
IVA 65.17o N
MUO 64.81o N
SOD 64.06o N
RVK 62.27o N
OUJ 61.08o N
YOR
50.84o N
a b KIL
65.98o N
ABK 65.41o N
IVA 65.17o N
MUO 64.81o N
SOD 64.06o N
RVK 62.27o N
OUJ 61.08o N
YOR
50.84o N
Fig. 9. The horizontal component of the geomagnetic field from selected IMAGE magnetometer stations. The stations are ordered by descending magnetic latitude. Panel(a)shows the data during the period of 14:00 UT until 22:00 UT on the 7 January 2005. Panel(b)shows the data during the period of 22:00 UT on the 7 January 2005 until 02:00 UT on the 8 January 2005. Pi2 filtered data are shown for the SAMNET York station.
is not coincident withPdynvariations and there is no impulse
in SYM-H at this time, ruling out SIA. Dawson also observes CNA at∼23:16 UT (∼12:48 MLT) that is unrelated to im-pulses in SYM-H. Signatures of the substorm are clear in the IMAGE magnetometer data (Fig. 7). The second bay at∼03:45 UT indicates a double onset or intensification but may simply be a continuation of the earlier substorm related precipitation.
5.4 Precipitation following the substorm activity
The last clear dispersionless injection signature indicating substorm activity was observed in the LANL SOPA electron flux intensity at ∼03:33 UT on the 8 January 2005. Fig-ure 11 shows the CNA data for the event from 04:00 UT until 10:00 UT on the 8 January 2005, covering the period following the previous activity. Instances of CNA are still evident at both chains of riometers. At this time, the effects
of isolated instances of rapid magnetospheric compression on precipitation while geomagnetic activity is still high can be investigated.
For example, at∼04:19 UT on the 8 January 2005, the Pdyn at Geotail began to rapidly increase, reaching a peak
value of∼39 nPa at∼04:30 UT, an increase of over 30 nPa. This was followed by a 48 nT positive impulse in SYM-H. The onset of the impulse in SYM-H occurred at∼04:21 UT, reaching a peak value at∼04:36 UT. At this time, Kp was 6−, well above the activity threshold found by Osepian
0 3 6
SGO Riometers and IRIS Absorption: 7 to 8 January 2005
0 3 6
0 3 6
0 3 6
Abs (dB)
0 3 6
0 3 6
22 23 00 01 02
0 3 6
UT (hh)
0 1 2
NORSTAR Riometers Absorption: 7 to 8 January 2005
0 1 2
0 1 2
0 1 2
Abs (dB)
0 1 2
0 1 2
22 23 00 01 02
0 1 2
UT (hh)
22 23 00 01 02
0 −50 −100
UT (hh)
SYM−H (nT) 0 20 40
SW DP (nPa)
0 20 40
SW DP (nPa)
22 23 00 01 02
0 −50 −100
UT (hh)
SYM−H (nT)
KIL 65.98o N
ABK 65.41o N
IVA 65.17o N
SOD 64.06o N
ROV 63.42o N
OUL 61.69o N
JYV 58.95o N
TAL 78.59o N
CON 73.00o N
RAN 72.53o N
FCH 68.62o N
RAB 67.08o N
DAW 65.92o N
PIN 60.24o N
a b
Fig. 10.Ionospheric CNA from the selected GLORIA stations during the period of 22:00 UT on the 7 until 02:00 UT on the 8 January 2005. The stations are ordered by descending magnetic latitude. Panel(a)shows data from the SGO riometers and IRIS at Kilpisj¨arvi. Panel(b)
shows data from the NORSTAR riometers. Solar wind dynamic pressure data from Geotail and the SYM-H index are shown at the bottom of each panel.
riometers, located in the dusk-midnight sector. CNA in-creases occur simultaneously at Dawson (∼18:00 MLT) and Churchill (∼21:56 MLT) at∼04:28 UT. There is a slight de-lay (∼4 min) at higher latitudes, for example at Rankin Inlet and Contwoyto. It should be noted that there is no longitu-dinal progression between stations. This appears to be evi-dence of global scale particle precipitation following aPdyn
driven geomagnetic impulse.
A number ofPdyn increases can be mapped to CNA
in-creases at the SGO and IRIS riometers in this manner, with corresponding geomagnetic impulses in SYM-H. There-fore, it seems that the CNA observed from 04:22 UT, un-til∼12:45 UT is SIA. However, no more clear examples of global scale SIA have been identified with particle precipi-tation evident in NORSTAR riometers as well, likely due to the local time positions of the instruments, under the magne-totail.
From Fig. 11, a period of excellent coincidence between dayside CNA, the SYM-H index andPdynat Geotail can be
seen from 06:00 UT until 08:30 UT. Throughout this period, the SGO riometers and IRIS at Kilpisj¨arvi were at MLTs in the range∼08:31 to∼11:29 and so were ideally located to observe any SIA effects.
0 1 2
SGO Riometers and IRIS Absorption: 8 January 2005
0 1 2
0 1 2
0 1 2
Abs (dB)
0 1 2
0 1 2
04 05 06 07 08 09 10
0 1 2
UT (hh)
0 0.5 1
NORSTAR Riometers Absorption: 8 January 2005
0 0.5 1
0 0.5 1
0 0.5 1
Abs (dB)
0 0.5 1
0 0.5 1
04 05 06 07 08 09 10
0 0.5 1
UT (hh)
04 05 06 07 08 09 10
0 −50 −100
UT (hh)
SYM−H (nT) 0 20 40
SW DP (nPa)
0 20 40
SW DP (nPa)
04 05 06 07 08 09 10
0 −50 −100
UT (hh)
SYM−H (nT)
KIL 65.98o N
ABK 65.41o N
IVA 65.17o N
SOD 64.06o N
ROV 63.42o N
OUL 61.69o N
JYV 58.95o N
TAL 78.59o N
CON 73.00o N
RAN 72.53o N
FCH 68.62o N
RAB 67.08o N
DAW 65.92o N
PIN 60.24o N
a b
Fig. 11.Ionospheric CNA from the selected GLORIA stations during the period of 04:00 UT until 10:00 UT on the 8 January 2005. The stations are ordered by descending magnetic latitude. Panel(a)shows data from the SGO riometers and IRIS at Kilpisj¨arvi. Panel(b)shows data from the NORSTAR riometers. Solar wind dynamic pressure data from Geotail and the SYM-H index are shown at the bottom of each panel.
storm of the 7 and 8 January 2005 differ from storm SCs as they are not isolated incidents and occur during ongoing geo-magnetic activity. Also, the storm SCs are related to the pas-sage of interplanetary shocks whereas the impulses during this ICME are due toPdynvariations, controlled by changes
in density.
At the time of thePdyn pulses coincident with CNA, the
electron flux intensity at the LANL satellites show small in-creases simultaneously across all energy channels. Studies conducted have shown a broad correlation between geosyn-chronous electron flux intensity and CNA during substorms (e.g. Parks et al., 1968; Arnoldy and Chan, 1969; Rosen and Winckler, 1970). Baker et al. (1981) present a number of events where riometers record CNA rises at the time of geosynchronous flux intensity increases at conjugate LANL satellites during the near midnight and morning sectors, again during substorms.
6 Summary and conclusions
We have presented a case study of energetic electron precip-itation during a moderate geomagnetic storm driven by the passage of an ICME. Observations were made by riometers in Canada and Fennoscandia that comprise part of GLORIA; the locations of the instruments at the time of the storm on-set were particularly advantageous for studying both external and internal precipitation trigger mechanisms during the pe-riod of elevated geomagnetic activity.
CNA was only observed following periods of enhanced IMF-magnetosphere coupling (as indicated by negativeBz) which led to substorm activity with associated injections of electrons into the inner magnetosphere. An increase in CNA close to dusk has been associated with the westward edge of the substorm current system rather than a coincident small in-crease inPdyn. Subsequent larger steps in the pressure might
affect the precipitation but the observations are inconclusive. Much of the CNA observed during the storm was linked to substorm activity, through the precipitation of freshly in-jected electrons or following gradient curvature drift. How-ever, additional absorption directly driven by solar wind con-ditions was also observed. During the recovery phase of the storm, substorm activity diminished and the effect of changes inPdyn on CNA could be determined. For an
im-pulse at ∼04:20 UT, riometers in both the post-dawn and dusk-midnight sectors recorded a response; the rise time was similar for all instruments indicating a global response to the pressure enhancement.
Between 04:00 and 12:00 UT the dayside riometers record a good correlation with the SYM-H index; although not all impulses recorded in SYM-H show a corresponding absorp-tion signature. The nightside riometers do not show any fur-ther enhancements. Thus solar wind density-controlled SIs during the recovery phase of a storm can produce a very dif-ferent precipitation response to typical SCs.
Acknowledgements. The authors wish to thank M. Denton for
use-ful conversations. The ACE and Geotail solar wind and IMF data were obtained from the NASA CDAWeb (http://cdaweb.gsfc.nasa. gov). The data originated from the Imaging Riometer for Iono-spheric Studies (IRIS), operated by the Department of Communi-cations Systems at Lancaster University (UK) in collaboration with the Sodankyl¨a Geophysical Observatory, and is funded by the Sci-ence and Technology Facilities Council (STFC, formerly PPARC). The NORSTAR riometer project is supported by the Canadian Space Agency. We are grateful to E. Spanswick who baselined the NORSTAR data used in this study. We thank the institutes who maintain the IMAGE magnetometer array and the Finnish Meteo-rological Institute; the IMAGE magnetometer data are collected as a joint European collaboration. The authors thank the SAMNET team for magnetometer data. SAMNET is operated by Lancaster University and funded by STFC (formerly PPARC). The authors thank I. R. Mann and the CARISMA team for data. CARISMA is operated by the University of Alberta with support from the Canadian Space Agency. TheDst andKp indices data were ob-tained from NOAA’s Space Physics Interactive Data Resources (http://spidr.ngdc.noaa.gov). The SYM-H and auroral electrojet in-dices data were obtained from the Kyoto World Data Center for Geomagnetism (http://swdcdb.kugi.kyoto-u.ac.jp). We thank Dot DeLapp and team at LANL for providing the SOPA data.
Topical Editor I. A. Daglis thanks M. Jarvis and another anony-mous referee for their help in evaluating this paper.
References
Araki, T.: Global structure of geomagnetic sudden commence-ments, Planet. Space Sci., 25, 373–384, 1977.
Arnoldy, R. and Chan, K.: Particle substorms observed at the geo-stationary orbit, J. Geophys. Res., 74, 5019–5028, 1969. Baker, D., Stauning P., Hones Jr., E., Higbie, P., and Belian, R.:
Near-equatorial, high-resolution measurements of electron pre-cipitation at L⋍6.6, J. Geophys. Res., 86(A4), 2295–2313, 1981. Belian, R., Gisler, G., Cayton, T., and Christensen, R.: High-Z ener-getic particles at geosynchronous orbit during the great solar pro-ton event series of October 1989, J. Geophys. Res., 97, 16 897– 16 906, 1992.
Borovsky, J. and Denton, M.: Differences between CME-driven Storms and CIR-driven Storms, J. Geophys. Res., 111, A07S08, doi:10.1029/2005JA011447, 2006.
Brown, R.: On the poleward expansion of ionospheric absorption regions triggered by sudden commencements of geomagnetic storms, J. Geophys. Res., 83(A3), 1169–1171, 1978.
Brown, R., Hartz, T., Landmark, B., Leinbach, H., and Ortner, J.: Large-scale electron bombardment of the atmosphere at the sud-den commencement of a geomagnetic storm, J. Geophys. Res., 66, 1035–1041, 1961.
Brown, R., Leinbach, H., Akasofu, S.-I., Driatsky, V., and Schmidt, R.: Quadruple conjugate pair observations of the sudden com-mencement absorption event on June 17, 1965, J. Geophys. Res., 77, 5602–5607, 1972.
Burch, J.: Preconditions for the triggering of polar magnetic sub-storms by storm sudden commencements, J. Geophys. Res., 77, 5629–5632, 1972.
Denton, M., Borovsky, J., Skoug, R., Thomsen, M., Lavraud, B., Henderson, M., McPherron, R., Zhang, J., and Liemohn, M.: Geomagnetic storms driven by ICME- and CIR-dominated solar wind, J. Geophys. Res., 111, A07S07, doi:10.1029/2005JA011436, 2006.
Frank, L., Ackerson, K., Paterson, W., Lee, J., English, M., and Pickett, G.: The Comprehensive Plasma Instrumentation (CPI) for the GEOTAIL spacecraft, J. Geomagn. Geoelectr., 46, 23–37, 1994.
Gonzalez, W., Joselyn, J., Kamide, Y., Kroehl, H., Rostoker, G., Tsurutani, B., and Vasyliunas, V.: What is a geomagnetic storm?, J. Geophys. Res., 99, 5771–5792, 1994.
Gosling, J., McComas, D., Phillips, J., and Bame, J.: Geomagnetic activity associated with Earth passage of interplanetary shock disturbances and coronal mass ejections, J. Geophys. Res., 96, 7831–7839, 1991.
Hargreaves, J.: Auroral absorption of HF radio waves in the iono-sphere: A review of results from the first decade of riometry, P. IEEE, 57, 1348–1373, 1969.
Hargreaves, J.: The Solar-Terrestrial Environment, Cambridge Uni-versity Press, 1992.
Kamide, Y., Yokoyama, N., Gonzalez, W., Tsurutani, B., Daglis, I., Brekke, A., and Masuda, S.: Two step development of geomag-netic storms, J. Geophys. Res., 103, 6917–6921, 1998.
Khan, H. and Cowley, S.: Observations of the response time of high-latitude ionospheric convection to variations in the inter-planetary magnetic field using EISCAT and IMP-8 Data, Ann. Geophys., 17, 1306–1335, 1999,
http://www.ann-geophys.net/17/1306/1999/.
and Kawano, H.: The GEOTAIL Magnetic Field Experiment, J. Geomagn. Geoelectr., 46, 7–21, 1994.
Maus, S., MacMillan, S., Chernova, T., Choi, S., Dater, D., Golovkov, V., Lesur, V., Lowes, F., L¨uhr, H., Mai, W., McLean, S., Olsen, N., Rother, M., Sabaka, T., Thomson, A., and Zvereva, T.: The 10th generation international geomagnetic reference field, Phys. Earth Planet. In., 151, 320322, 2005.
McComas, D., Bame, S., Barker, P., Feldman, W., Phillips, J., Riley, P., and Griffee, J.: Solar Wind Electron Proton Alpha Monitor (SWEPAM) for the Advanced Composition Explorer, Space Sci. Rev., 86, 563–612, 1998.
Ortner, J., Hultqvist, B., Brown, R., Hartz, T., Holt, O., Land-mark, B., Hook, J., and Leinbach, H.: Cosmic noise absorp-tion accompanying geomagnetic storm sudden commencements, J. Geophys. Res., 67, 4169–4186, 1962.
Osepian, A. and Kirkwood, S.: Cosmic radio-noise absorption bursts caused by solar wind shocks, Ann. Geophys., 22, 2973– 2987, 2004,
http://www.ann-geophys.net/22/2973/2004/.
Parks, G., Arnoldy, R., Lezniak, T., and Winckler, J.: Correlated effects of energetic electrons at the 6.6Reequator and the auroral zone during magnetospheric substorms, Radio Sci., 3, 715–719, 1968.
Perona, G.: Theory on the precipitation of magnetospheric electrons at the time of sudden commencement, J. Geophys. Res., 77, 101– 111, 1972.
Richardson, I., Cliver, E., and Cane, H.: Sources of geomag-netic storms for solar minimum and maximum conditions during 1972–2000, Geophys. Res. Lett., 28, 2567–2572, 2001. Rosen, L. and Winckler, J.: Evidence for the large-scale azimuthal
drift of electron precipitation during magnetospheric substorms, J. Geophys. Res., 75, 5576–5581, 1970.
Smith, C., L’Heureux, J., Ness, N., Acu˜na, M., Burlaga, L., and Scheifele, J.: The ACE Magnetic Fields Experiment, Space Sci. Rev., 86, 613–632, 1998.
Stauning, P.: Investigations of ionospheric radio wave absorption processes using imaging riometer techniques, J. Atmos. Terr. Phys., 58, 753–764, 1996.
Takeuchi, T., Araki, T., Viljanen, A., and Watermann, J.: Ge-omagnetic negative sudden impulses: Interplanetary causes and polarization distribution, J. Geophys. Res., 107, A7, doi:10.1029/2001JA900152, 2002.
Taylor, J., Lester, M., and Yeoman, T.: A superposed epoch analysis of geomagnetic storms, Ann. Geophys., 12, 612–624, 1994, http://www.ann-geophys.net/12/612/1994/.
Tsyganenko, N.: Modeling the Earth’s magnetospheric field con-fined within a realistic magnetospause, J. Geophys. Res., 100, 5599–5612, 1995.