SYNERGY BETWEEN LiDAR AND IMAGE DATA IN CONTEXT OF BUILDING
EXTRACTION
A. P. Dal Poz a, *
a
Dept. of Cartography, São Paulo State University, R. Roberto Simonsen, 305, Presidente Prudente-SP, Brazil - [email protected]
Commission I
KEY WORDS: Aerophotogrammetry, LiDAR, Building extraction
ABSTRACT:
This paper compares the paradigms of LiDAR and aerophotogrammetry in the context of building extraction and briefly discusses a photogrammetric strategy for refining building roof polyhedrons previously extracted from LiDAR data. In general, empirical and theoretical studies have confirmed that LiDAR-based methodologies are more suitable in extracting planar roof faces and ridges of the roof, whereas the aerophotogrammetry are more suitable in extracting building roof outlines. In order to exemplify how to explore these properties, it is presented a photogrammetric method for refining 3D building roof contours extracted from airborne LiDAR data. Examples of application are provided for this refining approach.
*
Corresponding author.
1. INTRODUCTION
Building extraction methods are very important in the context of spatial data capture and updating for GIS applications. These methods may be classified into three categories according to the kind of input data, i.e.: methods using LiDAR data (e.g., Wei, 2008; Galvanin and Dal Poz, 2012; Liu et al., 2013; Xu et al., 2014), using image data (e.g., Müller and Zaum, 2005; Sırmaçek and Ünsalan, 2011; Sellaouti et al., 2014; Benali et al., 2014), and combining LiDAR and photogrammetric data (e.g., Kim and Habib, 2009; Cheng et al., 2011; Li et al., 2013; Awrangjeb et al., 2013).
Methods based on the combination between photogrammetric and LiDAR data seek to take advantage of the synergy between both data sources. Some of these methods are briefly commented in the following. Haala and Brenner (1999) combined multispectral imagery and DEM (Digital Elevation Model) derived from LiDAR data for separating building from vegetation. In Sohn and Dowman (2003) buildings are first extracted from both Ikonos imagery and a LiDAR-derived DEM and, then, the results obtained from both data sources are combined to remove inconsistencies. Vosselman (2002) combined LiDAR, plan view, and high-resolution aerial image data to automatically reconstruct 3D buildings. In Jaw and Cheng (2008) buildings are segmented in LiDAR data and refined in an aerial image. Kim and Habib (2009) proposed a method for automated generation of polyhedral building models for complex structures, taking into account three main steps: 1) generation of building hypothesis and derivation of individual planar patches constituting building rooftops by using LiDAR data; 2) initial boundaries of these patches are refined through the integration of LiDAR and photogrammetric data; 3) polyhedral building models are generated using the refined boundaries. Cheng et al. (2011) proposed an approach integrating multi-view aerial image and LiDAR data to reconstruct 3D building models. Awrangjeb et al. (2013) proposed a method for automatic 3D roof extraction through integration of LiDAR and multispectral orthoimage, allowing the isolation of regions of interest (i. e., buildings) and restricting the extraction process within these regions. Li et al.
(2013) proposed an urban building extraction method to address the problems with shadow and spectral confusion using LiDAR data and very high-resolution images.
Building roof boundaries are potentially well defined in image data than in LiDAR data. The opposite occurs when the goal is the reconstruction of surfaces with homogeneous texture, like the planar surface of roof faces. On the other hand, the extraction of planar building roofs using LiDAR data is potentially more accurate and reliable than using image data. This paper briefly reviews the synergy between LiDAR and aerophotogrammetry in the context of building extraction (Section 2) and presents a photogrammetric strategy for refining building roof polyhedrons previously extracted from LiDAR data (Section 3). Section 4 finalises this article with main conclusions.
2. SYNERGY BETWEEN LIDAR AND IMAGE DATA IN CONTEXT OF BUILDING EXTRACTION
boundaries. In general, fine details, like edges, corners etc., should be extracted with the help of photogrammetric images. Finally, photogrammetric images are also necessary to attribute accurate and complete semantic meaning to a whole building or to parts of a building. A general comparison of LiDAR and Photogrammetry paradigms can be found in Baltsavias (1999). Kaartinen et al. (2005) presented an empirical evaluation that supports the theoretical analysis discussed above. The study compares accuracies obtained with aerophotogrammetry and LiDAR in building extraction. It consists of four test sites, three in Finland and one in France. The following data was used in the evaluation tests: aerial images (GSD ~ 6cm), camera calibration and image orientation information, ground control points, LiDAR data (2-20 pts./m2), and cadastral map vectors of selected buildings. Evaluation tests were carried out by 11 participants, leading to 3D building models. These 3D models were numerically compared to ground reference data. The main conclusions drawn from the tests are:
• Photogrammetric methods were more accurate in determining building outlines. However, site-dependent variations of LiDAR results were verified due to mainly differences in point density and in complexity of the building structure;
• Concerning building length determination, as expected LiDAR-based methods were not as accurate as photogrammetric methods. It was verified that LiDAR-based results were strongly dependent on the complexity of the buildings, rather than on the point density;
• LiDAR-based methods proved to be more efficient than the photogrammetrically-based methods in the derivation of building heights and planar roof faces. As a result, ridges of the roof and roof inclination were also better determined when using LiDAR-based methods. Moreover, it was verified that height determination accuracy followed exactly the LiDAR point density;
• The degree of automation was higher for LiDAR-based method, but it was affected by the complexity of the building;
• The plane target accuracy was inversely affected by the degree of automation, but almost no similar correlation was found for the target height accuracy. In general, due to above properties hybrid approaches combining LiDAR and photogrammetric data can potentially deliver results with better accuracy, reliability, and completeness than ones obtained using either LiDAR or photogrammetric data.
3. BUILDING REFINEMENT APPROACH
3.1 Line-based method
Figure 1 shows the geometric principle of the proposed method for projecting image-space straight lines onto corresponding building polyhedron faces. For instance, let´s consider the polyhedron edge A'B' (dashed line in Figure 1) to show how to photogrammetrically refine it. Suppose that the image-space straight-line segment ab corresponds to the polyhedron edge
A'B'. As such, the segment ab
defines one of the sides of the building representing the polyhedron in the image. Moreover, their endpoints or parameters can be measured in the image, manually or by an appropriate algorithm. The projection of the line segment ab onto the corresponding building polyhedron
face (resulting in the 3D straight-line AB) is based on the intersection between two planes (Figure 1), as follows:
• Plane defined by the perspective center (PC) and the line segment ab;
• Plane containing the polyhedron points A’, B’, C, and D.
As shown in Figure 1, the intersection of both planes generates the straight line r containing the unknown points A and B.
B
A’
+ pp C L
x y z
f
a b
x y
θ ρ PC
B’
A
C D
X Y Z
O
s
r
Figure 1. Principle of the proposed photogrammetric method
It is possible to demonstrate that the image-space plane defined by the PC and the straight-line segment ab can be expressed in the photogrammetric reference system PCxyz (see Figure 1) as follows,
-fcos(θ) x - fsen(θ) y + ρz= 0 (1)
In Figure 1, f is the focal length of the camera; θ is the angle between the x-axis and the straight line that contains the principal point (pp) and is perpendicular to the straight line ab; and ρ is
the distance between the pp and the straight line ab.
Equation 1 shows that the following vector is normal to the image-space plane,
i
N = [-fcos(θ) –fsen(θ) ρ]T (2)
The vector Ni can be transformed into the object-space reference
system (OXYZ) by the following transformation,
o
N = RTNi (3)
In Equation 3, R is the rotation matrix between the PCxyz and OXYZ reference systems. Its elements (rij) are functions of the camera attitude angles.
Let´s nx, ny, and nz be the components of the vector No and Xo,
Yo, and Zo be the coordinates of the PC in the OXYZ reference system. The equation of the object-space plane that is normal to
x o
y o
o z
n X X
n Y Y
Z Z n
− − −
x = nx(X - Xo) + ny(Y - Yo) + nz(Z - Zo)= 0 (4)
In Equation 4, ‘x’ is the inner product operator and X, Y, and Z are
the coordinates of a point belonging to the object-space plane. Equation 4 can be re-written by rearranging and grouping their variables, as follows:
AoX + BoY + CoZ + Do= 0 (5)
In Equation 5, Ao= nx, Bo= ny, Co= nz, and Do= -nxXo - nyYo - nzZo.
As A’, B’, C, and D are coplanar points (see Figure 1), the plane equation (Equation 6) that represents the selected building roof face (onto which the straight-line segment ab is projected) can be developed by using three of these points.
IX + JY + KZ + L= 0 (6)
In Equation 6, I, J, K, and L are the plane equation coefficients. The intersection of planes given by Equations 5 and 6 allows the determination of the straight-line equation (r) containing the unknown points A and B (see Figure 1), i.e.
2
( )
( )
K
Z ( )
o o
o o o o o o o o
o o
o o o
o o
o o
o o
X B K C J t
D C J D B K D C K C B L Y C I A K t
B B JC
D J B L A J B I t
B K C J
= −
− − +
= − +
−
−
= − +
−
(7)
where, t∈R.
3.2 Determination of the refined building roof contour vertices
The determination of the refined building contour vertices is accomplished by intersecting straight lines representing building roof contour sides with object-space planes. For example (see Figure 1), the vertex B is determined by intersecting the straight line (represented by Equation 7) containing points B´ and D (i.e., the projected straight line s in Figure 1) with the object-space plane (represented by Equation 6) containing the image-space points a and b. Please note that the main problem here is how to properly select the projected straight line and the object-space plane that allow the determination of each new vertex of the building roof contour.
The refining algorithm takes in consideration that each LiDAR-derived side of the roof contour has one and only one corresponding projected straight line. The refining algorithm proceeds as follows:
1)Choose arbitrarily the first side of the LiDAR-derived building roof contour;
2)Identify the object-space plane (π) that generated the straight line (r) corresponding to the LiDAR-derived roof side selected previously in step 1;
3)Seek in the clockwise direction for the next side of the LiDAR-derived building roof contour; let s be the corresponding object-space straight line generated by the line-based photogrammetric model;
4)Intersect the plane π with the straight line s to generate a refined building roof contour vertex (v);
5)If v coincides with the first refined vertex, discard it and stop; otherwise, reset the straight line s to r and return to step 2. All vertices determined by the above algorithm define the refined building roof contour and, as such, it should replace the original building roof contour.
3.3 Examples
The data set used in the examples below is from the city of Curitiba, Brazil. It comprehends one stereoscopic pair of high-resolution aerial images (GSD~ 0.2 meters), along with the interior (focal length, coordinates of the principal point, and lens distortion coefficients) and exterior (attitude and PC coordinates of the camera) orientation parameters, and 3D models of two building. Two 3D models were derived for each building, as follows: 1) one from a LiDAR data set (with point density of about 2 pts./m2) using an in-house software; and 2) another from the stereoscopic pair of aerial images using the LPS (Leica Photogrammetry Suite®) photogrammetric system.
The latter is used as the reference 3D building model in the evaluation of the refined 3D building model. The in-house software is based on standard procedures for three-dimensional reconstruction of building roofs, as e.g.: LiDAR point cloud filtering for separating ground and aboveground points; segmentation of roof planes based on the local homogeneity of normal vectors of the triangulated aboveground points; least squares adjustment of a plane to points of each roof segment; determination of lines of roof ridges by properly intersecting pair of adjacent roof planes; determination of the roof contour polygon based on the analysis of roof discontinuities; finally, the roof contour polygon and all lines of roof ridges are combined to form each polyhedral roof model.
Figure 2. Test building 1
Below it is presented and analyzed the results obtained using the hip-like roof showed in Figure 2. The building roof contours were manually extracted from one aerial image of the available stereoscopic pair. The manual digitalization procedure was adopted because the main focus is on the geometric accuracy of the proposed retracing process of LiDAR-derived building roof contours.
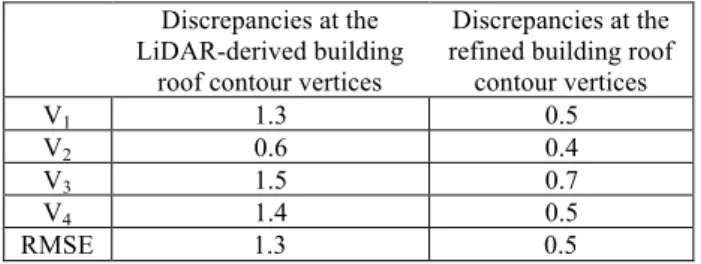
Table 1 shows the discrepancies between the LiDAR-derived and reference building roof contours and between the refined and reference building roof contours. The discrepancy metric is defined as the Euclidian distance between corresponding vertices (V1, V2, V3, and V4) of building roof contours being
shown in Table 1, the Root Mean Square Error (RMSE) shows that the refined building roof contour is significantly (almost twice) more accurate than the LiDAR-derived building roof contour.
Discrepancies at the LiDAR-derived building
roof contour vertices
Discrepancies at the refined building roof contour vertices
V1 1.3 0.5
V2 0.6 0.4
V3 1.5 0.7
V4 1.4 0.5
RMSE 1.3 0.5
Table 1 - Discrepancies (in meter) between the LiDAR-direved and reference building roof contours and between the refined
and reference building roof contours – Example 1
The second test uses the hip-like roof showed in Figure 3, which is similar to the one used in the first test.
Figure 3. Test building 2
The discrepancies between the LiDAR-derived and reference building roof contours and between the refined and reference building roof contours are showed in Table 2, together with the RMSE for the refined and LiDAR-derived building roof contour vertices. Once again, the refined building roof contour is geometrically better than the LiDAR-derived building roof contour. One can note that the LiDAR-derived roof contour of the test building 2 is less accurate than the LiDAR-derived building roof contour used in the previous test. RMSE values in Table 2 shows that the proposed refinement approach was able to successfully retrace the LiDAR-derived building roof contour, because the accuracy of the refined building roof contour is about three times better. However, the refined roof contour of the building test 2 is not as accurate as the refined roof contour of building test 1.
Discrepancies at the LiDAR-derived building
roof contour vertices
Discrepancies at the refined building roof contour vertices
V1 2.3 0.9
V2 2.5 1.0
V3 3.6 1.1
V4 2.3 0.7
RMSE 2.7 0.9
Table 2 - Discrepancies (in meter) between the LiDAR-derived and reference building roof contours and between the refined
and reference building roof contours – Example 2
4. CONCLUSIONS
This paper presented an overview of advantages and disadvantages of LiDAR and aerophotogrammetry paradigms in the context of building extraction and briefly presented a photogrammetric strategy to take advantage of the synergy between both data sources. Examples of application confirmed that the proposed photogrammetric strategy was useful in improving the accuracy of the boundary of the LiDAR-derived building polyhedron.
ACKNOWLEDGEMENTS
This work was supported by FAPESP (São Paulo State Foundation for Scientific Research), grant number 2013/13138-0, and CNPq (National Council for Scientific and Technological Development, Brazil), grant number 304879/2009-6.
REFERENCES
Awrangjeb, M.; Fraser, C.S.; Lua, G., 2013. Integration of lidar data and orthoimage for automatic 3D building roof plane extraction. In.: IEEE International Conference on Multimedia and Expo (ICME 2014), pp. 1-6.
Baltsavias, E. P., 1999. A comparison between photogrammetry and laser scanning. ISPRS Journal of Photogrammetry and Remote Sensing, 54(1), pp. 83-94.
Benali, A.; Deneche, H.; Belhadj, S.; Adnane, A.; Amar, R. H. E., 2014. Buildings extraction of very high spatial resolution satellite images. In.: ICMCS 2014, pp. 277-282.
Cheng, L.; Gong, J.; Li, M.; Liu, Y., 2011. 3D Building Model Reconstruction from Multi-view Aerial Imagery and Lidar Data. Photogrammetric Engineering and Remote Sensing, 77(2), pp. 125-138.
Galvanin, E. A. S.; Dal Poz, A. P., 2012. Extraction of Building Roof Contours from LiDAR Data Using A Markov-Random-Field-Based Approach. IEEE Transaction on Geosciences and Remote Sensing, 50, pp. 981-987.
Haala, N.; Brenner, C., 1999. Extraction Of Buildings And Trees In Urban Environments. ISPRS Journal of Photogrammetry and Remote Sensing (54), pp. 130-137.
Jaw, J. J.; Cheng, C. C., 2008. Building Roof Reconstruction by Fusing Laser Range Data and Aerial Images. In: Proceedings of the International Archives of the Photogrammetry, Remote Sensing and Spatial Information Sciences, Beijing, China.
Kaartinen, H.; Hyyppä, J.; Gülch, E.; Vosselman, G. et al., 2005. Accuracy of the 3D City Model: EuroSDR Comparison. In: Proceedings of the International Archives of the Photogrammetry, Remote Sensing and Spatial Information Sciences.
Kim, C.; Habib, A., 2009. Object-Based Integration of Photogrammetric and LiDAR Data for Automated Generation of Complex Polyhedral Building Models. Sensor, 9 pp. 5679-5701.
Liu, C.; Shi, B.; Yang, X.; Li, N.; Wu., H., 2013. Automatic Buildings Extraction From LiDAR Data in Urban Area by Neural Oscillator Network of Visual Cortex. IEEE Journal of Selected Topics in Applied Earth Observations and Remote Sensing, 6(4), pp. 2008 – 2019.
Müller, D. S.; Zaum, W., 2005. Robust Building Detection in Aerial Images. In: Proceedings of the International Archives of the Photogrammetry, Remote Sensing and Spatial Information Sciences.
Sirmaçek, B.; Ünsalan, C. A., 2011. Probabilistic Framework to Detect Buildings in Aerial and Satellite Images. IEEE Transaction on Geosciences and Remote Sensing, 49(1), pp. 211-221.
Sellaouti, A.; Hamouda, A.; Deruyver, A.; Wemmert, C., 2014. Template-based hierarchical building extraction. IEEE Geoscience and remote Sensing Letters, 11(3), pp. 706-710.
Sohn, G.; Dowman, I. J., 2003. Building Extraction Using Lidar DEMs and Ikonos Images. In: Proceedings of the International Archives of the Photogrammetry, Remote Sensing and Spatial Information Sciences, Dresden, Germany.
Vosselman, G., 2002. Fusion of Laser Scanning Data, Maps, and Aerial Photographs for Building Reconstruction. In: Proceedings of the IEEE International Symposium on Geosciences and Remote Sensing, Toronto, Canada.
Wei, S., 2008. Building Boundary Extraction Based on LiDAR Point Clouds Data. In: Proceedings of the International Archives of the Photogrammetry, Remote Sensing and Spatial Information Sciences.