SRef-ID: 1684-9981/nhess/2004-4-153
© European Geosciences Union 2004
and Earth
System Sciences
Estimation uncertainty of direct monetary flood damage to buildings
B. Merz1, H. Kreibich1, A. Thieken1, and R. Schmidtke2
1GeoForschungsZentrum Potsdam, Section Engineering Hydrology, Potsdam, Germany 2Bayerisches Landesamt f¨ur Wasserwirtschaft, Munich, Germany
Received: 11 September 2003 – Revised: 12 September 2003 – Accepted: 13 September 2003 – Published: 9 March 2004 Part of Special Issue “Landslide and flood hazards assessment”
Abstract.Traditional flood design methods are increasingly
supplemented or replaced by risk-oriented methods which are based on comprehensive risk analyses. Besides meteoro-logical, hydrological and hydraulic investigations such anal-yses require the estimation of flood impacts. Flood impact assessments mainly focus on direct economic losses using damage functions which relate property damage to damage-causing factors. Although the flood damage of a build-ing is influenced by many factors, usually only inundation depth and building use are considered as damage-causing factors. In this paper a data set of approximately 4000 dam-age records is analysed. Each record represents the direct monetary damage to an inundated building. The data set cov-ers nine flood events in Germany from 1978 to 1994. It is shown that the damage data follow a Lognormal distribution with a large variability, even when stratified according to the building use and to water depth categories. Absolute depth-damage functions which relate the total depth-damage to the water depth are not very helpful in explaining the variability of the damage data, because damage is determined by various pa-rameters besides the water depth. Because of this limitation it has to be expected that flood damage assessments are associ-ated with large uncertainties. It is shown that the uncertainty of damage estimates depends on the number of flooded build-ings and on the distribution of building use within the flooded area. The results are exemplified by a damage assessment for a rural area in southwest Germany, for which damage esti-mates and uncertainty bounds are quantified for a 100-year flood event. The estimates are compared to reported flood damages of a severe flood in 1993. Given the enormous un-certainty of flood damage estimates the refinement of flood damage data collection and modelling are major issues for further empirical and methodological improvements.
Correspondence to:B. Merz ([email protected])
1 Introduction
Traditional flood design methods are increasingly supple-mented or replaced by risk-oriented methods which are based on comprehensive risk analyses. In the context of risk-oriented design, flood risk encompasses the flood hazard (i.e. extreme events and associated probability) and the conse-quences of flooding. Flood risk analysis has to take into ac-count all relevant flooding scenarios, their associated prob-abilities, their physical effects and should yield the full dis-tribution function of the flood consequences. Besides me-teorological, hydrological and hydraulic investigations such analyses require the estimation of flood impacts.
Usually, flood impact assessments are limited to detrimen-tal impacts even though there may be positive consequences, e.g. the replenishment of groundwater or the maintenance of high biological diversity in floodplains due to inundations. Flood damages can be classified into direct and indirect dam-age. Direct damages are those which occur due to the phys-ical contact of the flood water with humans, property or any other objects. Indirect damages are damages which are in-duced by the direct impacts and may occur – in space or time – outside the flood event. Examples are disruption of traffic, trade and public services. Usually, both types of damages are further classified into tangible and intangible damage, de-pending on whether or not these losses can be assessed in monetary values (Smith and Ward, 1998).
Paderborn (1988)
Straubing-Bogen (1988)
Mühldorf (1985) Rosenheim (1985)
Cochem-Zell (1983)
Main-Tauber-Kreis (1984) Neckar-Odenwald-Kreis (1993)
Rhein-Neckar-Kreis (1994)
Ortenaukreis (1978, 1983)
Seckach-Area HOWAS flood events
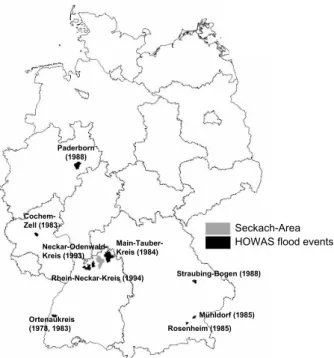
Fig. 1.Flood events of the German flood damage data base HOWAS
and the test area Seckach
Green, 2000) these damage categories are not treated here. The present study is limited to direct monetary flood dam-age to buildings, the only damdam-age type for which a large data base exists in Germany.
A central idea in flood damage estimation is the concept of damage functions or loss functions. Such functions give the building damage due to inundation. Most damage models have in common that the direct monetary damage is obtained from the type or use of the building and the inundation depth (Wind et al., 1999; NRC, 2000). This concept is supported by the observation of Grigg and Helweg (1975) “that houses of one type had similar depth-damage curves regardless of actual value”. Such depth-damage functions are seen as the essential building blocks upon which flood damage assess-ments are based and they are internationally accepted as the standard approach to assessing urban flood damage (Smith, 1994).
Usually, building-specific damage functions are developed by collecting damage data in the aftermath of a flood. An-other data source are “what-if analyses” by which the dam-age which is expected in case of a certain flood situation is estimated, e.g. “Which damage would you expect if the wa-ter depth was 2 m above the building floor?”. On the base of such actual and synthetic data generalized relationships between damage and flood characteristics have been derived for different regions. Probably the most comprehensive ap-proach has been the Blue Manual of Penning-Rowsell and Chatterton (1977) which contains stage-damage curves for both residential and commercial property in the UK.
It is obvious that flood damage depends, in addition to building type and water depth, on many factors. Some of these factors are flow velocity, duration of inundation,
sed-1 2 3 4 5 6 7
0 10 20 30 40 50 60 70
Sectors
Mean damage
[10³
D
M]
Priva
te housi
n
g
Pu
bl
ic i
nfrastructure
Services sector Mining and building indus
try
Manufacturing
Agriculture and f
o
restry
Gar
a
ges
Damage to building structure Damage to fixed inventory Damage to movable inventory
Fig. 2.Mean damage (total damage, damage to building structure,
damage to fixed inventory, damage to movable inventory) per eco-nomic sector
iment concentration, availability and information content of flood warning, and the quality of external response in a flood situation (Smith, 1994; Penning-Rowsell et al., 1994; US-ACE, 1996). Although a few studies give some quantitative hints about the influence of other factors (Smith, 1994; Wind et al., 1999; Penning-Rowsell and Green, 2000; IKSR, 2002) there is no comprehensive approach for including such fac-tors. Wind et al. (1999) state that “flood damage modelling is a field which has not received much attention and the the-oretical foundations of damage models should be further im-proved”. Given this situation the uncertainty of flood damage estimations is expected to be high.
Since it has been shown that ignoring uncertainty can lead to decisions different from more informed decisions using uncertainty estimates (USACE, 1992; Peterman and Ander-son, 1999) the uncertainty of flood damage estimates should be quantified. Therefore the present paper quantifies the un-certainty which is associated with flood damage estimates. This uncertainty analysis is built upon the most comprehen-sive flood damage data set which is available in Germany.
2 Data set
Table 1.Information used from the flood damage data base HOWAS.
Event & Information about the flood event and the location of the building (year of the flood event, community etc.) Location
Building use Buildings are classified into 6 economic sectors: 1. private households
2. public infrastructure (e.g. transformer station, schoolhouse, fire station) 3. services sector (e.g. supermarket, restaurant)
4. mining and building industry (e.g. civil engineering, carpentry, installers workshop) 5. manufacturing (e.g. beverage industry, metal processing, wood processing) 6. buildings for agriculture, forestry and horticulture
Building use is specified by a 4-digit number, e.g.: 1000: private households
1100: single building, bungalow 1110: solid structure, built before 1924 1111: no cellar, no garage
2000: public infrastructure 2181 : post office
2628: architectural/cultural monuments
Water stage Height above the ground floor or height above the cellar floor (if the water flooded only the cellar)
Damage Damage is split in:
→Cellar: damage to building fabric, fixed inventory and movable inventory →Storeys: damage to building fabric, fixed inventory and movable inventory →Damage to grounds
0.010 0.1 1 10 100 1000 10000 100
200 300 400
Damage [10³ DM]
absol
ute frequency
Total damage
0.010 0.1 1 10 100 1000 10000 100
200 300 400
Damage [10³ DM]
absol
ute frequency
Damage to buildings
0.010 0.1 1 10 100 1000 10000 100
200 300 400
Damage [10³ DM]
absol
ute frequency
Damage to fixed inventory
0.010 0.1 1 10 100 1000 10000 100
200 300 400
Damage [10³ DM]
absol
ute frequency
Damage to movable inventory
CV = 358% CV = 281%
CV = 535% CV = 628%
(a) (b)
(c) (d)
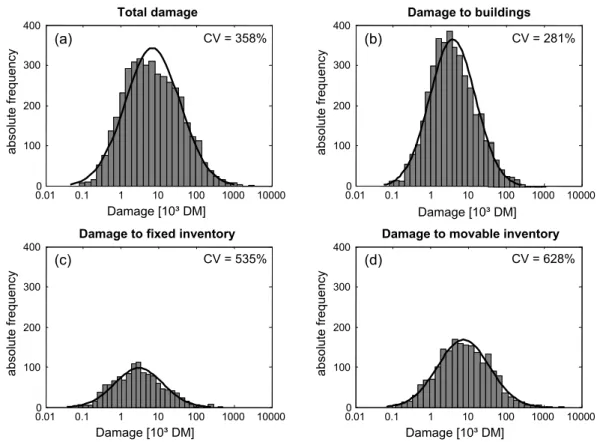
Fig. 3.Histograms of damage values for total damage(a), damage to building structure(b), fixed inventory(c)and movable inventory(d)
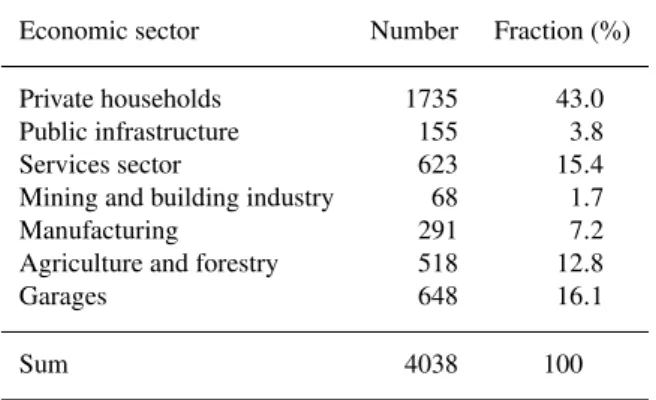
Table 2.Number of damage records in HOWAS per economic sec-tor.
Economic sector Number Fraction (%)
Private households 1735 43.0
Public infrastructure 155 3.8
Services sector 623 15.4
Mining and building industry 68 1.7
Manufacturing 291 7.2
Agriculture and forestry 518 12.8
Garages 648 16.1
Sum 4038 100
Each data set of HOWAS contains information about one flood-affected building. Table 1 lists the information given for each building and flood event. Some other interesting parameters (reinstatement value, floor space etc.) are not available for all records. Therefore, the study is limited to the items given in Table 1. Damages to buildings have to be interpreted as restoration costs, those concerning inven-tory as replacement costs. All costs are given in German Mark and have been converted to the year 1991. Conversion factors are the price indexes for construction works on resi-dential buildings published by the Federal Statistical Office Germany. It has to be stressed that the HOWAS data base contains absolute damage values. Since there is no access to the information about the value of the buildings it is not possible to derive relative damage statements, expressing the expected damage as fraction of the value of the building fab-ric and the inventory.
Table 2 shows the number of data sets per economic sec-tor. More than 40% of all records belong to the sector private housing. Due to their large number garages have been anal-ysed separately.
3 Variability of flood damages
3.1 Descriptive statistics of flood damage records
HOWAS differentiates between damage to building structure, damage to fixed inventory and damage to movable inventory. Figure 2 shows the mean value of those damage fractions for the economic sectors. The total damage and the damage fractions vary significantly from sector to sector. The largest damage occurs in the sector “public infrastructure”, followed by the sector “manufacturing”. Although the total damage is similar for both sectors, the damage fractions are very dif-ferent. The damage of the sector “public infrastructure” is dominated by the damage to the building structure, whereas the main share of the damage of the sector “manufacturing” results from the damage to the movable inventory. This is probably due to complex, large buildings and constructions in the sector “public infrastructure” and to sophisticated,
spe-cial machinery and equipment in the sector “manufacturing”. In contrast are the generally relatively simple buildings for “agriculture and forestry” or even “garages” with basic or no inventory. Thus “garages” and “agriculture and forestry” show the smallest mean damage values and in both sectors nearly no damage to fixed inventory occurs. In summary, the mean values (for the total damage and the damage fractions) are comprehensible.
Figure 3 shows the histograms of the damage values for (a) total damage of a flood-affected building, and split into the fractions (b) damage to building structure, (c) damage to fixed inventory and (d) damage to movable inventory. Since the samples are positively skewed their logarithms were plot-ted. The samples follow more or less a Lognormal distribu-tion. This observation is not only valid for the complete data set but also for the samples of the different economic sectors. Figure 3 also illustrates the large variability in the data set. The coefficient of variation (CV) varies between 281% for the damage to building structure and 628% for the damage to movable inventory. This large variability is not surprising due to the fact that the data base contains very different ob-jects which were damaged under various conditions. To re-duce this large variability the complete data set was divided into different subsets. Due to space restrictions only the anal-ysis of the total damage values is presented. The results for the damage fractions are not shown here.
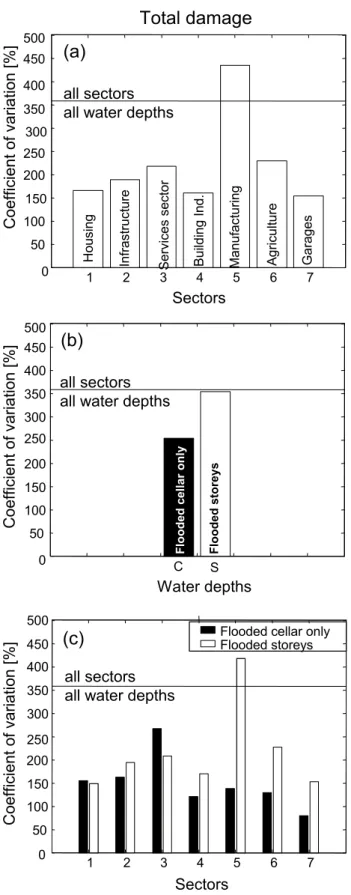
Figure 4 illustrates the variability of the total damage when the data set is divided according to (a) the building use, (b) the water depth category and (c) both, the building use and the water depth category. The variability of the complete data set (CV=358%) is clearly reduced by considering the building use. For six sectors the CV varies between 154 and 230%. The only exception is the sector “manufacturing” with a CV of 434%. A reduction of the variability is also obtained when the data set is divided according to the water depth category, i.e. when the flood water affected only the cellar (“flooded cellar only”) or when the inundation also affected the storeys (“flooded storeys”). The combination of both cri-teria divides the complete data set in 14 subsets (7 building uses and 2 water depth categories) which are given in Table 3. With the exception of the subset “manufacturing; flooded storeys” the variability of all subsets is significantly reduced. Further divisions, i.e. consideration of more detailed build-ing use or finer water depth categories, did not reduce the variability (data not shown).
3.2 Depth-damage functions
1 2 3 4 5 6 7 0 50 100 150 200 250 300 350 400 450 500 Sectors Coef fi
cient of vari
ation [%]
Flooded cellar only Flooded storeys
all sectors all water depths
(c)
0 50 100 150 200 250 300 350 400 450 500 Water depths Coef ficient of vari
ation [%]
all sectors all water depths
C S Floo de d c e lla r only Floo de d s tore y s
(b)
1 2 3 4 5 6 7
0 50 100 150 200 250 300 350 400 450 500 Sectors
Total damage
all sectors all water depthsH ous ing Infrastruc tu re Bu ild ing Ind. S e rvices se ct or Manufac tu ri ng Ag ri c u lt u re Ga rages
(a)
Coefficient of v
a
ri
atio
n
[%]
Fig. 4.Decrease of variability by dividing the damage data
accord-ing to buildaccord-ing use(a), water depth category(b)or both(c).
Table 3.Subsets of the HOWAS data base.
Subset Number Mean CV
damage (%) (103DM)
Private households; 831 13 155
flooded cellar only
Private households; 904 30 149
flooded storey
Public infrastructure; 34 65 162
flooded cellar only
Public infrastructure; 121 79 194
flooded storey
Services sector; 123 37 266
flooded cellar only
Services sector; flooded storey 500 73 208
Mining and building industry; 9 41 120
flooded cellar only
Mining and building industry; 59 25 169 flooded storey
Manufacturing; 39 17 137
flooded cellar only
Manufacturing; flooded storey 252 74 418
Agriculture and forestry; 34 3 129
flooded cellar only
Agriculture and forestry; 484 8 227
flooded storey
Garages; flooded cellar only 23 2 79
Garages; flooded storey 625 5 153
All damage records 4038 29 358
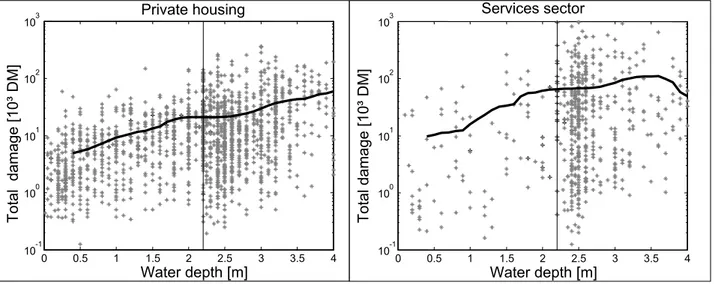
“services sector”. The scatter plot shows an enormous vari-ability, e.g. for a water depth of 1 m the total damage of the sector “private housing” varies from 375 DM to 63 527 DM. Further, the regression illustrates that the water depth ex-plains only a small part of the total variability. This result is in line with other studies which stress the importance of additional damage-influencing factors, besides water depth and building use (Smith, 1994; Penning-Rowsell et al., 1994; USACE, 1996).
0 0.5 1 1.5 2 2.5 3 3.5 4
10-1
100
101
102
103
Water depth [m]
Total
damage
[10³
DM]
Private housing
0 0.5 1 1.5 2 2.5 3 3.5 4
10-1
100
101
102
103
Water depth [m]
Total damage
[10³
DM]
Services sector
Fig. 5. Scatter plot for the economic sectors “private housing” and “services sector” and nonparametric depth-damage functions
(Epanechnikov-kernel, bandwidth = 0.6 m). The line at water depthh = 2.2 m divides the cases where the flood water affected only the cellar (“flooded cellar only”;h <2.2 m) and the cases where the inundation also affected the storeys (“flooded storeys”;h >2.2 m).
4 Quantification of uncertainty of damage estimates
To estimate flood damage we assume that the HOWAS data base is representative for flood damages in Germany and that we may transfer the HOWAS data within Germany. Because the depth-damage functions derived in Sect. 3.2 explain only a small part of the variability the mean values of the 14 sub-sets (Table 3) were further used for this purpose. For a given flood scenario all inundated buildings within the flooded area, their building use and their water depth are determined. Then the total flood damagedis estimated as:
d=
14
X
j=1
njdj (1)
wherenj is the number of buildings of the subsetj in the
flooded area, anddjis the mean damage of the subsetj.
Given the large variability of the damage data the uncer-tainty of building-specific damage estimates may be very large. Fortunately, in most cases it is not necessary to es-timate the damage for single buildings, but eses-timates are needed for larger areas, e.g. river reaches or towns, contain-ing many buildcontain-ings. Figure 6 shows the 2.5 and 97.5% per-centiles for the total damage depending on the number of flooded buildings. Exemplarily the sectors “private housing” (a) and “manufacturing” (b) both divided into the water depth categories: “flooded cellar only” and “flooded storeys” are presented. The percentiles were calculated by a Monte Carlo simulation. For a given numbermof affected buildings 105 values were randomly generated from the statistical proper-ties of the subset. This sample was divided inksubsamples of sizem (k×m= 105). Then mean values for each sub-sample were calculated. From the resulting sub-sample of sizek the 2.5 and 97.5% percentiles were extracted. This numeri-cal approach was chosen due to the more realistic results of
only positive damage values in contrast to confidence inter-vals assuming a normal distribution. The percentile-curves are skewed since all values are≥0.
For example, Fig. 6 shows that we have a large uncertainty if we want to estimate the flood damage of a single building of the use “private housing” with water in the storey. With a probability of 95% the true but unknown damage is be-tween 700 and 212 000 DM. The uncertainty of damage es-timates decreases with increasing number of flooded build-ings as shown in Fig. 6. Due to the different variances of the subsets, the magnitude of the uncertainty reduction dif-fers between the sectors. For instance, the uncertainty of a flood estimate for an industrial area is much larger than for a residential area when the same number of buildings is af-fected. With these confidence intervals, the minimal number of flooded buildings for reliable damage estimation in an area of interest can be given. For example, if we want to have a 95% confidence interval with a deviation of at most±10% from the total estimated damage in a residential area, the area has to cover a minimum number of 852 buildings with the storeys flooded. On the other hand, the uncertainty of a damage estimation in a specific area with a certain amount of affected buildings can be determined. For example, if in the study area 2000 residential houses are flooded up to the storeys, with a probability of 95% the true but unknown total damage lies between the estimated value±6.5%.
5 Example applications
5.1 Example Seckach area
0
100
200
300
400
500
600
700
800
900
1000
10
-110
010
110
210
3(a) Private housing
Total damage
[10³ DM]
0
100
200
300
400
500
600
700
800
900
1000
10
-110
010
110
210
3Total
d
amage
[10³ DM]
(b) Manufacturing
Flooded storeys
Flooded cellar only
Number of affected buildings
Fig. 6.2.5 and 97.5% percentiles for the total damage of four subsets depending on the number of flooded buildings obtained by Monte-Carlo
simulation. The sectors “private housing”(a)and “manufacturing”(b)both divided into the water depth categories “flooded cellar only” and “flooded storeys” are shown.
Table 4.Number and share of residential, commercial and industrial buildings with an inundated area of more than 15 m2for the 100–year
flood scenario.
Economic Residential Services/Commerce Manufacturing/Industry Total
Sector buildings
Site Buildings Share Buildings Share Buildings Share Buildings
Adelsheim 149 69% 18 8% 50 23% 217
Buchen 32 78% 2 5% 7 17% 41
M¨ockm¨uhl 59 63% 29 31% 6 6% 94
Osterburken 46 53% 18 21% 23 26% 87
Roigheim 3 14% 2 9% 17 77% 22
Rosenberg 37 76% 3 6% 9 18% 49
0.0 3.0 6.0 9.0 12.0 15.0 18.0 21.0
0.0 3.0 6.0 9.0 12.0 15.0 18.0 21.0
Reported Flood Damage 1993 [Mill. DM]
Estimated
Damag
e
HQ100 [M
ill. DM
]
median mean
2.5-fractile 0.5-fractile 97.5-fractile 99.5-fractile
Möckmühl
Roigheim Adelsheim
Osterburken Seckach
Buchen Rosenberg
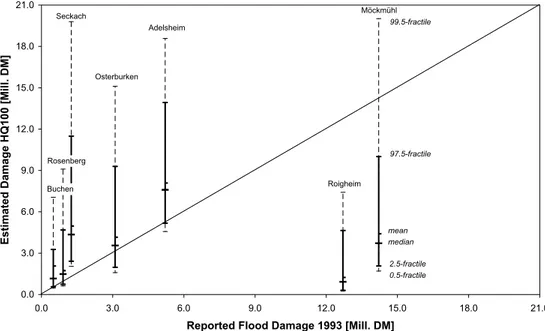
Fig. 7.Estimated flood damages versus reported flood damages for a 100–year flood in seven rural communities.
Table 5.Mean damages in the HOWAS data base and during the 1993 flood.
HOWAS Insured losses in Not insured losses Insured flood losses in Flood losses in data base Seckach/Kirnau Seckach/Kirnau Baden-W¨urrtemberg 1993 Rheinland-Pfalz 1993
1993 1993 (Bayerische R¨uck, 1994) (Bayerische R¨uck, 1994)
Residential buildings 22 050 DM 14 050 DM 8 650 DM
Commerce 65 600 DM 51 170 DM 46 440 DM
Industry 66 200 DM 25 590 DM
No differentiation of 29 440 DM 16 470 DM 69 090 DM 16 000 DM 15 000 DM
building use Variation per region: Variation per region:
3 000–27 000 DM 6 930–50 410 DM
flood damages and notifications of claims were provided by the municipalities and a regional building insurance com-pany, respectively. From the municipalities flood damages were especially collected in the industrial and commercial sector, whereas the insurance data mainly contains damages to residential buildings.
To optimise the flood defence system, flood scenarios for return periods of 10, 20, 50, 100, 200, 500 and 1000 years were calculated for the urban areas in the Seckach area for the current flood defence as well as for improved flood pro-tection. The sites belong to seven municipalities (Adelsheim, Buchen, M¨ockm¨uhl, Osterburken, Roigheim, Rosenberg and Seckach).
The estimation of the total flood damage per municipality and its associated uncertainty was carried out for the inun-dation scenario of the 100–year flood. Flood damage and its uncertainty was estimated per economic sector based on the HOWAS data analysis without consideration of inundation
0 20 40 60 80 100 120 140 160 180 200
HQ10 (n = 9) HQ20 (n = 57)
HQ50 (n = 77)
HQ100 (n = 87)
HQ200 (n = 106)
HQ500 (n =120)
HQ1000 (n = 129)
Uncertainty = IQR / Median * 100 [%]
Scenario 1: R/C/I = 75/5/20% Scenario 2: R/C/I = 15/10/75% Scenario 3: R/C/I = 60/30/10%
Fig. 8.Influence of building use composition on the uncertainty of flood damage estimates for different return periods. Considered economic
sectors: private housing, services sector and manufacturing.
Such a comparison was only possible for residential build-ings, the services sector and manufacturing.
The mean and median estimates for the total damage per municipality as well as their 95%- and 99%-confidence in-tervals are shown in Fig. 7. This example illustrates the large uncertainty in flood damage estimation. The reported flood damages of four municipalities are situated within the limits of the 95% confidence interval, five reported flood damages lie within the range of the 99% confidence interval, whereas in two municipalities the reported flood damages lie even outside the 99% confidence interval.
While our estimates for Roigheim and M¨ockm¨uhl tend to be too low due to a high percentage of industrial and com-mercial buildings (see below), our calculations tend to over-estimate the damages in the remaining municipalities. One reason for this might be that the mean damages per sector based on the HOWAS data base are higher than the mean in-sured losses in our investigation area (Table 5). The mean losses in the Seckach area are in the same order of magni-tude as the average loss due to the 1993 flood in whole Fed-eral State of Baden-W¨urttemberg and Rhineland-Palatinate (Table 5).
Especially in the sector manufacturing the variability is most likely higher than the range covered in HOWAS. Whereas in HOWAS the highest damage in the indus-trial sector is 3.43 Mill. DM, the highest insured flood loss of the 1993 flood was twice as much in Baden-W¨urttemberg (7 Mill. DM, Bayerische R¨uck, 1994) and the highest reported industrial damage was nearly fourfold (12.2 Mill. DM) in the Seckach area (at site Roigheim). Therefore it has to be concluded that the HOWAS data base is not totally representative for flood damages in Germany and should be enlarged.
An additional source of uncertainty results from the as-sumption that the damages of the 1993–flood can be com-pared to the damages of the 100–year flood scenario. Flood frequency analysis based on data from one discharge gauge in the Seckach area found that the 1993–flood had a return period of approximately 100 years. The 100–year scenario is a synthetic scenario based on the design rainfall method. Therefore the inundation area of the 100–year flood scenario might not be equivalent to the inundation area of 1993–flood. There also exists an unknown but probably large uncertainty about the reported flood damage data: one notification of claim might contain several buildings, especially if industrial sites were affected, but we do not have information about the number of buildings per claim. Further, more than one notification of claim could be made in the same building if buildings with a mixed use (e.g. housing and commerce) were involved. Moreover, it is unclear whether or not all damages (i.e. damages to buildings as well as to inventory) were included in the insurance data and whether or not de-ductibles must be added. Wind et al. (1999) estimate that the uncertainty concerning the number of reported flood dam-ages amounts to 20% while the uncertainty of object-specific flood damage estimation amounts to 20–40%. For a better comparability of actual and estimated flood losses, it is of particular importance that flood damage data are collected whenever possible and that the procedure of data collection is transparent and follows an accepted standard.
5.2 Influence of building use on the uncertainty of damage estimation
demonstrated using inundation scenarios for different return periods and three synthetic building composition scenarios. The building composition scenarios are based on Table 4. The first scenario reflects the situation in Adelsheim, Buchen and Rosenberg, i.e. residential, commercial and industrial buildings are assumed to cover 75%, 5% and 20% of the affected buildings, respectively. The second scenario illus-trates the situation in Roigheim with 15% residential, 10% commercial and 75% industrial buildings. In the third sce-nario buildings are composed according to M¨ockm¨uhl and Seckach with 60% residential, 30% commercial and 10% in-dustrial buildings.
Figure 8 shows the influence of the building composition on the uncertainty of the damage estimation (measured as the interquartile range / median * 100; IQR/M) for scenarios of different return periods. The more severe the inundation scenario, the higher is the number of affected buildings and thus the lower is the uncertainty of the damage estimation. A high percentage of residential buildings (scenario 1) yields the smallest uncertainty, whereas a high percentage of in-dustrial buildings (scenario 2) or a moderate percentage of commercial buildings (scenario 3) cause an increase in un-certainty. That means that flood damages can be estimated most reliable in residential areas. To reach a comparable re-liability of estimation in an area dominated by industry or commerce the number of affected buildings must be higher. For example, IQR/M of 80% is reached with 57 buildings for the building composition dominated by residential build-ings (scenario 1), whereas the scenario with 30% commercial buildings (scenario 3) needs 87 buildings to reach the same reliability. In general, the quality of the damage estimate de-pends on how well the used data base represents the actual building mix in the study area. That means, the smaller the flood-prone river corridor, the more accurate has to be the damage data selection used for generating site specific statis-tical information.
6 Conclusions
This paper analyses a data set of approximately 4000 flood damage records. Each record represents the direct tangible damage to an inundated building. The analysis shows that the damage data follow a Lognormal distribution with large vari-ability. The consideration of building use and water depth, by dividing the data set into subsets, partly reduces the variabil-ity of the data. Since the remaining variabilvariabil-ity is still consid-erable it is concluded that more damage-influencing factors have to be taken into account to accurately estimate flood damages. The classification according to economic sectors may be a good approach for damage to inventory. For dam-age to building structure a division of the damdam-age data ac-cording to building types (timber structure, masonry, con-crete buildings etc.) may lead to better results. Further, it is shown that absolute depth-damage functions which relate the total damage to the water depth are not very helpful in explaining the variability of the damage data, because
dam-age is determined by various parameters besides the water depth. It is expected that relative depth-damage functions which give the degree of damage as a function of water depth are more appropriate, since they are at least independent from the absolute values of buildings and inventory.
The paper quantifies the uncertainty which is associated with damage estimates using statistical information. It is shown that the uncertainty depends on the number of flooded buildings and on the distribution of building use within the flooded area. Statistically derived damage estimates for single buildings are extremely problematic due to the high uncertainty. For economic sectors with high variability, e.g. manufacturing, specific local information may be essential. For larger or very special objects it is necessary to derive damage estimates through personal interviews with plant managers, property owners etc. (Smith, 1994; USACE, 1996; Booysen et al., 1999). Given the enormous uncertainty of flood damage estimates, cost-benefit analyses for flood defence schemes may be highly uncertain. In view of these results the refinement, standardisation and validation of flood damage data collection and modelling are major issues for further improvements.
Edited by: L. Garrote
Reviewed by: A. R. Black and another referee
References
Bayerische R¨uck: Das Weihnachtshochwasser 1993/94 in Deutsch-land, Sonderdruck 16, M¨unchen, 1994.
Bennet, G.: Bristol floods 1968: controlled survey of effects on health of local community disaster, Br. Med. J., 3, 454–458, 1970.
Booysen, H. J., Viljoen, M. F., and de Villiers, G.: Methodology for the calculation of industrial flood damage and its application to an industry in Vereeniging, Water SA, 25(1), 41–46, 1999. Brown, C. A. and Graham, W. J.: Assessing the threat to life from
dam failure, Water Resour. Bull., 24, 1303–1309, 1988. BUWAL (Bundesamt f¨ur Umwelt, Wald und Landschaft):
Risiko-analyse bei gravitativen Naturgefahren, Umwelt-Materialien 107/l, Bern, 1999.
DeKay, M. L. and McClelland, G. H.: Predicting loss of life in case of dams failure and flash flood, Risk Anal., 13(2), 193–205, 1993.
FEMA (Federal Emergency Management Agency): Costs and ben-efits of natural hazard mitigation, Federal Emergency Manage-ment Agency, Washington D. C., 1998.
Funnemark, E., Odgaard, E., Svendsen. V. N., and Amdal, T.: Con-sequence analysis of dam breaks, in: Dam safety, Balkema, edited by Berga, L., Rotterdam, 329–336, 1998.
Green, C. H. and Penning-Rowsell, E. C.: Flooding and the quan-tification of “intangibles”, J. Instn. Wat. & Envir. Mangt., 3(1), 28, 1989.
Green, C. H., Penning-Rowsell, E. C., and Parker, D. J.: Estimating the risk from flooding and evaluating worry, in: Uncertainty in risk assessment, management, and decision making, edited by Covello, V. T., Lave, L. B., Moghissi, A. and Uppuluri, V. R. R., Plenum Press, New York, London, 159–175, 1987.
H¨ardle, W.: Applied nonparametric regression, Cambridge Univer-sity Press, Cambridge, 1990.
IKSR (International Commission for the Protection of the Rhine): Non structural flood plain management. Measures and their ef-fectiveness, International Commission for the Protection of the Rhine, Koblenz, 2002.
Krug, E. G., Kresnow, M.-J., Peddicord, J. P., Dahlberg, L. L., Pow-ell, K. E., Crosby, A. E., and Annest, J. L.: Suicide after natural disasters, New Engl. J. Med., 338(6), 373–378, 1998.
Montz, B. E.: The effects of flooding on residential property val-ues in three New Zealand communities, Disasters, 16, 283–298, 1992.
NRC (National Research Council): Risk analysis and uncertainty in flood damage reduction studies, National Academy Press, Wash-ington D. C., 2000.
Olsen, J. R., Beling, P. A., Lambert, J. H., and Haimes, Y. V.: Input-output economic evaluation of system of levees, J. Water Res. Pl-ASCE, 9/10, 237–245, 1998.
Parker, D. J., Green, C. H., and Thompson, P. M.: Urban flood protection benefits: A project appraisal guide, Gower Technical Press, Aldershot, 1987.
Penning-Rowsell, E. C. and Chatterton, J. B.: The benefits of flood alleviation: A manual of assessment techniques, Gower Techni-cal Press, Aldershot, 1977.
Penning-Rowsell, E. C. and Fordham, M.: Floods across Europe: Flood hazard assessment, modelling and management, Middle-sex University Press, London, 1994.
Penning-Rowsell, E. C. and Green, C.: New Insights into the ap-praisal of flood-alleviation benefits: (1) Flood damage and flood loss information, J. Chart. Inst. Water E., 14, 347–353, 2000.
Penning-Rowsell, E. C., Fordham, M., Correia, F. N., Gardiner, J., Green, C., Hubert, G., Ketteridge, A.-M., Klaus, J., Parker, D., Peerbolte, B., Pfl¨ugner, W., Reitano, B., Rocha, J., Sanchez-Arcilla, A., Saraiva, M. d. G., Schmidtke, R., Torterotot, J.-P., Van der Veen, A., Wierstra, E., and Wind, H.: Flood haz-ard assessment, modelling and management: Results from the EUROflood project, in: Floods across Europe: Flood hazard assessment, modelling and management, edited by Penning-Rowsell, E. C. and Fordham, M., Middlesex University Press, London, 1994.
Peterman, R. M. and Anderson, J. L.: Decision analysis: a method for taking uncertainties into account in risk-based decision mak-ing, Hum. Ecol. Risk Assess., 5(2), 231–244, 1999.
Smith, D. I.: Flood damage estimation – A review of urban stage-damage curves and loss functions, Water SA, 20(3), 231–238, 1994.
Smith, K. and Ward, R.: Floods: Physical processes and human impacts, John Wiley and Sons, Chichester, 1998.
USACE (U.S. Army Corps of Engineers): Guidelines for risk and uncertainty analysis in water resources planning, Institute for Water Resources, IWR Report 92-R-1, Fort Belvoir, VA, 1992. USACE (U.S. Army Corps of Engineers): Risk-based analysis for
flood damage reduction studies, Engineering Manual 1110–2– 1619, Washington D. C., 1996.