Submitted25 July 2016
Accepted 20 December 2016
Published8 February 2017
Corresponding author
Stevens K. Rehen, [email protected]
Academic editor
David Reser
Additional Information and Declarations can be found on page 20
DOI10.7717/peerj.2927
Copyright
2017 Sartore et al.
Distributed under
Creative Commons CC-BY 4.0
OPEN ACCESS
Trace elements during primordial
plexiform network formation in human
cerebral organoids
Rafaela C. Sartore1,2, Simone C. Cardoso3, Yury V.M. Lages1,2, Julia M.
Paraguassu1,2, Mariana P. Stelling4, Rodrigo F. Madeiro da Costa1,
Marilia Z. Guimaraes1,2, Carlos A. Pérez5and Stevens K. Rehen1,2 1D’Or Institute for Research and Education (IDOR), Rio de Janeiro, Brazil
2Institute of Biomedical Sciences, Federal University of Rio de Janeiro, Brazil 3Physics Institute, Federal University of Rio de Janeiro, Brazil
4Federal Institute of Education, Science and Technology of Rio de Janeiro, Brazil 5Brazilian Synchrotron Light Laboratory, São Paulo, Brazil
ABSTRACT
Systematic studies of micronutrients during brain formation are hindered by restric-tions to animal models and adult post-mortem tissues. Recently, advances in stem cell biology have enabled recapitulation of the early stages of human telencephalon development in vitro. In the present work, we analyzed cerebral organoids derived from human pluripotent stem cells by synchrotron radiation X-ray fluorescence in order to measure biologically valuable micronutrients incorporated and distributed into the exogenously developing brain. Our findings indicate that elemental inclusion in organoids is consistent with human brain tissue and involves P, S, K, Ca, Fe and Zn. Occurrence of different concentration gradients also suggests active regulation of elemental transmembrane transport. Finally, the analysis of pairs of elements shows interesting elemental interaction patterns that change from 30 to 45 days of development, suggesting short- or long-term associations, such as storage in similar compartments or relevance for time-dependent biological processes. These findings shed light on which trace elements are important during human brain development and will support studies aimed to unravel the consequences of disrupted metal homeostasis for neurodevelopmental diseases, including those manifested in adulthood.
SubjectsCell Biology, Developmental Biology, Neuroscience
Keywords Trace elements, Cerebral organoids, Development, SR-XRF, Neurogenesis, Human pluripotent stem cells
INTRODUCTION
with other cells. These activities, for the most part, appear to be genetically determined, epigenetically directed, and influenced by the physical and chemical environment of the womb (Georgieff, 2007;Paridaen & Huttner, 2014). Hence, the healthy development of central nervous system (CNS) in the period between the third and seventh week of embryo development is likely to rely on adequate provisions of maternal resources like vitamins or dietary elements.
Nutritional resources available to an embryo in these earliest weeks of life putatively determine some of the most important aspects of future health. One well understood example that relates maternal diet to CNS pathologies is spina bifida, caused by insufficient folic acid in early pregnancy. While less understood, abnormalities in the levels of essential minerals potentially beginin utero(Radlowski & Johnson, 2013;Golub & Hogrefe, 2015). Examples of neurological disorders in which micronutrient imbalances have been identified in adulthood include Alzheimer’s, Parkinson’s, and Huntington’s diseases (Miller et al., 2006;Popescu et al., 2009;Rosas et al., 2012). It is, however, difficult to assess dynamic trace element changes in the developing human brain. Determining expected mineral levels according to developmental stage are of clear importance; however, few studies have successfully addressed this issue. To date, the understanding of mineral inclusion as part of human brain development has only been carried out in post-mortem tissue often involving fixative-treated brains, and inferred from animal models (Wróblewski, Chamberlain & Edström, 1984;Rajan et al., 1997). While analyses on this subject have been conducted on a variety of species, numerous peculiarities including cell types and a distinctive temporal organization make the human brain unique and substantiate the need for in-depth studies of these phenomena in human tissue. One method recently refined to model cellular and molecular events of human embryonic brain development is growing cerebral organoids in vitro (Eiraku et al., 2008;Lancaster et al., 2013). These three-dimensional structures, derived from human pluripotent stem cells, progressively differentiate and self-organize into physiologically relevant cellular niches that mirror the developing human brain.
In the present work, we used synchrotron radiation based micro X-ray fluorescence (SR-XRF) analysis to detect and quantify trace elements present in human cerebral organoids. We sought to capture the levels and the distribution of minerals in brain tissue during a period of intense cell proliferation versus one in which early neuronal network formation was a dominant developmental feature. This work is the first description of chemical elements composition and distribution in human cerebral organoids.
MATERIALS & METHODS
Generation of human induced pluripotent stem cells
by the Research Ethics Committee of Hospital das Clínicas de Porto Alegre (CAPPesq, HCPA, IRB00000921) and by the Research Ethics Committee of Hospital Copa D’Or Rio de Janeiro (CEPCOPADOR, number 727.269).
Human pluripotent stem cells
Human embryonic stem cells (hESC, BR1 cell line) (Fraga et al., 2011) and iPS cells were cultured in mTSeR1 medium (Stemcell Technologies) on Matrigel-coated surface (BD Biosciences). The colonies were manually passaged every seven days and maintained at 37◦C in humidified air with 5% CO
2.
Human cerebral organoids
Pluripotent cell differentiation into cerebral organoids was based in a previously described protocol (Lancaster et al., 2013). However, our protocol was conducted mostly using spinner flasks under continuous rotation. Briefly, human pluripotent stem cells were dissociated with Accutase (Millipore) until obtainment of a single-cell solution. Then, approximately 250,000 cells/mL were inoculated into a spinner flask containing mTeSR1 to final volume of 50 mL, supplemented with 10µM Y-27632 (Rho-associated protein kinases inhibitor, iRock) (Merck, Millipore) under uninterrupted rotation (40 rpm). After 24 h, medium was changed to Dulbecco’s modified eagle medium (DMEM)/F12, supplemented with 20% KnockOutTMSerum Replacement (KOSR, Invitrogen), 2 mM Glutamax (Invitrogen), 1% minimum essential medium nonessential amino acids (MEM-NEAA, Gibco), 55µM 2-Mercaptoethanol (Gibco) and 100 U/mL Penicillin-Streptomycin (Gibco). By day 7, embryoid bodies (EB) were fed with neuroinduction medium composed of DMEM/F12, 1×N2 supplement (Gibco), 2 mM Glutamax (Invitrogen), 1%
MEM-NEAA and 1µg/mL heparin (Sigma) for four days. On day 11, cellular aggregates were transferred to petri dishes and embedded in Matrigel for 1 h at 37◦C and 5% CO
2. Then, cellular aggregates were decanted in a conical tube and returned to a spinner flask containing neurodifferentiation medium composed of 1:1 DMEM/F12: Neurobasal (Gibco), 0.5x N2, 1x B27 minus vitamin A (Gibco), 2 mM Glutamax, 0.5% MEM-NEAA, 0.2µM 2-Mercaptoethanol and 2.5µg/mL insulin. After 4 days, cellular aggregates were grown in the aforementioned medium except by replacing with B27 containing vitamin A (Gibco). The medium was changed every week. Cerebral organoids were grown until 30 days of differentiation (totalizing 15 days in neurodifferentiation medium containing vitamin A) and 45 days (totalizing 30 days in neurodifferentiation medium containing vitamin A) for analyses. The cerebral organoids derived from embryonic stem cells were obtained from two independent assays.
Measurements of cerebral organoid diameter and measurements of epithelium-lined cavities total area and number
organoids derived from hESC was as follows: 7-days old organoids, n=107; 15-days
old organoids,n=90; 30-days old organoids,n=56; 45-days old organoids,n=18,
obtained from two independent experiments. For cerebral organoids derived from iPS cells, the number of cerebral organoids analyzed was as follows: 7-days old organoids, n=8; 15-days old organoids,n=15; 30-days old organoids,n=7; 45-days old organoids,
n=10, obtained from one experiment.
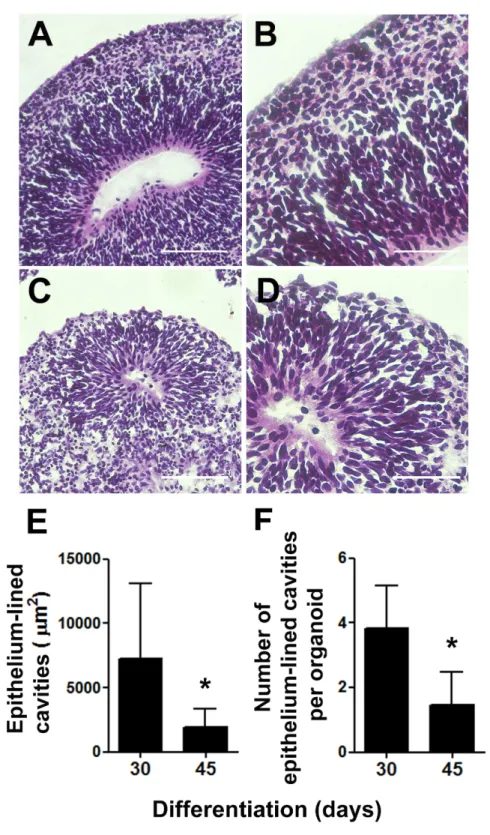
To quantify the number of ventricle-like epithelium-lined cavities and to measure their luminal area, tissue sections were stained with hematoxylin and eosin (H&E). Analyzed structures were only considered as ventricle-like cavities when surrounded by a stratified epithelium containing radially organized cells. The number of independent organoids inspected to establish the number of epithelium-lined cavities per organoid was: 30-days old organoids,n=6; 45-days old organoids,n=11. The luminal area was measured with
ImageJ software, through delimitation with the freehand selection tool. The number of analyzed ventricles was: 30-days old organoids, n=17 sections from six independent
cerebral organoids; 45-days old organoids,n=9 sections from 11 independent cerebral
organoids.
Immunohistochemistry
Cerebral organoids were fixed in 4% paraformaldehyde, sequentially incubated in sucrose solutions (10, 20 and 30%) prepared in phosphate buffered saline (PBS), embedded in optimal cutting temperature compound (OCT) and frozen in liquid nitrogen. The organoids were sectioned with a cryostat (Leica) into 20µm thick sections. Immunofluorescence was performed using the primary antibodies: anti-Nestin (MAB5326; Chemicon), PAX6 (sc11357; Santa Cruz), TBR2 (AB2283; Millipore), anti-class III β-tubulin (T3952; Sigma Aldrich), MAP2 (M1406; Sigma-Aldrich), anti-GAD67 (MAB5406; Chemicon), anti-glutamate (AB133; Chemicon), anti-synaptophysin (MAB368; Chemicon), anti-PSD95 (04-1066; Millipore), and anti-PH3 (06-570; Upstate). Secondary antibodies were used as follows: Alexa Fluor 488 goat anti-mouse (A11001; Invitrogen) and Alexa Fluor 546 goat anti-rabbit (A11010; Invitrogen). DAPI (4′, 6-diamidino-2-phenylindole, 1 mg/mL) was used for nuclei staining. Images were acquired using a high content automated microscope (Operetta; Perkin Elmer).
Positive cells for GAD67 and phosphorylated histone 3 (PH3) staining were quantified in the entire section of cerebral organoids. To quantify glutamate intensity, mean gray value (fluorescence intensity) was measured in three points of each cerebral organoid border, delimited by a rectangular selection. The fluorescence intensity in the cerebral organoids’ edge was normalized for the tissue background and was given as fold increase in basal condition. The numbers of 30 and 45-days independent samples for quantifications were as follows: PH3 positive cells,n=3 andn=5; MAP2 area,n=4 andn=6; GAD67 positive
cells,n=2 andn=4; glutamate fluorescence intensity,n=6 andn=7, respectively.
Synchrotron radiation X-ray fluorescence (SR-XRF) spectroscopy analysis
(transparent to X-ray) and air-dried. Four tissue sections of independent 30-days old cerebral organoids and five sections of independent 45-days old cerebral organoids were analyzed.
The SR-XRF analyses were performed at the D09B X-ray fluorescence beamline at the Brazilian Synchrotron Light Source (Pérez et al., 1999) (Campinas, Brazil) using standard temperature and pressure conditions. Samples were excited by a white beam with energy ranging from 5 keV to 17 keV. An optical system based on a pair of bent mirrors in a Kirkpatrick-Baez arrangement was used to focus the X-ray beam down to 20µm spatial resolution. Each spot was irradiated for one second. A silicon drift detector (KETEK GmbH) with 140 eV (FWHM) at 5.9 keV placed at 90◦from the incident beam was used to collect X-ray fluorescent and scattered radiation coming from samples.
Concentration values in weight fraction units for the elements detected in each pixel of the cerebral organoid slice were determined by the PyMCA software developed by the Software Group of the European Synchrotron Radiation Facility (Solé et al., 2007). After calibrating the spectrometer with a set of pure thin films from MicromatterTMstandards (http://www.micromatter.com), the fundamental parameter method was used (He & Vanespen, 1991). The method predicts the sample matrix effect assuming that the measured primary spectral distribution and excitation-detection geometry are known. The values found in weight fraction units were converted in ppm by multiplying them by a factor 106. The mean concentration value was calculated with the values detected in each pixel analyzed per organoid slice.
Image analyses of trace elements distribution
Elemental concentration information was collected from each pixel to generate corresponding XRF maps. The color gradient heat maps were constructed by plotting the fluorescence intensity at each point of the scan using the PyMca software.
Images of colored gradient heat maps were converted to grayscale images with Adobe Photoshop CS5 by manually adjusting the hue to match the colors’ intensity in RGB images. Then, ImageJ software was used to obtain the intensity profile by drawing a line in sagittal and coronal planes of the organoid images. The generated plot profiles were analyzed in Igor Pro 6 software (Wavemetrics, Lake Oswego, OR, USA) to create curve fittings with polynomial regression of three terms. The resulting curves were classified as concave or convex. If the fitting result gave rise to a line with less than 10 points of inclination, it was considered as a straight line. We assumed concave as peripheral, convex as central and straight as diffused distribution of the elements within cerebral organoids. Four tissue sections of independent 30-days old cerebral organoids and five sections of independent 45-days old cerebral organoids were analyzed.
Elemental correlation analysis
line to each dot plot, generating aR-squared value for each pair of elements. This number was also used as a correlation indicator. A highR-squared above 70% was interpreted as indicator of potentially meaningful associations in paired elements. Finally, color-gradient merged maps were also built using PyMca software, whereas color colocalization indicated elements higher correlation, distinguishable colors were an indicative of unrelated or exclusive elements. Four tissue sections of independent 30-days old cerebral organoids and five sections of independent 45-days old cerebral organoids were analyzed.
Statistical analyses
Quantitative data were reported as mean±S.D. Analyses of statistical significance were
obtained using GraphPad Prism 4 software (GraphPad Software, La Jolla California, USA). Comparisons among organoids at 30 and 45 days of differentiation were conducted with unpaired t-test. Comparisons among organoids at seven, 15, 30, and 45 days of differentiation were analyzed using one-way ANOVA followed by Tukey’s post hoc test.
RESULTS
The growth of human cerebral organoids
Exogenous organogenesis using pluripotent stem cells has emerged as a breakthrough technology to study aspects of human brain development in a dynamic and living state (Lancaster et al., 2013). In our preparations, cerebral organoids’ differentiation from human embryonic stem cells occurred in spinner flasks as represented inFig. 1Aand, by the end of 45 days of differentiation, they presented spheroid morphology (Fig. 1B). In detail, 30-days old organoids demonstrated different hues and internal folding, suggestive of distinct cell layers (Figs. 1Cand1D). A period of accelerated growth was observed between the 7th and the 15th day, followed by a period of stationary growth upon retinoic acid addition (15th to 30th day). Then, cerebral organoids continued to expand in size from day 30 to day 45, when they reached 1,240±365µm in diameter (Fig. 1E). Cerebral organoids derived from
iPS cells also grew in a similar fashion (Figs. S2A–S2C).
As one of our major goals was to generate a cortical anlage from human embryonic stem cellsin vitro, we then examined the cytoarchitecture of the generated cerebral organoids. We focused on two separate time points, 30 and 45 days of differentiation, which corresponded to 15 and 30 days, respectively, of exposure to retinoic acid, a crucial morphogen for neuronal induction derived from vitamin A. Upon 30 days of differentiation, prominent circular structures reminiscent of early ventricles were observed within the organoids (Figs. 2A and2B). Interestingly, following organoids’ maturation, the large epithelium-lined cavities were replaced by narrower ones (Figs. 2Cand2D) of reduced luminal area (Fig. 2E). Also, the number of putative ventricles or epithelium-lined cavities per cerebral organoid decreased from 30 to 45 days of differentiation (Fig. 2F).
Figure 1 Cerebral organoids derived from human embryonic stem cells.(A) Sequential steps involved in the generation of cerebral organoids from human pluripotent stem cells. (B) Spheroid 45-days old cere-bral organoids presenting smooth texture and homogeneous coloring. (C and D) Microphotography of a 30-days old organoid in detail showing distinct hues according to different cell layers. (E) Organoid diam-eter quantification; organoids were measured at different stages of the differentiation process. Organoids’ diameter doubled between days 7 and 15 in culture and quintupled after 45 days. The graph represents mean±S.D.n=107 for 7-days old organoids,n=90 for 15-days old organoids,n=56 for 30-days old
organoids,n=18 for 45-days old organoids.∗∗∗p
<0.0001 for 7-days old versus 15, 30 and 45-days old organoids. Cerebral organoids were obtained from two independent assays. Scale bars: B=1 mm, C=
125µm and D=25µm.
greater cell density and exhibited a radial and outward polarization suggestive of zones of cellular division and migration (Fig. 3B). Indeed, the presence of apical progenitors was characterized by mitotic cells lining the luminal surface, positively stained for PH3 (Fig. 3B), and by the expression of the transcription factor PAX6 in the putative ventricular zone (Fig. 3C). Furthermore, intermediate progenitors expressing the T-box homeobox protein TBR2 were found midway to the putative subventricular zone (SVZ), positioned radially to the luminal surface and adjacent to tangentially migrating neurons (MAP2 positive cells) (Fig. 3D) in a cellular architecture similar to the developing cortical plate in vivo(Lui, Hansen & Kriegstein, 2011). Likewise, in iPS cells derived cerebral organoids, differentiated neurons were observed positioned in the outer rim of the cellular layer around the putative ventricles, whereas neural progenitors occupied the innermost portion (Figs. S2D–S2F).
Figure 2 Cerebral organoids present epithelium-lined cavities morphologically similar to ventricles.
Figure 2 (. . . continued)
reduction in average luminal area. (F) Concomitantly, the number of epithelium-lined cavities per cere-bral organoid tissue section was reduced from 30 to 45 days of differentiation. The graphics represent mean±S.D. Luminal area measurements:n=17 for 30-days old organoids andn=09 for 45-days old organoids. Number of putative ventricles per organoid:n=6 for 30-days old organoids andn=11 for
45-days old organoids,∗p
<0.05. Cerebral organoids were obtained from two independent assays. Scale bars: A and C=100µm, B and D=50µm.
Figure 3 Cerebral organoid cytoarchiteture after 30 and 45 days in culture.In 30-days old organoids, (A) positive cells for the intermediate fil-ament nestin were observed throughout cerebral organoids’ extension. (B) The luminal surface of the epithelium-lined cavities was populated by mitotic cells (PH3), (C) identified as apical progenitors (PAX6) in the ventricular zone. (D) Intermediate progenitors expressing TBR2 were also present in the ventricular zone and composed an adjacent layer, the subventricular zone. (C and D) Tangential migratory neurons (β-tubulin III and MAP2) established the pre-plate outside germinal zones. In 45-days old organoids, (E) the flattened ventricles still presented proliferative cells (PH3) and (F) neural progenitors (TBR2) in the radially organized cell layer. (G) MAP2 positive cells were found widespread, except in germinal zones, while GAD67 (GABA synthesis enzyme) positive cells (H) or the neurotransmitter glutamate (I) became evident. In this time point, synap-tic markers such as synaptophysin and PSD95 (J) were also observed. Finally, comparing 30 to 45-days old cerebral organoids, there was a reduc-tion in the number of PH3 positive cells (K), while the neuronal populareduc-tion was expanded (L) as well as neurons producing GABA (M) or cells producing glutamate (N). Graphics are represented as mean±S.D. For 30-days old and 45-days old organoids, respectively: PH3 positive cells, n=3 andn=5; MAP2 positive area,n=4 andn=6; GAD67 positive cells,n=2 andn=4; glutamate fluorescence intensity,n=6 andn=7, ∗p
a component of presynaptic vesicles, and also by the detection of the postsynaptic density protein 95 (PSD95) (Fig. 3J).
As a result of the transitioning from a main self-renewal stage to a neuronal differentiation phase, a five times decrease in mitotic activity was observed when comparing the organoids at 30 and 45 days of differentiation (Fig. 3K). Accordingly, the amount of mature neurons tripled, as evaluated by MAP2 staining (Fig. 3L), and the number of neurons expressing GAD67 increased 4 times (Fig. 3M), when comparing organoids from the 30th to the 45th day of differentiation. In addition, peripheral glutamate staining increased 2.5 times (Fig. 3N). In line with these data, we considered these two time points (30 and 45 days) to depict two distinct developmental phases: one of pronounced cell division dedicated to tissue expansion and another of early neuronal network formation in cerebral organogenesis. Then, we asked whether these two time points might show different element distribution as they represent two demarcated developmental stages.
SR-XRF microprobe analysis
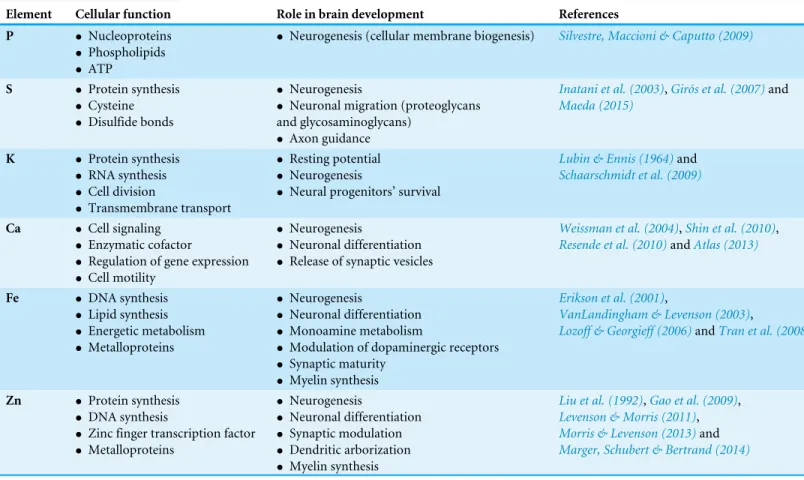
SR-XRF microprobe was used to scan elements in cerebral organoids. After X-rays excited the sample, each atom emitted a unique, identifiable and quantifiable photon signature. XRF analysis revealed that the major chemical elements in cerebral organoids were phosphorus (P), sulfur (S), potassium (K), calcium (Ca), iron (Fe) and zinc (Zn). The elements manganese (Mn), nickel (Ni) and copper (Cu) were also detected in our preparations, but were not considered further in this study due to their extremely low levels and subsequent classification as ultratrace elements. Although chlorine (Cl) was detected, it was disregarded for further analysis as it was considered a potential laboratorial artifact. While specific roles and importance of the detected elements for brain development or function may be under characterization, some of the known functions are summarized inTable 1.
Trace elements distribution in human cerebral organoids
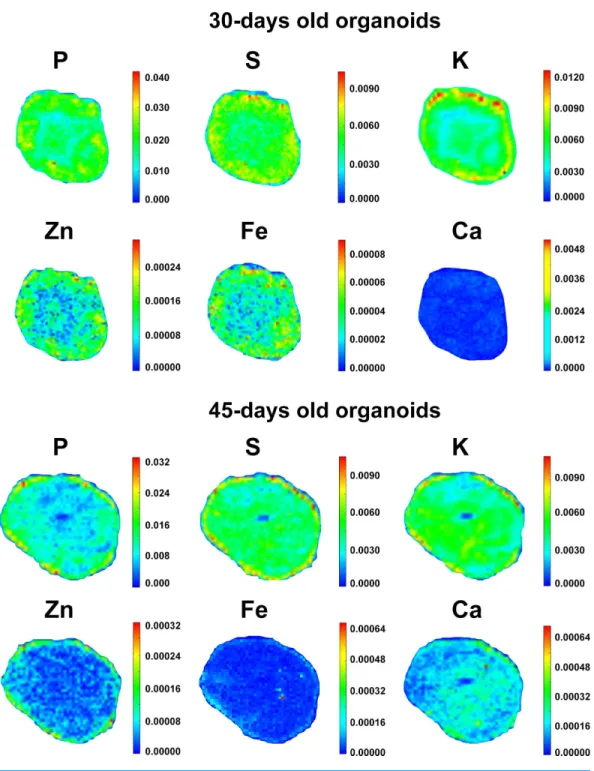
In order to search for elemental distribution patterns in cerebral organoids, the spectral profile corresponding to each measurable element was collected and assembled into color-gradient heat maps, as represented inFig. 4. Phosphorus could be detected all over organoids’ extension, despite being concentrated within the external border in both 30 and 45-days old organoids. Besides being observed diffusely distributed as well, K levels were higher in the organoids’ edge in 30 days and then became evenly distributed in 45 days. Sulfur, Ca and Fe displayed a more homogeneous distribution pattern in both proliferative and neuronal differentiation phases. Meanwhile, Zn was mostly diffused in 30-days old organoids and then became peripheral in 45-days old organoids. Elementary pattern distributions revealed a tendency for diffuseness for most elements, with the exceptions of P and Zn. Rather than spreading internally, these two elements continued to be located in higher concentrations in the edge of cerebral organoids.
Elemental concentration in cerebral organoids
Table 1 Trace elements detected in cerebral organoids and its corresponding functions in the brain development.
Element Cellular function Role in brain development References
P • Nucleoproteins
• Phospholipids
• ATP
• Neurogenesis (cellular membrane biogenesis) Silvestre, Maccioni & Caputto (2009)
S • Protein synthesis
• Cysteine
• Disulfide bonds
• Neurogenesis
• Neuronal migration (proteoglycans and glycosaminoglycans)
• Axon guidance
Inatani et al. (2003),Girós et al. (2007)and
Maeda (2015)
K • Protein synthesis
• RNA synthesis
• Cell division
• Transmembrane transport
• Resting potential
• Neurogenesis
• Neural progenitors’ survival
Lubin & Ennis (1964)and
Schaarschmidt et al. (2009)
Ca • Cell signaling
• Enzymatic cofactor
• Regulation of gene expression
• Cell motility
• Neurogenesis
• Neuronal differentiation
• Release of synaptic vesicles
Weissman et al. (2004),Shin et al. (2010),
Resende et al. (2010)andAtlas (2013)
Fe • DNA synthesis
• Lipid synthesis
• Energetic metabolism
• Metalloproteins
• Neurogenesis
• Neuronal differentiation
• Monoamine metabolism
• Modulation of dopaminergic receptors
• Synaptic maturity
• Myelin synthesis
Erikson et al. (2001),
VanLandingham & Levenson (2003),
Lozoff & Georgieff (2006)andTran et al. (2008)
Zn • Protein synthesis
• DNA synthesis
• Zinc finger transcription factor
• Metalloproteins
• Neurogenesis
• Neuronal differentiation
• Synaptic modulation
• Dendritic arborization
• Myelin synthesis
Liu et al. (1992),Gao et al. (2009), Levenson & Morris (2011),
Morris & Levenson (2013)and
Marger, Schubert & Bertrand (2014)
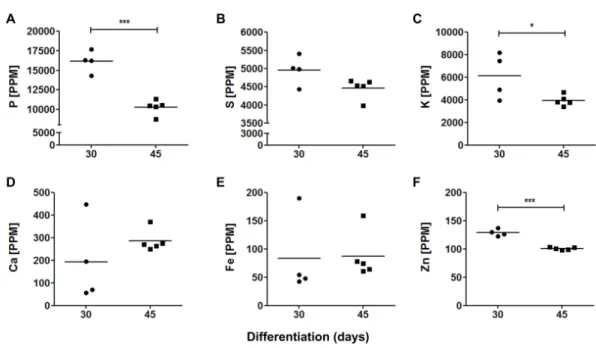
abundant elements in both 30-days (16,142±1,219 ppm; 4,955±350 ppm and 6,120 ±1,745 ppm, respectively) and 45-days old organoids (10,286±840 ppm; 4,462±249
ppm and 3,951 ±422 ppm, respectively). Calcium, Fe and Zn were found in relatively
low levels: 192±157 ppm, 84±61 ppm and 129±6 ppm in 30-days old organoids, and
286±43 ppm, 87±37 ppm and 101±2 ppm in 45-days old organoids, respectively.
Interestingly, some trace element levels decreased from 30 to 45 days of differentiation, such as P, K and Zn, whereas Fe tended to increase, even though, this latter result did not reach statistical significance.
Figure 5 Elemental quantification in cerebral organoids.Cerebral organoid elemental composition was also assessed by SR-XRF. Scatter plots represent values found for each sample. (A) P,∗∗∗p=0
.0001; (B) S, p=0.066; (C) K,∗p=0.05; (D) Ca,p=0.29; (E) Fe,p=0.92; (F) Zn,∗∗∗p<0.0001. PPM, parts per mil-lion.
Inter-elemental relationship
From an initial inspection of the spatial distribution of each element, it was not possible to assess, with any confidence, to which extent they may interact functionally or chemically, as would occur when they become part of biomolecules. We then analyzed elements in pairs to assess coincidental areas, classifying elements as correlated, unrelated or exclusive.Table 2
Table 2 Elemental correlation analysis for pairs of elements.Pearson’s product-moment correlation coefficient (Pearson’sr) andR-squared from lines of best fit were calculated for each elemental pair in order to reveal correlated and uncorrelated pairs. A 45 days/30 days old organoids ratio was calculated in order to highlight time-dependent changes in elements’ correlational distribution. Data are represented as mean±S.D. For 30-days
old cerebral organoids,n=4 and for 45-days old cerebral organoids,n=5. For all correlations of element pairs,p<0.05; except for one 30-days old cerebral organoid in the analysis of K/Fe pair and one 45-days old cerebral organoid in the analyses of K/Fe and P/Fe pairs.
Compared elements (pairs)
Pearson’sr R-squared
30 days (mean±S.D.)
45 days (mean±S.D.)
45/30 days (ratio)
30 days (mean±S.D.)
45 days (mean±S.D.)
45/30 days (ratio)
P/S 0.9607±0.0078 0.9266±0.0097 0.96 0.9231±0.0149 0.8587±0.0180 0.93
P/K 0.8345±0.0826 0.8922±0.0112 1.07 0.7016±0.1363 0.7962±0.0199 1.13
P/Ca 0.1927±0.1791 0.5509±0.2528 2.86 0.0612±0.0810 0.3546±0.2263 5.79
P/Fe 0.4294±0.4468 0.3942±0.3071 0.92 0.3341±0.3689 0.2309±0.2449 0.69
P/Zn 0.8365±0.0385 0.7331±0.0467 0.87 0.7008±0.0644 0.5391±0.0664 0.77
S/K 0.8490±0.0794 0.9358±0.0157 1.10 0.7256±0.1315 0.8759±0.0292 1.21
S/Ca 0.1851±0.1592 0.5951±0.2744 3.21 0.0532±0.0665 0.4144±0.2662 7.79
S/Fe 0.4386±0.4522 0.5000±0.2286 1.14 0.3457±0.3811 0.2892±0.2317 0.83
K/Ca 0.1484±0.1225 0.5979±0.2638 4.03 0.0333±0.0404 0.4132±0.2649 12.41
K/Fe 0.2944±0.3534 0.4018±0.2987 1.36 0.1551±0.2437 0.2283±0.2294 1.47
K/Zn 0.7137±0.0674 0.6493±0.0777 0.91 0.5128±0.0968 0.4265±0.0989 0.83
Ca/Zn 0.3459±0.1044 0.4256±0.1003 1.23 0.1278±0.0744 0.1891±0.0784 1.48
Fe/Zn 0.5114±0.3433 0.4445±0.1812 0.87 0.3500±0.3418 0.2239±0.1791 0.64
DISCUSSION
Implications of trace elements detected in cerebral organoids to brain organogenesis
While it is generally accepted that micronutrients are vital to brain morphogenesis, neurochemistry and neurophysiology, well-controlled studies for specific micronutrients are still needed. Furthermore, since most studies on this subject have been done on adult-state or post-mortem tissue samples, little is known about the elemental composition of the developing human CNS. Though it is not an exact replica of a human embryonic brain, exogenously developed cerebral organoids undergo many developmental stages and events that parallel the human condition. Perhaps more importantly, the circuits and structures being constructed contain a significant portion of the human genetic blueprinting and specific neurons that make up the early neuronal networks that give rise to the brain (Lancaster et al., 2013). Therefore, the model used in this study, amongst others of human organogenesis, could be argued to be the closest and most complete study system to date for understanding human neural development and its pathological manifestations.
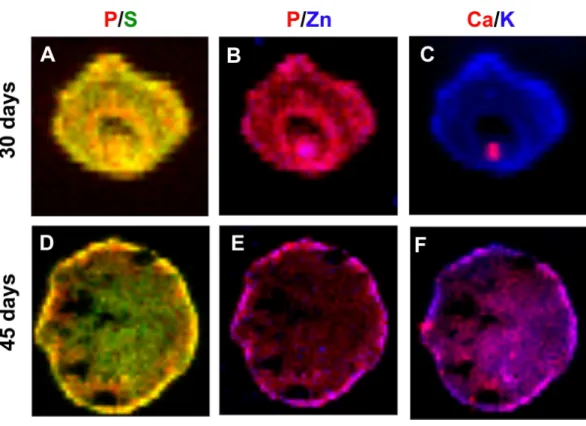
Figure 6 Concentration gradient heat maps overlay for elemental colocalization in cerebral organoids at 30 and 45-days of development.Representative merged color-gradient maps of organoids’ elements pairs: P/S at 30 (A) and 45 (D) days of differentiation; P/Zn at 30 (B) and 45 (E) days of differentiation; K/Ca at 30 (C) and 45 (F) days of differentiation. Elements are represented in: P (red), S (green), K (blue), Ca (red) and Zn (blue).
the BR1 hESC line were relatively smaller. One possibility is that these results may reflect inter-lineage variability in stem cells aggregation potential, as already described by others (Cahan & Daley, 2013). Importantly, regardless of such difference in EB size, by the end of 30 and 45 days of differentiation, the cytoarchitecture of cerebral organoids’ was similar to the original report (Lancaster et al., 2013).
Phosphorus was the most heavily represented element. When comparing proliferative (30 days) and neuronal differentiation (45 days) stages, we were able to find a decrease in P levels. Since P is a structural component of major biomolecules, such as nucleotides and phospholipids, this reduction might be explained by a switch from a phase of intense synthesis, including DNA and phospholipid production, to a more migratory and differentiation phase. With respect to tissue growth, P levels in cerebral organoids were in the same concentration range (mg/g) of that reported for adult brains (Rajan et al., 1997), albeit having been noted here in a higher quantity (Fig. 5A). In this regard, the levels found in our study imply a greater participation of P during the development of neural tissue (Rajan et al., 1997). Silvestre and colleagues (2009) also showed that total lipid P content is higher in the embryonic brain than in adult brain cells. The developing brain contains superior concentrations of phosphate groups belonging to lecithins, cephalins, and sphingomyelins, this could explain the different values found in our study. This dissimilarity underscores the need for pursuing elemental changes at either end of the aging spectrum.
Cerebral organoids were also shown to contain significant levels of K and S. Potassium is essential to transmembrane transport, regulation of cellular volume, and membrane resting potential. During brain ontogenesis, K regulates proliferation of neural progenitors (Achilles et al., 2007;Yasuda, Bartlett & Adams, 2008;Schaarschmidt et al., 2009) and is maintained in heightened levels in rapidly dividing cells (Cameron, Pool & Smith, 1979;Wallberg et al., 2000). As K currents also support the migration of early neurons over long distances due to cellular volume changes (Hendriks, Morest & Kaczmarek, 1999), we can speculate from our data that this element could be important to maintain mitotic activity in 30-days old organoids and to promote cell migration in 45-days old organoids, amongst other roles.
It is known that S integrates virtually all proteins through methionine and cysteine amino acids and disulfide bounds. In the embryonic cerebrum, chondroitin and heparan sulfate proteoglycans anchor attractive and/or repulsive cues such as growth factors, chemokines, axon guidance molecules, and cell adhesion molecules important for neuronal migration in strategically routes such as the striatum, marginal zone, subplate, and subventricular zone in the neocortex (Maeda, 2015). As an example, brains devoid of perlecan, a heparan sulfate proteoglycan component of the CNS extracellular matrix, have impaired cortical development and are microcephalic (Girós et al., 2007). Beyond this, S is also incorporated in proteoglycans expressed in the basal lamina of the neuroepithelium that regulates neurogenesis in the developing telencephalon (Girós et al., 2007). In cerebral organoids, we found high levels of S, both in 30 and 45 days of differentiation, pointing to its central role in organoids’ patterning. Therefore, we postulate that S may play a fundamental role in brain construction and in organoids’ scaffolding and patterning.
during early neurogenesis, the expression of transcription factors regulating neuronal survival and differentiation can be controlled by Ca (Leclerc et al., 2012). Noteworthy, Ca ppm values detected in the present work are consistent with those found byRiederer et al. (1989)andRajan et al. (1997)in human cerebrum cortex (Riederer et al., 1989;Rajan et al., 1997) (Fig. 5DandTable S3). Altogether, these findings emphasize that Ca may pave the way to brain organogenesis.
Zinc is an essential element to protein synthesis, enzymatic catalysis and serves as a structural component to zinc finger transcription factors. Zinc-dependent enzymes include metalloproteinases and many intermediary metabolism dehydrogenases important for CNS function (Tapiero & Tew, 2003). In addition, chelatable Zn present in synaptic vesicles can be released in the synaptic cleft to modulate many synaptic activities (Marger, Schubert & Bertrand, 2014). In comparison to previous studies in adult brain, we found higher levels of Zn in cerebral organoids (Katoh, Sato & Yamamoto, 2002;Rahil-Khazen et al., 2002), although compatible in scale of dosage (Fig. 5F). While greater concentrations of Zn in adult brain are toxic to neural cells and also cause axonal degeneration in mice (Chuah, Tennent & Jacobs, 1995), Zn modulates stem cell proliferation and neuronal differentiation during neurogenesis (Gao et al., 2009;Levenson & Morris, 2011;Morris & Levenson, 2013). In accordance, previous data from our group have demonstrated increased Zn during neural differentiation of human pluripotent stem cells (Cardoso et al., 2011). This may highlight the importance of Zn for neural stem cells commitment and justify why the levels found in cerebral organoids are subtly higher than those described in adult brain (Fig. 5FandTable S3) (Dexter et al., 1991;Rajan et al., 1997;Rahil-Khazen et al., 2002).
It is currently known that Fe is accumulated during brain prenatal development, with the highest levels observed immediately after birth. In the developing brain, Fe is required in rapidly developing regions such as the cerebral cortex (Siddappa et al., 2003) in heme-containing cytochromes that regulate neuronal and glial energetic status (Evans & Mackler, 1985). Along the same line, Fe is required to the initial expansion of neural tissue and by neurogenesis, which may account for its levels in the present study. It is noteworthy that the Fe values found for cerebral organoids parallel those measured in the adult brain (Sofic et al., 1988;Dexter et al., 1991;Rajan et al., 1997;Rahil-Khazen et al., 2002). Although higher Fe concentrations are found in some specific cerebral regions such as substantia nigra, putamen and globus pallidus (Dexter et al., 1991), they were not represented in this study. As examples of Fe roles in the CNS, Fe-containing enzymes are essential for tyrosine and tryptophan hydroxylase activities and for monoamine catabolism in synapses. Besides, Fe is also required for ribonucleotide reductase in order to regulate cell division and for normal myelination throughout CNS development (Lozoff & Georgieff, 2006).
tissue samples, while cerebral organoids generated in vitro are an embryonic model, these differences can be attributed to sample origin. Another possibility is that in vivo models surpass elemental concentrations observed inin vitromodels, as already reported for murine cultured neurons and astrocytes (Hare et al., 2013). Nevertheless, we believe that proper organoid quantifications are relevant, especially when comparing healthy vs. pathological conditions, such as in our work on iPS cells derived from schizophrenic patient (Paulsen et al., 2014).
Analysis of different organs also revealed similarities and differences from neural tissues and our cerebral organoids. Reports on Fe content in breast (∼5 ppm) (Geraki, Farquharson
& Bradley, 2002), heart (257 ppm), kidney (430 ppm), liver (837 ppm), lungs (987 ppm) (Katoh, Sato & Yamamoto, 2002), among other organs, reveal actual variation intervals (5 to 987 ppm). With 3D organoid technology boostingin vitrohuman organs modeling, we believe that elemental characterization will be a relevant tool for assessing general and discrete processes within these models, in addition to revealing chemical patterns and enablingin vivovs.in vitroand/or healthy vs. pathologic state comparisons.
Trace elements distribution in human cerebral organoids
Our data indicate that trace elements change their distribution inside organoids along differentiation. It is known that some molecules can pass through cell membrane by simple diffusion or with the aid of specific cellular transporters or channels. Potassium was reported as firstly concentrated at the organoids’ border and then became evenly distributed inside. Since K is positively charged and therefore not permeant to cell membranes, one possibility is that NKCC1, an inwardly directed cotransporter, begins to be expressed and might contribute to the simultaneous K and Cl influx. NKCC1 expression is upregulated in early developmental stages and downregulated in later brain developmentin vivo (Kaila et al., 2014).
Even though the distribution profile of a given element may be associated with changes in the expression of specific receptors and/or channels in the organoid, one can also suggest a particular role for such element in a specific cellular niche. For example, Zn displayed a more homogeneous distribution within organoids, but became relatively more peripheral at 45 days. Of note, glutamate was almost undetectable in organoids at 30 days of differentiation, but at 45 days, it occupied the outer portion of the organoids. It is known that Zn is present at high levels in glutamatergic synaptic vesicles of forebrain neurons and that its influx can be mediated by AMPA channels (Martínez-Galán, Díaz & Juiz, 2003;Takeda et al., 2009). Beyond this, Zn-dependent metalloproteinases facilitate neural migration and regulate neurite outgrowth in the preplate and cortical plate (Sanz, Ferraro & Fournier, 2015;Sîrbulescu, Ilie¸s & Zupanc, 2015). Hence, one possibility is that Zn intensity matches cellular distribution of glutamatergic cells and neuronal synaptogenesis. In this regard, further studies should help identify changes in the expression of specific channels and receptors that may take part in microelemental homeostasis of cerebral organoids.
organoids, edges had 3.9 times more cells than the center, while in 45-days old organoids this difference decreased to 1.3 times (Data S8). This behavior may explain the fact that K was mainly present near the edge in 30-days old organoids and became more diffuse in 45-days old organoids. Nevertheless, cell density did not influence S, Ca, and Fe distribution, as these elements do not followed K pattern. Also, Zn was only concentrated near the edge at 45 days of development.
Inter-elemental correlations in human cerebral organoids
The atomic elements can exist freely intra and extracellularly in the form of ions or ionic groups, and in association with biomolecules, for example. These associations define or, are defined by cellular processes, in which two or more elements behave in similar ways. Associations of this kind can be investigated by elemental correlation studies. Our analysis revealed interesting patterns, as P, S, K and Zn seem to be highly correlated, whereas Ca and Fe present very low correlation levels. In addition, we also found that P, S, Zn, K and Ca change their correlation pattern from 30 to 45 days of differentiation. These phenomena are interesting as they may portrait the change from a proliferation to a neuronal maturation stage during organoid development.
Zinc is not only a structural element, but also acts as a regulator of cell proliferation. Based on studies with Zn chelators in mammalian cells, it was found that Zn deficiency results in reduced expression of thymidine kinase (Chesters, Petrie & Travis, 1990) and reduction in thymidine incorporation (Chesters, Petrie & Vint, 1989). Strictly, Zn integrates DNA polymerase (Springgate et al., 1973), RNA polymerase (Wu et al., 1992), and ribosomal proteins (Härd et al., 2000). Whilst purely speculative, it is possible that P, as being part of nucleic acids and present in proteins, shares the same location with Zn, as both are involved in cell proliferation and protein synthesis. Another interesting example is K, which seems to be directly involved in the control of protein synthesis (Lubin & Ennis, 1964) and, in conjunction with P, is enriched in ribosomes. Specifically in neurons, K tends to correlate with P in the adult rat brain (Cameron, Sheridan & Smith, 1978). In a previous work from our group, we have shown that neurospheres generated from iPS cells derived from schizophrenia patient biopsies present higher levels of Zn and K, while producing high levels of reactive oxygen species (ROS) (Paulsen et al., 2014). Despite the fact that these studies did not involve direct correlation between metals and biomolecules, we were able to link this correlation to a disease model involving Zn defective transport leading to K imbalance. In sum, we conclude that element correlation is a fundamental part of SR-XRF analysis, especially taking into consideration the organoid model, since its cellular organization is much more complex than EB and neurospheres.
Functional significance
deficiencies in Zn nutrition during prenatal development are associated with offspring learning and memory paucity (Liu et al., 1992;Tahmasebi Boroujeni et al., 2009;Yu et al., 2013), in part caused by decreased expression of brain-derived neurotrophic factor (BDNF), altered myelin composition (Liu et al., 1992) and declined long-term potentiation (Yu, Ren & Yu, 2013). Gestational Fe anemia, the most common nutritional need, can impact learning, memory, and motor abilities in progeny. These poor executive performances can be explained at the cellular level by decreased synaptic maturity, dopamine metabolism and myelin composition (Lozoff & Georgieff, 2006). In a prospective study, it was found that maternal Fe deficiency may be a risk for schizophrenia in offspring (Insel et al., 2008). This means that the diet influences pregnancy and, to some extent, can have long-term consequences in fetal brain structuring.
CONCLUSIONS
Here, we have shown the potential of cerebral organoids in conjunction to XRF analysis to explore minerals homeostasis during brain development. Mapping each micronutrient could be useful for indicating the expression of specific receptors and/or channels, as well as for locating elements that take part in neural composition during cerebral organogenesis, such as P, S, K, Ca, Fe and Zn in a particular cellular niche. Also, mathematical analyses such as Pearson’s correlation coefficients andR-squared values for pairs of elements could give a glimpse of chemical or functional interactions.
Trace element levels in normal and pathological brain development are central to establish cause and effect relationships, mainly for nutritional deficiencies or metal transporter defects and other disorders in which trace elements are involved. Nowadays, many diseases have been regarded as neurodevelopmental disorders, with its roots planted in the first months or years of life. Disturbances in early brain development have been deemed important for later developing Parkinson’s disease or schizophrenia (Piper et al., 2012;Le Grand et al., 2015). Therefore, it seems reasonable to emphasize the need to gather data on normal trace element levels in embryonic brain tissue as presented in this work. In conclusion, cerebral organoids derived from pluripotent stem cells recapitulate features of trace element constitution previously described in the human brain.
ACKNOWLEDGEMENTS
We are indebted to Ismael Gomes, Gabriela Lopes Vitória, Marcelo Costa and Jarek Sochacki for taking excellent care of cell lines.
ADDITIONAL INFORMATION AND DECLARATIONS
Funding
Development Bank (BNDES) and Laboratório Nacional de Luz Síncroton. The funders had no role in study design, data collection and analysis, decision to publish, or preparation of the manuscript.
Grant Disclosures
The following grant information was disclosed by the authors:
National Council for Scientific and Technological Development (CNPq). Foundation for Research Support in the State of Rio de Janeiro (FAPERJ). Coordena¸cão de Aperfei¸coamento de Pessoal de Nível Superior (CAPES). Funding Authority for Studies and Projects (FINEP).
Brazilian Development Bank (BNDES). Laboratório Nacional de Luz Síncroton.
Competing Interests
The authors declare there are no competing interests.
Author Contributions
• Rafaela C. Sartore conceived and designed the experiments, performed the experiments,
analyzed the data, wrote the paper, prepared figures and/or tables, reviewed drafts of the paper.
• Simone C. Cardoso conceived and designed the experiments, performed the experiments,
analyzed the data, contributed reagents/materials/analysis tools, wrote the paper, prepared figures and/or tables, reviewed drafts of the paper.
• Yury V.M. Lages performed the experiments, reviewed drafts of the paper. • Julia M. Paraguassu performed the experiments.
• Mariana P. Stelling performed the experiments, analyzed the data, prepared figures
and/or tables, reviewed drafts of the paper.
• Rodrigo F. Madeiro da Costa performed the experiments, analyzed the data, reviewed
drafts of the paper.
• Marilia Z. Guimaraes conceived and designed the experiments, analyzed the data, wrote
the paper, prepared figures and/or tables, reviewed drafts of the paper.
• Carlos A. Pérez analyzed the data, contributed reagents/materials/analysis tools, reviewed
drafts of the paper.
• Stevens K. Rehen conceived and designed the experiments, analyzed the data, contributed
reagents/materials/analysis tools, wrote the paper, reviewed drafts of the paper.
Human Ethics
The following information was supplied relating to ethical approvals (i.e., approving body and any reference numbers):
Comitê de Ética em Pesquisa do Hospital das Clínicas da Faculdade de Medicina (CAPPesq, HCPA) (IRB00000921)
Data Availability
The following information was supplied regarding data availability: The raw data has been supplied as aSupplementary File.
Supplemental Information
Supplemental information for this article can be found online athttp://dx.doi.org/10.7717/ peerj.2927#supplemental-information.
REFERENCES
Achilles K, Okabe A, Ikeda M, Shimizu-Okabe C, Yamada J, Fukuda A, Luhmann HJ,
Kilb W. 2007.Kinetic properties of Cl uptake mediated by Na+-dependent K+
-2Cl cotransport in immature rat neocortical neurons.The Journal of Neuroscience
27(32):8616–8627DOI 10.1523/JNEUROSCI.5041-06.2007.
Atlas D. 2013.The voltage-gated calcium channel functions as the molecular switch of
synaptic transmission.Annual Review of Biochemistry82:607–635
DOI 10.1146/annurev-biochem-080411-121438.
Cahan P, Daley GQ. 2013.Origins and implications of pluripotent stem cell variability
and heterogeneity.Nature Reviews. Molecular Cell Biology14:357–368
DOI 10.1038/nrm3584.
Cameron IL, Pool TB, Smith NK. 1979.An X-ray microanalysis survey of the
concen-tration of elements in the cytoplasm of different mammalian cell types.Journal of Cellular Physiology 101(3):493–501DOI 10.1002/jcp.1041010315.
Cameron IL, Sheridan PJ, Smith NR. 1978.An x-ray microanalysis study of
dif-ferences in concentration of elements in brain cells due to opiates, cell type, and subcellular location.Journal of Neuroscience Research3(5–6):397–410
DOI 10.1002/jnr.490030511.
Cardoso SC, Stelling MP, Paulsen BS, Rehen SK. 2011.Synchrotron radiation
X-ray microfluorescence reveals polarized distribution of atomic elements during differentiation of pluripotent stem cells.PLOS ONE6(12):1–10
DOI 10.1371/journal.pone.0029244.
Chesters JK, Petrie L, Travis AJ. 1990.A requirement for Zn2+for the induction of
thymidine kinase but not ornithine decarboxylase in 3T3 cells stimulated from quiescence.The Biochemical Journal272(2):525–527DOI 10.1042/bj2720525.
Chesters JK, Petrie L, Vint H. 1989.Specificity and timing of the Zn2+requirement for
DNA synthesis by 3T3 cells.Experimental Cell Research184(2):499–508
DOI 10.1016/0014-4827(89)90347-9.
Chuah MI, Tennent R, Jacobs I. 1995.Response of olfactory Schwann cells to intranasal
zinc sulfate irrigation.Journal of Neuroscience Research42(4):470–478
DOI 10.1002/jnr.490420405.
De Souza AS, Fernandes FS, Do Carmo M das GT. 2011.Effects of maternal
Dexter DT, Carayon A, Javoy-Agid F, Agid Y, Wells FR, Daniel SE, Lees AJ, Jenner P,
Marsden CD. 1991.Alterations in the levels of iron, ferritin and other trace metals in
Parkinson’s disease and other neurodegenerative diseases affecting the basal ganglia. Brain114(4):1953–1975DOI 10.1093/brain/114.4.1953.
Eiraku M, Watanabe K, Matsuo-Takasaki M, Kawada M, Yonemura S, Matsumura M,
Wataya T, Nishiyama A, Muguruma K, Sasai Y. 2008.Self-organized formation of
polarized cortical tissues from ESCs and its active manipulation by extrinsic signals. Cell Stem Cell3:519–532DOI 10.1016/j.stem.2008.09.002.
Erikson KM, Jones BC, Hess EJ, Zhang Q, Beard JL. 2001.Iron deficiency decreases
dopamine D1 and D2 receptors in rat brain.Pharmacology, Biochemistry, and Behavior 69(3–4):409–418DOI 10.1016/S0091-3057(01)00563-9.
Evans TC, Mackler B. 1985.Effect of iron deficiency on energy conservation in rat liver
and skeletal muscle submitochondrial particles.Biochemical Medicine34(1):93–99
DOI 10.1016/0006-2944(85)90065-1.
Felt BT, Lozoff B. 1996.Brain iron and behavior of rats are not normalized by treatment
of iron deficiency anemia during early development.The Journal of Nutrition
126:693–701.
Fraga AM, Sukoyan M, Rajan P, Braga DP de AF, Iaconelli A, Franco JG, Borges E,
Pereira LV. 2011.Establishment of a Brazilian line of human embryonic stem cells
in defined medium: implications for cell therapy in an ethnically diverse population. Cell Transplantation20(3):431–440 DOI 10.3727/096368910X522261.
Gao H-L, Zheng W, Xin N, Chi Z-H, Wang Z-Y, Chen J, Wang Z-Y. 2009.Zinc
defi-ciency reduces neurogenesis accompanied by neuronal apoptosis through caspase-dependent and -incaspase-dependent signaling pathways.Neurotoxicity Research16:416–425
DOI 10.1007/s12640-009-9072-7.
Georgieff MK. 2007.Nutrition and the developing brain: nutrient priorities and
measurement.The American Journal of Clinical Nutrition85:614S–620S.
Geraki K, Farquharson MJ, Bradley DA. 2002.Concentrations of Fe, Cu and Zn
in breast tissue: a synchrotron XRF study.Physics in Medicine and Biology
47(13):2327–2339DOI 10.1088/0031-9155/47/13/310.
Girós A, Morante J, Gil-Sanz C, Fairén A, Costell M. 2007.Perlecan controls
neu-rogenesis in the developing telencephalon.BMC Developmental Biology7:29
DOI 10.1186/1471-213X-7-29.
Golub MS, Hogrefe CE. 2015.Fetal iron deficiency and genotype influence emotionality
in infant rhesus monkeys.The Journal of Nutrition145(3):647–653
DOI 10.3945/jn.114.201798.
Härd T, Rak A, Allard P, Kloo L, Garber M. 2000.The solution structure of ribosomal
protein L36 from Thermus thermophilus reveals a zinc-ribbon-like fold.Journal of Molecular Biology 296(1):169–180DOI 10.1006/jmbi.1999.3433.
Hare DJ, Grubman A, Ryan TM, Lothian A, Liddell JR, Grimm R, Matsuda T, Doble
PA, Cherny RA, Bush AI, White AR, Masters CL, Roberts BR. 2013.Profiling the
He F, Vanespen PJ. 1991.General-approach for quantitative energy dispersive-x-ray fluorescence analysis based on fundamental parameters.Analytical Chemistry
63:2237–2244DOI 10.1021/ac00020a009.
Hendriks R, Morest DK, Kaczmarek LK. 1999.Role in neuronal cell migration for
high-threshold potassium currents in the chicken hindbrain.Journal of Neuroscience Research58(6):805–814
DOI 10.1002/(SICI)1097-4547(19991215)58:6<805::AID-JNR7>3.0.CO;2-V.
Inatani M, Irie F, Plump AS, Tessier-Lavigne M, Yamaguchi Y. 2003.Mammalian
brain morphogenesis and midline axon guidance require heparan sulfate.Science
302(5647):1044–1046DOI 10.1126/science.1090497.
Insel BJ, Schaefer CA, McKeague IW, Susser ES, Brown AS. 2008.Maternal iron
deficiency and the risk of schizophrenia in offspring.Archives of General Psychiatry
65(10):1136–1144DOI 10.1001/archpsyc.65.10.1136.
Kaila K, Price TJ, Payne JA, Puskarjov M, Voipio J. 2014.Cation-chloride
cotrans-porters in neuronal development, plasticity and disease.Nature Publishing Group
15:637–654DOI 10.1038/nrn3819.
Katoh Y, Sato T, Yamamoto Y. 2002.Determination of multielement concentrations
in normal human organs from the Japanese.Biological Trace Element Research
90(1):57–70DOI 10.1385/BTER:90:1-3:57.
Lancaster MA, Knoblich JA. 2014.Generation of cerebral organoids from human
pluripotent stem cells.Nature Protocols9:2329–2340DOI 10.1038/nprot.2014.158.
Lancaster MA, Renner M, Martin C-A, Wenzel D, Bicknell LS, Hurles ME, Homfray T,
Penninger JM, Jackson AP, Knoblich JA. 2013.Cerebral organoids model human
brain development and microcephaly.Nature501:373–379
DOI 10.1038/nature12517.
Le Grand JN, Gonzalez-Cano L, Pavlou MA, Schwamborn JC. 2015.Neural stem cells in
Parkinson’s disease: a role for neurogenesis defects in onset and progression.Cellular and Molecular Life Sciences72(4):773–797DOI 10.1007/s00018-014-1774-1.
Leclerc C, Néant I, Moreau M, Hansen DV, Lui JH, Parker PRL, Kriegstein AR. 2012.
The calcium: an early signal that initiates the formation of the nervous system during embryogenesis.Frontiers in Molecular Neuroscience5:1–12
DOI 10.3389/fnmol.2012.00064.
Levenson CW, Morris D. 2011.Zinc and neurogenesis: making new neurons from
devel-opment to adulthood.Advances in Nutrition2:96–100DOI 10.3945/an.110.000174.
Liu H, Oteiza PI, Gershwin ME, Golub MS, Keen CL. 1992.Effects of maternal marginal
zinc deficiency on myelin protein profiles in the suckling rat and infant rhesus monkey.Biological Trace Element Research34(1):55–66DOI 10.1007/BF02783898.
Lozoff B, Georgieff MK. 2006.Iron deficiency and brain development.Seminars in
Pediatric Neurology13(3):158–165DOI 10.1016/j.spen.2006.08.004.
Lubin M, Ennis HL. 1964.On the role of intracellular potassium in protein synthesis.
Biochimica et Biophysica Acta80:614–631DOI 10.1016/0926-6550(64)90306-8.
Lui JH, Hansen DV, Kriegstein AR. 2011.Development and evolution of the human
Maeda N. 2015.Proteoglycans and neuronal migration in the cerebral cortex during development and disease.Frontiers in Neuroscience9:1–15
DOI 10.3389/fnins.2015.00098.
Marger L, Schubert CR, Bertrand D. 2014.Zinc: an underappreciated modulatory factor
of brain function.Biochemical Pharmacology91(4):426–435
DOI 10.1016/j.bcp.2014.08.002.
Martínez-Galán JR, Díaz C, Juiz JM. 2003.Histochemical localization of neurons with
zinc-permeable AMPA/kainate channels in rat brain slices.Brain Research963(1–2): 156–164DOI 10.1016/S0006-8993(02)03964-1.
Miller LM, Wang Q, Telivala TP, Smith RJ, Lanzirotti A, Miklossy J. 2006.
Synchrotron-based infrared and X-ray imaging shows focalized accumulation of Cu and Zn co-localized withβ-amyloid deposits in Alzheimer’s disease.Journal of Structural Biology
155(1):30–37DOI 10.1016/j.jsb.2005.09.004.
Morris DR, Levenson CW. 2013.Zinc regulation of transcriptional activity during
retinoic acid-induced neuronal differentiation.Journal of Nutritional Biochemistry
24(11):1940–1944DOI 10.1016/j.jnutbio.2013.06.002.
Muller M, Leavitt BR. 2014.Iron dysregulation in Huntington’s disease.Journal of
Neurochemistry 130(3):328–350DOI 10.1111/jnc.12739.
Paridaen JTML, Huttner WB. 2014.Neurogenesis during development of the vertebrate
central nervous system.EMBO Reports15:351–364DOI 10.1002/embr.201438447.
Paulsen B da S, Cardoso SC, Stelling MP, Cadilhe DV, Rehen SK. 2014.Valproate
reverts zinc and potassium imbalance in schizophrenia-derived reprogrammed cells. Schizophrenia Research154(1–3):30–35DOI 10.1016/j.schres.2014.02.007.
Pérez CA, Radtke M, Sánchez HJ, Tolentino H, Neuenshwander RT, Barg W, Rubio
M, Bueno MIS, Raimundo IM, Rohwedder JJR. 1999.Synchrotron radiation
X-ray fluorescence at the LNLS: beamline instrumentation and experiments.X-ray Spectrometry28(5):320–326
DOI 10.1002/(SICI)1097-4539(199909/10)28:5<320::AID-XRS359>3.0.CO;2-1.
Piper M, Beneyto M, Burne THJ, Eyles DW, Lewis DA, McGrath JJ. 2012.The
neurode-velopmental hypothesis of schizophrenia. Convergent clues from epidemiology and neuropathology.Psychiatric Clinics of North America35(3):571–584
DOI 10.1016/j.psc.2012.06.002.
Popescu BFG, George MJ, Bergmann U, Garachtchenko AV, Kelly ME, McCrea RPE, Lüning K, Devon RM, George GN, Hanson AD, Harder SM, Chapman LD,
Pickering IJ, Nichol H. 2009.Mapping metals in Parkinson’s and normal brain
using rapid-scanning x-ray fluorescence.Physics in Medicine and Biology 54:651–663
DOI 10.1088/0031-9155/54/3/012.
Popescu BF, Nichol H. 2011.Mapping brain metals to evaluate therapies for
neurode-generative disease.CNS Neuroscience & Therapeutics17:256–268
DOI 10.1111/j.1755-5949.2010.00149.x.
Radlowski EC, Johnson RW. 2013.Perinatal iron deficiency and neurocognitive
develop-ment.Frontiers in Human Neuroscience7:585 DOI 10.3389/fnhum.2013.00585.
Rahil-Khazen R, Bolann BJ, Myking A, Ulvik RJ. 2002.Multi-element analysis of
emission spectrometry technique (ICP-AES).Journal of Trace Elements in Medicine and Biology16(1):15–25DOI 10.1016/S0946-672X(02)80004-9.
Rajan MT, Jagannatha Rao KS, Mamatha BM, Rao RV, Shanmugavelu P, Menon
RB, Pavithran MV. 1997.Quantification of trace elements in normal human
brain by inductively coupled plasma atomic emission spectrometry.Journal of the Neurological Sciences146(2):153–166DOI 10.1016/S0022-510X(96)00300-0.
Resende RR, Adhikari A, Da Costa JL, Loren¸con E, Ladeira MS, Guatimosim S, Kihara
AH, Ladeira LO. 2010.Influence of spontaneous calcium events on cell-cycle
progression in embryonal carcinoma and adult stem cells.Biochimica et Biophysica
Acta1803(2):246–260 DOI 10.1016/j.bbamcr.2009.11.008.
Riederer P, Sofic E, Rausch WD, Schmidt B, Reynolds GP, Jellinger K, Youdim MB.
1989.Transition metals, ferritin, glutathione, and ascorbic acid in parkinsonian
brains.Journal of Neurochemistry52(2):515–520
DOI 10.1111/j.1471-4159.1989.tb09150.x.
Rosas HD, Chen YI, Doros G, Salat DH, Chen N, Kwong KK, Bush A, Fox J, Hersch SM.
2012.Alterations in brain transition metals in Huntington disease: an evolving and
intricate story.Archives of Neurology69(7):887–893
DOI 10.1001/archneurol.2011.2945.
Sanz R, Ferraro GB, Fournier AE. 2015.IgLON cell adhesion molecules are shed from
the cell surface of cortical neurons to promote neuronal growth.The Journal of Biological Chemistry 290:4330–4342DOI 10.1074/jbc.M114.628438.
Schaarschmidt G, Wegner F, Schwarz SC, Schmidt H, Schwarz J. 2009.Characterization
of voltage-gated potassium channels in human neural progenitor cells.PLOS ONE
4(7):e6168DOI 10.1371/journal.pone.0006168.
Shin HY, Hong YH, Jang SS, Chae HG, Paek SL, Moon HE, Kim DG, Kim J, Paek
SH, Kim SJ. 2010.A role of canonical transient receptor potential 5 channel in
neuronal differentiation from A2B5 neural progenitor cells.PLOS ONE5(5):e10359
DOI 10.1371/journal.pone.0010359.
Siddappa AJM, Rao RB, Wobken JD, Casperson K, Leibold EA, Connor JR, Georgieff
MK. 2003.Iron deficiency alters iron regulatory protein and iron transport protein
expression in the perinatal rat brain.Pediatric Research53:800–807
DOI 10.1203/01.PDR.0000058922.67035.D5.
Silvestre DC, Maccioni HJF, Caputto BL. 2009.Content of endoplasmic reticulum and
golgi complex membranes positively correlates with the proliferative status of brain cells.Journal of Neuroscience Research87(4):857–865DOI 10.1002/jnr.21915.
Sîrbulescu RF, Ilie¸s I, Zupanc GKH. 2015.Matrix metalloproteinase-2 and -9 in the
cerebellum of teleost fish: functional implications for adult neurogenesis.Molecular and Cellular Neurosciences68:9–23DOI 10.1016/j.mcn.2015.03.015.
Sochacki J, Devalle S, Reis M, Mattos P, Rehen S. 2016.Generation of iPS cell lines
from schizophrenia patients using a non-integrative method.Stem Cell Research
Sofic E, Riederer P, Heinsen H, Beckmann H, Reynolds GP, Hebenstreit G, Youdim
MB. 1988.Increased iron (III) and total iron content in post mortem
substan-tia nigra of parkinsonian brain.Journal of Neural Transmission74(3):199–205
DOI 10.1007/BF01244786.
Solé VA, Papillon E, Cotte M, Walter P, Susini J. 2007.A multiplatform code for the
analysis of energy-dispersive X-ray fluorescence spectra.Spectrochimica Acta—Part B Atomic Spectroscopy62:63–68DOI 10.1016/j.sab.2006.12.002.
Springgate CF, Mildvan AS, Abramson R, Engle JL, Loeb LA. 1973.Escherichia coli
deoxyribonucleic acid polymerase I, a zinc metalloenzyme. Nuclear quadrupolar relaxation studies of the role of bound zinc.The Journal of Biological Chemistry
248(1):5987–5993.
Tahmasebi Boroujeni S, Naghdi N, Shahbazi M, Farrokhi A, Bagherzadeh F,
Kazemne-jad A, Javadian M. 2009.The effect of severe zinc deficiency and zinc supplement
on spatial learning and memory.Biological Trace Element Research130(1):48–61
DOI 10.1007/s12011-008-8312-7.
Takeda A, Sakurada N, Ando M, Kanno S, Oku N. 2009.Facilitation of zinc influx via
AMPA/kainate receptor activation in the hippocampus.Neurochemistry International
55(6):376–382DOI 10.1016/j.neuint.2009.04.006.
Tapiero H, Tew KD. 2003.Trace elements in human physiology and pathology: zinc
and metallothioneins.Biomedicine & Pharmacotherapy = Biomédecine & pharma-cothérapie57:399–411.
Tran PV, Carlson ES, Fretham SJB, Georgieff MK. 2008.Early-life iron deficiency
ane-mia alters neurotrophic factor expression and hippocampal neuron differentiation in male rats.The Journal of Nutrition138(12):2495–2501DOI 10.3945/jn.108.091553.
VanLandingham JW, Levenson CW. 2003.Effect of retinoic acid on ferritin H
ex-pression during brain development and neuronal differentiation.Nutritional Neuroscience6(1):39–45DOI 10.1080/1028415021000056041.
Wallberg P, Lindberg M, Alsterborg E, Roomans GM, Wróblewski R. 2000.Elemental
changes in skin from patients with basal cell carcinoma.Journal of Submicroscopic Cytology and Pathology32:169–173.
Wang H, Wang M, Wang B, Li M, Chen H, Yu X, Yang K, Chai Z, Zhao Y, Feng W.
2012.Immunogold labeling and X-ray fluorescence microscopy reveal enrichment
ratios of Cu and Zn, metabolism of APP and amyloid-βplaque formation in a mouse model of Alzheimer’s disease.Metallomics: Integrated Biometal Science
4(10):1113–1118DOI 10.1039/c2mt20056b.
Weissman TA, Riquelme PA, Ivic L, Flint AC, Kriegstein AR. 2004.Calcium waves
propagate through radial glial cells and modulate proliferation in the developing neocortex.Neuron43(5):647–661DOI 10.1016/j.neuron.2004.08.015.
Wróblewski R, Chamberlain J, Edström L. 1984.Sodium, phosphorus, sulphur, chlorine
and potassium shifts in rat brain during embryonic development.Brain Research
314:207–215.
Wu FY, Huang WJ, Sinclair RB, Powers L. 1992.The structure of the zinc sites of
Es-cherichia coliDNA-dependent RNA polymerase.The Journal of Biological Chemistry
Yasuda T, Bartlett PF, Adams DJ. 2008.K(ir) and K(v) channels regulate electrical properties and proliferation of adult neural precursor cells.Molecular and Cellular Neurosciences37(2):284–297DOI 10.1016/j.mcn.2007.10.003.
Yu X, Jin L, Zhang X, Yu X. 2013.Effects of maternal mild zinc deficiency and zinc
supplementation in offspring on spatial memory and hippocampal neuronal ultrastructural changes.Nutrition29(2):457–461DOI 10.1016/j.nut.2012.09.002.
Yu X, Ren T, Yu X. 2013.Disruption of calmodulin-dependent protein kinase II