www.the-cryosphere.net/4/67/2010/
© Author(s) 2010. This work is distributed under the Creative Commons Attribution 3.0 License.
The Cryosphere
Forecasting temperate alpine glacier survival from accumulation
zone observations
M. S. Pelto
Environmental Sciences, Nichols College, Dudley, MA 01571, USA
Received: 16 April 2009 – Published in The Cryosphere Discuss.: 19 May 2009
Revised: 18 December 2009 – Accepted: 19 January 2010 – Published: 29 January 2010
Abstract.Temperate alpine glacier survival is dependent on the consistent presence of an accumulation zone. Frequent low accumulation area ratio values, below 30%, indicate the lack of a consistent accumulation zone, which leads to sub-stantial thinning of the glacier in the accumulation zone. This thinning is often evident from substantial marginal recession, emergence of new rock outcrops and surface elevation de-cline in the accumulation zone. In the North Cascades 9 of the 12 examined glaciers exhibit characteristics of substantial accumulation zone thinning; marginal recession or emergent bedrock areas in the accumulation zone. The longitudinal profile thinning factor,f, which is a measure of the ratio of thinning in the accumulation zone to that at the terminus, is above 0.6 for all glaciers exhibiting accumulation zone thin-ning characteristics. The ratio of accumulation zone thinthin-ning to cumulative mass balance is above 0.5 for glacier experi-encing substantial accumulation zone thinning. Without a consistent accumulation zone these glaciers are forecast not to survive the current climate or future additional warming. The results vary considerably with adjacent glaciers having a different survival forecast. This emphasizes the danger of extrapolating survival from one glacier to the next.
1 Introduction
Glaciers have been studied as sensitive indicators of climate for more than a century and are now part of the Global Cli-mate Observing System (Haeberli et al., 2000). Observations of alpine glaciers most commonly focus on changes in termi-nus position, to identify glacier response to climate changes (Oerlemans, 1994) and mass balance to assess annual volume
Correspondence to:M. S. Pelto (mspelto@nichols.edu)
change (WGMS, 2008). The worldwide retreat of moun-tain glaciers is one of the clearest signals of ongoing climate change (Haeberli and Hoelzel, 1995; Oerlemans, 1994). The retreat is a reflection of strongly negative mass balances over the last 30 years (WGMS, 2007). In some cases the negative balances have led to the loss of a glacier (Pelto, 2006; Knoll and Kerschner, 2009).
Terminus change observations identify the response of the glacier to recent climate changes; however, terminus change does not identify the ability of a glacier to survive. A glacier can retreat rapidly and still reestablish equilibrium. Only the lack of a consistent accumulation zone will lead to the failure of a temperate alpine glacier to survive. This suggests that glacier survival assessment should focus on the accumulation zone observations not the terminus.
2 Terminus response
Recent climate change has caused ubiquitous retreat of Pa-cific Northwest glaciers (Pelto and Hedlund, 2001; Key et al., 2002; Hall and Fagre, 2003). Three specific period of glacier behavior are evident for the last century. The first is a ubiq-uitous rapid retreat of Pacific Northwest alpine glaciers from 1890 to 1949 due to progressive temperature rise (Meier and Post, 1962; Hubley, 1956). The second period from 1950– 1975 was in response to cooler and wetter conditions (Hub-ley, 1956). Many North Cascade glaciers began to advance in the early 1950s, after 30 years of rapid retreat (Hubley, 1956). The third period is the current ongoing rapid retreat due to warmer conditions that began in 1977 (Pelto, 2006). The retreat and negative mass balances of the 1977–2007 pe-riod have been without exception in the region. Between 1979 and 1984, 35 of the 47 North Cascade glaciers observed annually had begun retreating (Pelto and Hedlund, 2001). By 1992, all 47 glaciers termini observed in the NC were re-treating (Pelto, 1993). By 2006, four had disappeared: Lewis Glacier, David Glacier, Spider Glacier and Milk Lake Glacier (Pelto, 2006).
The rate of loss of glacier area can be extrapolated to de-termine if a glacier is likely to survive as has been done in Glacier National Park (Hall and Fagre, 2003). However, this ignores the fundamental viability of a glaciers accumu-lation zone. Hoffman et al. (2007) noted that for some small glaciers the retreat rate declines substantially and is less sen-sitive to climate once the glacier has retreated to its principal accumulation area. The rate of change is a useful measure of glacier change but not diagnostic of glacier disappearance.
3 Accumulation zone response
3.1 Equilibrium response
Glacier terminus retreat results in the loss of the low el-evation region of the glacier. Since higher elel-evations are cooler than lower ones, the disappearance of the lowest por-tion, terminus region of the glacier reduces overall ablapor-tion, thereby increasing mass balance and potentially reestablish-ing equilibrium (Oerlemans, 2001; Pelto, 2006). The well documented pattern of thickness change along a longitudinal profile of a land terminating glacier is greatest thinning at the terminus, and at some distance above the terminus, usu-ally in the accumulation zone, the glacier thins significantly less even during retreat (Paterson, 1981; Schwitter and Ray-mond, 1993). Arendt et al. (2006) observed from repeat lon-gitudinal profiles of glaciers in Alaska near zero changes at higher elevations, decreasing to a maximum rate of thinning at the elevation of the terminus. Johannesson et al. (1989) and Schwitter and Raymond (1993) described a profile shape parameterf, this factor is a measure of the degree to which thickness change, 1h, is distributed along the length of a
glacier. To distinguish this from other shape factors, f is designated as the longitudinal profile thinning factor, and is defined as the constant of proportionality between the aver-age thickness change of a glacier and the thickness change at its terminus:
f=1h/1ht (1)
Here1his the length averaged thickness change during the study period,1ht denotes the thickness change in the termi-nus region during the study period. Iff =0,1h is local-ized to the terminus, iff=1,1his the same everywhere, if f=0.5, thinning declines nearly linearly from a maximum at the terminus to no reduction at the head of the glacier. (Schwitter and Raymond, 1993). They examined1halong a number of alpine glaciers in response to the post Little Ice Age conditions and found thatf =0.2−0.4, with a mean of 0.3. This value off indicates that thinning at the terminus and in the ablation zone was considerably greater than oc-curred in the accumulation zone, and that thinning at the head of the glacier was close to zero. This behavior of greatest thinning at the terminus suggests a glacier that is retreating to a new stable position (Schwitter and Raymond, 1993), an equilibrium response. The result of this response is compar-atively limited changes in the glacier thickness and marginal position in the accumulation zone, compared to the ablation zone.
3.2 Disequilibrium response
Pelto (2006) noted that several North Cascade glaciers were experiencing thinning in the accumulation zone that was ap-proximately equal to that of the terminus, indicating a value off approaching 1. For a non-surging temperate glacier a value off =1 suggests a glacier without a consistent true accumulation zone, a glacier that is in disequilibrium. The result of accumulation zone thinning is marginal retreat in the accumulation zone and exposure of new bedrock out-crops (Paul et al., 2004; Pelto, 2006). Accumulation zone thinning is potentially a more unstable form of retreat with substantial thinning throughout the length and breadth of the glacier (Paul et al., 2004; Pelto, 2006). A glacier in this con-dition is unlikely to survive in anything like its present extent given current climate.
Table 1. The geographic characteristics of the 12 glaciers where annual balance has been assessed annually and longitudinal profiles completed periodically. Accumulation sources: wind drifting=WD, avalanche accumulation=AV, direct snowfall=DS. The study period for mass balance or AAR for Spider and Lyman Glacier is noted for each glacier.
Glacier Years Aspect 2007 area (km2) Accumulation Sources Distance to Divide Elevation (m) Columbia 1984–09 SSE 0.9 DS, DW, AV 15 km west 1750–1450 Daniels 1985–09 E 0.4 DS, WD 1 km east 2230–1970 Easton 1990–09 SSE 2.9 DS 75 km west 2900–1700 Foss 1985–09 NE 0.4 DS At divide 2100–1840 Ice Worm 1984–09 SE 0.1 DS, AV 1 km east 2100–1900 Lower Curtis 1984–09 S 0.8 DS, WD 55 km west 1850–1460 Lyman 1986–08 N 0.2 DS, AV 15 km east
Lynch 1985-09 N 0.7 DS, WD At divide 2200–1950 Rainbow 1986–09 ENE 1.6 DS, AV 70 km west 2040–1310 Sholes 1990–09 N 0.9 DS 70 km west 2070–1630 Spider 1986–01 SE 0 DS, WD 17 km east
Yawning 1985–09 N 0.3 DS At divide 2100–1880
4 Glacier forecast model
Recently attention has focused on the potential for assess-ing changes in areal extent and characteristics of all glaciers using satellite imagery. (Paul et al., 2004; K¨a¨ab et al., 2002; Andreassen et al., 2008). Generation of DEMs from such im-agery in combination with existing maps or previous imim-agery will provide a means to identify the extent of thinning in the accumulation zone. A survival forecast model based on pa-rameters observable in satellite imagery provides the poten-tial for assessing glacier survival across a mountain range. Paul et al. (2004) developed criteria as indicators of glacier down-wasting and glacier areas experiencing rapid disinte-gration using satellite imagery: emergence of rock outcrops in the accumulation zone, disintegration and shrinkage along the entire perimeter, pro-glacial lake formation and separa-tion from tributaries. Pelto (2006) used retreat of the head of the glacier as an indicator of rapid glacier disappearance. The above criteria provide direct quantifiable evidence of ac-cumulation zone thinning.
In this study we examine accumulation zone changes on 12 North Cascade, Washington glaciers to identify charac-teristics that are indicative of glaciers with substantial accu-mulation zone thinning. Two characteristics are identified 1) marginal recession exceeding 15 m along more than 50% of the perimeter in the accumulation zone. 2) Emergence of bedrock outcrops in the accumulation zone. Comparison with two other measures of accumulation zone thinning pro-vide a means to quantify the forecast and examine the reli-ability of the aforementioned characteristics in assessing ac-cumulation zone thinning. 1) Longitudinal profile thinning factorf is determined for each glacier. The thinning factor can be determined from repeat surface profiling (Arendt et al., 2006) or by repeat glacier mapping (Andreasson et al., 2008). The ratio of accumulation zone thinning to
cumu-lative mass balance is a different method to derive the same measure asf by comparing the mean change in glacier thick-ness as determined from cumulative mass balance observa-tions to the observed accumulation zone thinning. In the case of the North Cascades the mass balance data set is simply a separate means of verifying the extent of accumulation zone thinning to overall glacier thinning, relying on a separate data set. If the ratio of accumulation zone thinning to cumulative mass balance, for the entire mass balance period of record, exceeds 0.5 the glacier is deemed to be thinning significantly in the accumulation zone. This is a measure of how much of the total mass balance is from losses in the accumulation zone.
5 Accumulation zone observations
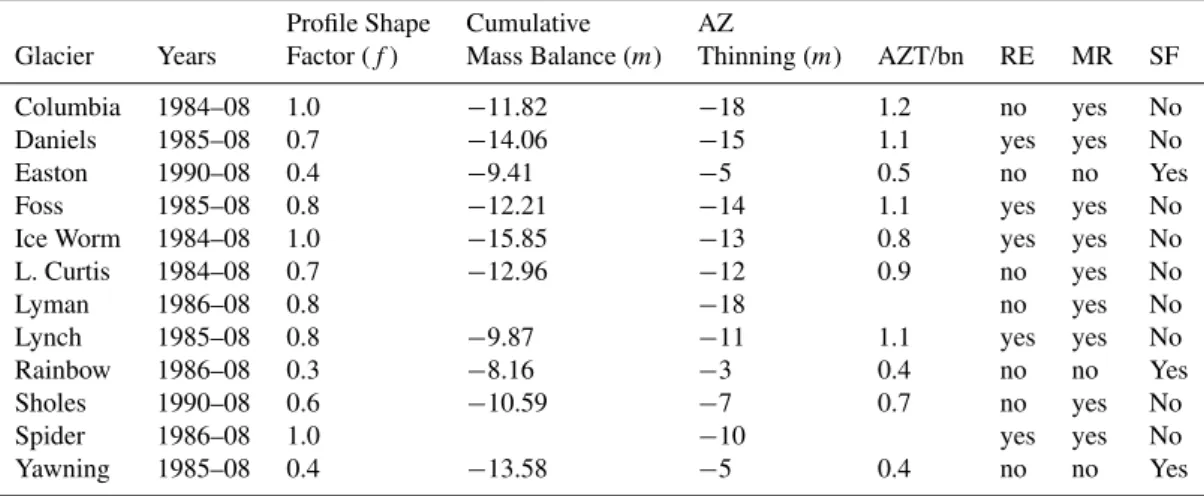
Table 2. Range of years used to determine the following factors, longitudinal profile shape factor (f), cumulative annual balance (m), cumulative mean accumulation zone thinning (AZT), ratio of AZT and cumulative mass balance, Identified rock emergence (RE) and accumulation zone marginal retreat (MR). In the last column is the resultant survival forecast.
Profile Shape Cumulative AZ
Glacier Years Factor (f) Mass Balance (m) Thinning (m) AZT/bn RE MR SF Columbia 1984–08 1.0 −11.82 −18 1.2 no yes No Daniels 1985–08 0.7 −14.06 −15 1.1 yes yes No
Easton 1990–08 0.4 −9.41 −5 0.5 no no Yes Foss 1985–08 0.8 −12.21 −14 1.1 yes yes No
Ice Worm 1984–08 1.0 −15.85 −13 0.8 yes yes No
L. Curtis 1984–08 0.7 −12.96 −12 0.9 no yes No
Lyman 1986–08 0.8 −18 no yes No
Lynch 1985–08 0.8 −9.87 −11 1.1 yes yes No Rainbow 1986–08 0.3 −8.16 −3 0.4 no no Yes
Sholes 1990–08 0.6 −10.59 −7 0.7 no yes No Spider 1986–08 1.0 −10 yes yes No
Yawning 1985–08 0.4 −13.58 −5 0.4 no no Yes
Fig. 1. Longitudinal profile of the Columbia Glacier from 1984– 2009, the degree of thinning is comparable along the entire glacier length.
Mass balance measurements along fixed transects are completed each summer on 10 of the glaciers and reported to the World Glacier Monitoring Service (Table 2) (WGMS, 2007). On the other two glaciers mass balance observations were begun, but discontinued due to forest fires preventing access during several years, but transect data exists over a 17 year and 22 year period on Spider and Lyman Glacier re-spectively. Transects of interest here are those that traverse the accumulation zone. Each mass balance transect begins from a fixed point at the glacier margin and the distance be-tween each measurement site is fixed, using a laser ranger with the spacing typically at 50 m. The distance from the glacier edge to the fixed transect start and end point was
noted at the time of initial establishment in 1984 (except Sholes and Easton Glacier in 1990). These provide additional observations of marginal recession in the accumulation zone. By 1998, it was evident that accumulation zone marginal re-cession was occurring. This had not been an expectation in setting up the mass balance transects; the original start and endpoints had been marked simply for consistency in as-sessing mass balance, and the distance to the glacier edge measured, but annual observations of this changing distance were not made. Since 1998 glacier marginal changes at the end of each mass balance transect have become a focus of annual observation. The mean accumulation zone thinning from longitudinal profile data is reported in Tables 1 and 2 along with the range of years for which the thinning is re-ported. The thinning is accompanied by accumulation zone marginal recession noted along the mass balance and longi-tudinal profiles. The observed marginal recession in the ac-cumulation zone is reported for the same time interval as the longitudinal profiles.
While completing the mass balance transects across the accumulation zone it became evident on Lynch Glacier, Foss Glacier, Spider Glacier, Daniels Glacier and Ice Worm Glacier that new bedrock outcrops were emerging. The size and height of the outcrops has not been assessed in detail. The outcrops as Paul et al. (2004) have noted are an indica-tion of downwasting or thinning.
6 Accumulation zone persistence
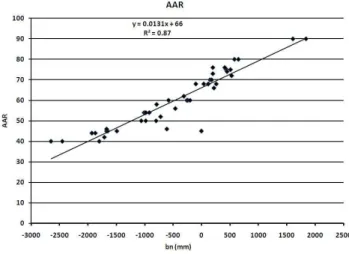
1984–2007 (Pelto, 2008). This equals a 20–40% loss in glacier volume in this interval for North Cascade glaciers (Pelto, 2008). The annual extent of the accumulation zone as a ratio of total glacier is the annual AAR. Each glacier has a unique relationship between its AAR and mass balance, as noted in comparing scatter plots of AAR and mass balance (WGMS, 2008). We contrast the AAR of two glaciers with limited accumulation zone thinning (Easton Glacier, Rain-bow Glacier) and three with extensive accumulation zone thinning (Columbia Glacier, Ice Worm Glacier and Daniels Glacier), to distinguish the difference in AAR (Figs. 2 and 3). The two glaciers with limited accumulation zone thinning had a mean thinning of less than 6 m, less than 33% of mean ablation zone thickness change. The two glaciers with exten-sive accumulation zone thinning have accumulation zone el-evation change greater than 15 m equating to more than 67% of ablation zone thinning.
A comparison (Figs. 2 and 3) illustrate that the equilibrium AAR values for the glaciers are nearly equal ranging from 62% to 66%. The difference is in minimum observed AAR values. Glaciers without significant accumulation zone thin-ning have not had an AAR below 30% for any of the 46 data points. The glaciers with extensive thinning have 22 of the 78 data points with an AAR equal to or below 30%, 28% of the data points. Are the lower AAR values simply indicative of more negative annual balances? The mean annual balance of the two glaciers with limited accumulation zone thinning, −0.50 ma−1, is not significantly different from the mean for the three glaciers with extensive accumulation zone thinning, −0.59 ma−1.
Low AAR values are indicative of the lack of a sizable ac-cumulation zone during specific years. Periodic years with low AAR values identify inconsistent accumulation zones. During years with low AAR values there is a loss of nearly all accumulated snow and firn in the accumulation zone, repeat-edly exposing multiple annual firn layers to ablation, elim-inating accumulation layers from the years when the AAR was higher. This is observed to have occurred on many North Cascade glaciers in 1987, 1992, 1993, 1994, 1998, 2003, 2004, 2005 and 2009. There are years where an ac-cumulation zone exists, but this acac-cumulation does not per-sist through the aforementioned years of extensive negative mass balances. In 2005 on Columbia Glacier (Fig. 4) the ex-posed annual layers in the accumulation zone are evident and indicate no preserved firn from recent years.
7 Observations of accumulation zone change
On Columbia Glacier a longitudinal profile has been com-pleted in 20 of the last 25 years, and every year since 2000. Annual balance measurements from 1984–2007 indicate a mean annual balance of −0.53 ma−1, and a mean AAR of 51%. The distance from the fixed locations beyond the termi-nus and above the head of the glacier is 1800 m. From 1984
Fig. 2.A comparison of AAR values in percentages and annual bal-ance for three glaciers with extensive accumulation zone thinning (Columbia, Daniels and Ice Worm).
Fig. 3.The AAR values as percentages and annual balance for two glaciers with limited accumulation zone thinning (Easton and Rain-bow).
Fig. 4.Accumulation zone of the Columbia Glacier from the head-wall. Notice the number of annual horizons exposed on 1 August, 2005. This is the third consecutive year of significant negative an-nual balances, and follows 2004 when the AAR dropped below 20%.
On Ice Worm Glacier the centerline longitudinal pro-file along which mass balance is also measured indicated a glacier length of 607 m in 1985, and 460 m in 2009, the length had been reduced by 147 m. The distance from the benchmark beyond the head of the glacier to the glacier was 10 m in 1985 and is now 73 m, a 63 m recession. The ter-minus has retreated 84 m in the same period. The primary accumulation zone recession has been along the ridge on the southern margin of the glacier. A mass balance transect from the highest point on the glacier, near the southern lateral edge of the glacier was begun on the glacier 25 m below the ridge-line in 1985. By 2007 the glacier margin was 127 m from the ridgeline, indicating marginal recession of at least 102 m since 1985 (Fig. 6). This section of the glacier is its highest elevation section. In 1992, 1993, 1994, 1998, 2001, 2003, 2004, 2005, 2006 and 2009 this area retained no accumula-tion. Bare firn or ice has been exposed each of these years by late August.
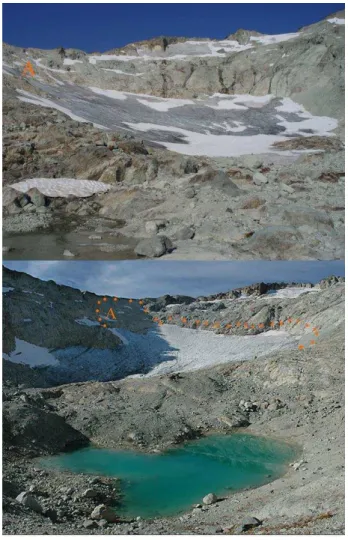
On Lyman Glacier a centerline profile was begun at the head of the glacier in 1986 from a fixed location. Ini-tially mass balance was measured on this glacier annually, however, forest fires restricted access, and only AAR has been recorded each year, mass balance has been measured in 11 years. This headwall location was the principal bench-mark because the terminus ended in a calving ice face. The glacier terminus has been retreating at a rate of 9 ma−1from 1986–2008; however, the length of the glacier has been de-clining at 13 m per year due to recession of the upper margin of the glacier. The distance to the upper edge of the glacier was 15 m in 1986 and 102 m in 2008, indicating a headwall recession of 87 m. A comparison of the upper margin of the glacier in 1986 and 2008 illustrates the considerable new
ex-Fig. 5. Columbia Glacier 1985 (above) and 2006 (below). The black line in the 2006 image indicates the upper margin of the glacier in 1986.
posures of bedrock that had been at the base of the glacier in 1986. Lyman Glacier has had the lowest mean annual AAR of the 12 glaciers that have been part of the NCGCP mass balance program.
Fig. 6. Ice Worm Glacier in 2004 (above) and 2006 (below). The dotted line in the 2006 image indicates the margin of the glacier in 1984. Even in the two years separating these photographs the loss of ice at the upper margin of the glacier is evident near A. Notice the low AAR both years.
Foss Glacier has lost 40% of its area since 1979 (Pelto, 2006). This glacier had an AAR below 30% in 1992, 1998, 2001, 2004 and 2005. The result was rapid recession of the lateral margin of the glacier from the terminus to the head of the glacier and rapid terminus retreat. The glacier width, on a mass balance transect 150 m below the head of the glacier, has been reduced from 1040 m in 1985 to 620 m in 2005 (Fig. 8). Foss Glacier has no significant avalanche or wind drift accumulation locations that have large winter balances. The southern margin has receded the fastest this section had exposed firn or glacier ice by mid-August in each of the years with a low AAR. This glacier is not forecast to survive.
Easton Glacier has retreated 290 m since 1990. Mean abla-tion zone thinning has been 32 m, while thinning in the accu-mulation zone is 5 m. The glacier’s minimum AAR has been 40%. Mean annual balance from 1990–2007 is−0.55 ma−1. There is no evident marginal recession in the accumulation
Fig. 7.Lynch Glacier, North Cascades in 1960 (Austin Post, USGS) and 2007 (below). There are new rock outcroppings in the accumu-lation zone on the right side (west side) of the glacier, the width of exposed rock on the ridge on the right side of the glacier has expanded (AandB). On the left side of the glacier the snow con-nection to the Daniels Glacier which existed up through 1987, is now an exposed ridge (C).
.
Fig. 8.Foss Glacier, North Cascades 1988 and 2005 indicating the change in the extent of the glacier. There is substantial marginal retreat in the accumulation zone and new rock outcroppings in the accumulation zone.
Rainbow Glacier has retreated 410 m since 1984. Mean ablation zone thinning is 25 m, while accumulation zone thinning is 4 m. No change in the marginal position in the ac-cumulation is evident on any transect. No bedrock outcrops have emerged in the accumulation zone.
This glacier is forecast to survive current climate. Mass balance observations were imitated on Spider and Lewis Glacier in 1985, both have completely melted away. Lewis Glacier had an AAR of 0% in 1985 and 1987. Spider Glacier had an AAR of 0% in 1992, 1993, 1998 and 2001.
8 Conclusions
A survival assessment based on accumulation zone thinning as evident by the emergence of new rock outcrops or the recession of the margin of the glacier in the accumulation zone along a substantial portion of its perimeter is applied to thirteen North Cascade glaciers. In the North Cascades ten of the thirteen examined glaciers exhibit accumulation zone thinning characteristics and are forecast not to survive the current climate or future additional warming. The
observa-tion of accumulaobserva-tion zone thinning of many North Cascades raises the question as to their viability. The correlation coef-ficient in annual balance between each glacier exceeds 0.80, regardless of the extent of accumulation zone thinning, indi-cating annual balance alone cannot be use. The similar ter-minus behavior and annual balances of the glaciers indicates the differing survival forecasts is not a simple reflection of differences in mass balance or local climate.
The ratio of accumulation zone thinning to ablation zone thinning as determined by calculation of the longitudinal pro-file thinning factorf provides a useful and more quantita-tive measure of significant accumulation zone thinning. If f >0.6 extensive accumulation zone thinning is noted in ev-ery case. Iff <0.4 the glacier does not exhibit any sub-stantial accumulation zone thinning characteristics. The ra-tio of observed accumulara-tion zone thinning to observed mass balance provides a similar measure, when this ratio exceeds 0.5 accumulation zone thinning is noted. A survival fore-cast based on these two parameters yield the same results as those based on the more visibly evident changes of thickness. A North Cascade glacier is forecast to not survive iff >0.6 and/or the accumulation zone thinning to mss balance ratio exceeds 0.5. Results vary considerably with adjacent glaciers having a different survival forecast. This emphasizes the dan-ger of extrapolating survival from one glacier to the next. This trait also emphasizes the value of developing a simple forecasting tool that can be applied to all glaciers.
A third means of identifying glaciers with significant ac-cumulation zone thinning in the North Cascades is annual AAR observations. Frequent low AAR values, below 30%, indicate the lack of a consistent accumulation zone, which leads to substantial thinning of the glacier in the accumula-tion zone. The three glaciers that have not experienced sig-nificant accumulation zone thinning have not had AAR val-ues below 30% in any year.
Acknowledgements. SPOT imagery provided through a grant from Planet Action. Austin Post donated photographs prints taken from 1955–1979. Frank Paul has provided helpful comments on the paper, and along with Andreas K¨a¨ab and Charles Raymond key research upon which the forecast model is developed.
Edited by: S. Marshall
References
Andreassen, L. M., Paul, F., K¨a¨ab, A., and Hausberg, J. E.: The new Landsat-derived glacier inventory for Jotunheimen, Norway, and deduced glacier changes since the 1930s, The Cryosphere Discuss., 2, 299–339, 2008,
http://www.the-cryosphere.net/2/299/2008/.
Arendt, A., Echelmeyer, K., Harrison, W., Lingle, C., Zirnheld, S., Valentine, V., Ritchie, B., and Druckenmiller, M.: Updated esti-mates of glacier volume changes in the western Chugach Moun-tains, Alaska, and a comparisonof regional extrapolation meth-ods, J. Geophys. Res., 111, F03019, doi:10.1029/2005JF000436, 2006.
Bidlake, W. R., Josberger, E. G., and Savoca, M. E.: Water, Ice, and Meteorological Measurements at South Cascade Glacier, Wash-ington, Balance Years 2004 and 2005: US Geological Survey Scientific Investigations Report 2007–5055, 2007.
Haeberli, W. and Hoelzle, M.: Application for inventory data for estimating characteristics of and regional climate-change effects on mountain glaciers: a pilot study with the European Alps, Ann. Glaciol., 21, 206–212, 1995.
Haeberli, W., Cihlar, J., and Barry, R.: Glacier monitoring within the Global Climate Observing System, Ann. Glaciol., 31, 241– 246, 2000.
Hall, M. P. and Fagre, D. B.: Modeled climate-induced glacier change in Glacier National Park, 1850–2100, Bioscience, 53(2), 131–140, 2003.
Hock, R.: Glacier melt – A review on processes and their modelling, Prog. Phys. Geogr., 29(3), 362–391, 2005.
Hoffman, M. J. Fountain, A. G., and Achuff, J. M.: 20th-century variations in area of cirque glaciers and glacierets, Rocky Moun-tain National Park, Rocky MounMoun-tains, Colorado, USA, Ann. Glaciol., 46, 349–354, 2007.
Hubley, R. C.: Glaciers of Washington’s Cascades and Olympic Mountains: Their present activity and its relation to local cli-matic trends, J. Glaciol., 2(19), 669–674, 1956.
Johannesson, T., Raymond, C., and Waddington E.: Time-scale for adjustment of glacier to changes in mass balance, J. Glaciol., 35(121), 355–369, 1989.
K¨a¨ab, A., Paul, F., Maisch, M., Hoelzle, M., and Haeberli, W.: The new remote-sensing-derived Swiss glacier inventory: II. First re-sults, Ann. Glaciol., 34, 362–366, 2002.
Key, C. H., Fagre, D. B., and Menicke, R. K.: Glacier retreat in Glacier National Park, Montana, in: Satellite image atlas of glaciers of the world, edited by: Williams Jr., R. S. and Ferrigno, J. G., USGS Prof. Pap., 1386-J, 365–375, 2002.
Knoll, C. and Kerschner, H.: A glacier inventory for South Tyrol, Italy, based on airborne laser scanner data, J. Glaciol., 50, 46–52, 2009.
Meier, M. F. and Post, A.: Recent variations in mass net budgets of glaciers western North America, IUGG/IAHS Pub., 58, 63–77, 1962.
Paterson, W. S. B.: Physics of Glaciers, Pergamon Press, Oxford UK, 1981.
Pelto, M. S. and Hedlund, C.: Terminus behavior and response time of North Cascade glaciers, Washington USA, J. Glaciol., 47, 497–506, 2001.
Pelto, M. S. and Riedel, J.: Spatial and temporal variations in an-nual balance of North Cascade glaciers, Washington 1984–2000, Hydrol. Process., 15, 3461–3472, 2001.
Pelto, M. S.: The current disequilibrium of North Cascade Glaciers, Hydrol. Process., 20, 769–779, 2006.
Oerlemans J.: Quantifying global warming from the retreat of glaciers, Science, 264, 243–245, 1994.
Oerlemans, J.:Glaciers and climate change, A.A. Balkena Publish-ers, 2001.
Paul, F., K¨a¨ab, A., Maisch, M., Kellenberger, T. W., and Haeberli, W.: The new remote-sensing-derived Swiss glacier inventory: I. Methods, Ann. Glaciol., 34, 355–361, 2002.
Paul, F., K¨a¨ab, A., Maisch, M., Kellenberger, T. W., and Haeberli, W.: Rapid disintegration of Alpine glaciers ob-served with satellite data, Geophys. Res. Lett., 31, L21402, doi:10.1029/2004GL020816, 2004.
Pelto, M. S. and Hartzell, P. L.: Change in longitudinal profile on three North Cascades glaciers during the last 100 years, Hydrol. Process., 18, 1139–1146, 2004.
Pelto, M. S.: Glacier annual balance measurement, forecasting and climate correlations, North Cascades, Washington 19842006, The Cryosphere, 2, 13–21, 2008,
http://www.the-cryosphere-discuss.net/2/13/2008/.
Post, A., Richardson, D., Tangborn, W. V., and Rosselot, F. L.: In-ventory of glaciers in The North Cascades, Washington, US Ge-ological Survey Prof. Paper, 705-A, 1971.
Schwitter, M. P. and Raymond, C.: Changes in the longitudinal pro-file of glaciers during advance and retreat, J. Glaciol., 39(133), 582–590, 1993.
WGMS: Glacier Mass Balance Bulletin No. 9 (2004–2005), edited by: Haeberli, W., Zemp, M., and Hoelzle, M., ICSU (FAGS)/IUGG (IACS)/UNEP/UNESCO/WMO, World Glacier Monitoring Service, Zurich, Switzerland, 2007.