doi:10.5194/tc-8-639-2014
© Author(s) 2014. CC Attribution 3.0 License.
The Cryosphere
Little Ice Age climate reconstruction from ensemble reanalysis of
Alpine glacier fluctuations
M. P. Lüthi1,*
1VAW Glaciology, ETH Zürich, 8093 Zurich, Switzerland *now at: University of Zürich, 8057 Zurich, Switzerland Correspondence to: M. P. Lüthi (martin.luethi@geo.uzh.ch)
Received: 24 September 2013 – Published in The Cryosphere Discuss.: 22 October 2013 Revised: 14 February 2014 – Accepted: 4 March 2014 – Published: 14 April 2014
Abstract. Mountain glaciers sample a combination of cli-mate fields – temperature, precipitation and radiation – by accumulation and melting of ice. Flow dynamics acts as a transfer function that maps volume changes to a length re-sponse of the glacier terminus. Long histories of terminus po-sitions have been assembled for several glaciers in the Alps. Here I analyze terminus position histories from an ensemble of seven glaciers in the Alps with a macroscopic model of glacier dynamics to derive a history of glacier equilibrium line altitude (ELA) for the time span 400–2010 C.E. The re-sulting climatic reconstruction depends only on records of glacier variations. The reconstructed ELA history is similar to recent reconstructions of Alpine summer temperature and Atlantic Multidecadal Oscillation (AMO) index, but bears little resemblance to reconstructed precipitation variations. Most reconstructed low-ELA periods coincide with large ex-plosive volcano eruptions, hinting at a direct effect of vol-canic radiative cooling on mass balance. The glacier ad-vances during the LIA, and the retreat after 1860, can thus be mainly attributed to temperature and volcanic radiative cool-ing.
1 Introduction
Proxy-based climate reconstructions are an important source of information on past climate variability and help to as-sess whether the climate change presently observed is un-precedented in a long-term context (IPCC, 2007). Some of these proxies, notably tree-ring data, give a detailed picture of summer temperature variations (e.g., Mann et al., 2009; Büntgen et al., 2006, 2011), while historic records provide
more qualitative, but very detailed information (e.g., Pfister, 1999; Casty et al., 2005). Records of glacier length changes (GLCs) provide supplementary independent information but are caused by fundamentally different processes.
GLCs have been used in a qualitative manner to con-firm climate reconstructions from other proxies (Guiot et al., 2010) or compare them with solar forcing reconstructions (e.g., Beer et al., 2009; Nussbaumer et al., 2011). However, such comparisons suffer from the delayed response of glacier length to climatic or radiative forcing, and are only valid on long timescales.
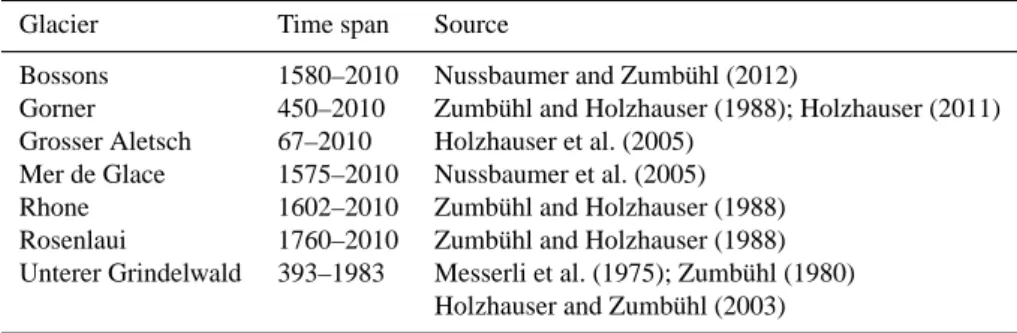
Table 1. Sources of glacier length change data used in this study.
Glacier Time span Source
Bossons 1580–2010 Nussbaumer and Zumbühl (2012)
Gorner 450–2010 Zumbühl and Holzhauser (1988); Holzhauser (2011) Grosser Aletsch 67–2010 Holzhauser et al. (2005)
Mer de Glace 1575–2010 Nussbaumer et al. (2005) Rhone 1602–2010 Zumbühl and Holzhauser (1988) Rosenlaui 1760–2010 Zumbühl and Holzhauser (1988) Unterer Grindelwald 393–1983 Messerli et al. (1975); Zumbühl (1980)
Holzhauser and Zumbühl (2003)
a dynamical system in the variables “length”Land “volume” V derived in Lüthi (2009). Essentially, the glacier behaves as a slightly over-damped harmonic oscillator in one of the macroscopic variablesL or V around a steady state (Har-rison et al., 2003). The advantage of using a macroscopic model is that no knowledge of the usually complex and in-sufficiently known glacier bed geometry or basal sliding is required. Instead, two model parameters are determined with an optimization procedure, which yields theLV-model with the most similar length response under a given ELA his-tory. Such a dynamically equivalent simple model (DESM) is useful to systematically analyze GLC records (Lüthi and Bauder, 2010), and to infer glacier volume change from GLCs (Lüthi et al., 2010).
Here I use seven very long glacier terminus position records from the Alps to derive glacier equilibrium line al-titude (ELA) for the period 400–2010 C.E. The ELA history causing the observed GLCs is determined with an optimiza-tion procedure which employs the macroscopic LV-model for each of the seven glaciers. The resulting glacier ELA vari-ations are completely independent of any other proxy data, and are indicators of summer temperature, winter precipita-tion and radiaprecipita-tion (Vincent et al., 2004; Ohmura et al., 2007; Huss et al., 2009; Thibert et al., 2013). The reconstructed ELA histories are then compared to other proxy-based re-constructions of European summer temperature, total solar irradiance, and volcanic cooling.
2 Data and methods
2.1 Length change data
In the Alps, GLCs have been systematically monitored since about 1860 when most glaciers receded from their last maxi-mum extent of the Little Ice Age cold period (LIA, ca. 1550– 1850 C.E.). Older reconstructions are based on photographs, paintings, written records, and the positions of trees de-stroyed by glacier advance, and dated by dendrochronol-ogy or the carbon-14 method. The longest such reconstruc-tion has been assembled for Grosser Aletsch glacier, and similar records exist for the glaciers Gorner, Rhone,
Rosen-laui, Unterer Grindelwald, Mer de Glace and Bossons (data sources are listed in Table 1). These historical GLC series have been complemented with recent data from the Swiss Glacier Monitoring Network (Glaciological Reports, 1881– 2011) and other sources (Vincent et al., 2005, A. Bauder, per-sonal communication, 2012).
2.2 Macroscopic glacier model
Climatic interpretation of GLC has to take into account the combination of direct and delayed response of the glacier ter-minus to climate forcing. The direct response is caused by the difference between the rates of ice melt and mass transport to the terminus. Ice melt varies rapidly with changes of temper-ature and radiation, while mass transport varies slowly due to upstream geometry changes, which affect ice flow patterns. A glacier model represents the transfer function from vol-ume change to length change, and depends on glacier size, bedrock geometry, and surface mass balance distribution.
The model used here represents glacier dynamics on a macroscopic level, and results in a dynamical system in the variables “length”Land “volume”V for unit glacier width, referred to as theLV-model (Eq. 40 in Lüthi, 2009):
dV dt = ˙g
V +ZL−s
2L
2, (1a)
dL dt =
1
τa
" V
a
µ1
−L
#
. (1b)
Here,g˙=∂b˙
500 1000 1500 2000 Bossons
Rosenlaui
Mer de Glace
Rhone
Unt. Grindelwald
Grosser Aletsch
Gorner
Year AD
Terminus Position (km)
0 1 2 0
1 2 3 0 1 2 3
0 1 2 3 0 1 2 1 2
0 1 2 3 4
Fig. 1. Comparison of modeled and measured terminus position histories of seven glaciers. Results from the best-matching model run are
shown with a red line, which is hidden in intervals without length constraints. Black dots mark individual terminus position measurements, orange horizontal lines represent the life spans of trees killed by advancing glaciers (Table 1 for data sources).
of the bed andzELA(t )is the time dependent elevation of the
equilibrium line.
2.3 ELA reconstruction
TheLV-model (Eq. 1) was solved forward in time with an ODE solver (LSODA from ODEPACK, Hindmarsh, 1983), and evaluated on a yearly time step. To drive the LV -model and hence calculate glacier response, an ELA his-toryzELA(t )is prescribed as a forcing function, changing the
Z(t )=z0−zELA(t )term of Eq. (1a). In theLV-model,
lo-cal mass balance rate is given as linear function of elevation
˙
b(z)= ˙g(z−zELA)with a constant vertical gradient of local
mass balance rateg. A value of˙ g˙=0.008 yr−1was assumed for this study, which is a good average for the central Alps (e.g. Chen and Funk, 1990; Huss et al., 2008; Table 3); using
˙
g=0.007 yr−1changed the results only marginally.
The climate history is represented by constant ELA values within fixed size intervals (10 years between 0 and 1200 C.E., 5 years between 1200 and 2010 C.E.). These 283 ELA val-ues are unknowns to be determined in an optimization proce-dure. Additionally, two parameters (slopesand vertical ex-tent Z0=Z(t=0)) are sought for each of the seven LV
-models representing the seven glaciers. Optimization was performed with two algorithms, leading to very similar
re-sults: a reversible jump Markov chain–Monte Carlo (RJ-MCMC) algorithm, and the BOBYQA optimizer (Powell, 2009; Johnson, 2012). The cost function for the optimiza-tion is constructed by summing the squares of differences between modeled and measured GLCs. A large penalty was added to the cost in case of violation of one-sided constraints on glacier length (e.g., living trees or terminus moraines), and no cost was added if no constraints are available. The model runs were initialized with random glacier parameters, and zero (or random) ELA variations.
3 Results
3.1 Reconstructed length changes
Table 2.LV-model parameters of the best-matching DESM: ver-tical elevation difference of the accumulation areaZ0, bed slope
angles of theLV-modelβLV, average slope angles of the whole glacier and the ablation areaβtot and βabl, the Harrison volume
timescaleτv, and the length response timescaleτa.
Glacier Z0 βLV βtot βabl τv τa
Bossons 4235 15.8 24.0 24.0 8 1.7 Gorner 630 3.9 8.0 1.2 67 13.0 Grosser Aletsch 1090 3.5 3.5 3.0 53 10.6 Mer de Glace 2190 6.7 9.0 4.5 22 4.7
Rhone 1940 5.9 6.6 5.0 26 5.5
Rosenlaui 685 12.2 14.5 16.0 27 5.7 Unt. Grindelwald 1090 6.8 12.0 9.0 32 6.7
individual terminus positions since 1600 C.E. when dense data are available. Root mean square (rms) differences are smaller than 20 m. Most absolute differences are smaller than 150 m, but are occasionally as high as 300 m. Since theLV -model geometry with a single slope is highly idealized, per-fect agreement between observed and modeled GLCs cannot be expected. Terminus positions are strongly influenced by details of terminus bedrock geometry such as cliffs (glaciers Mer de Glace, Unterer Grindelwald and Rosenlaui) or ter-minus areas with strong topographic breaks (Rhone). By us-ing an ensemble of glaciers with different geometries and re-sponse characteristics, the dependence of the overall result on such geometric peculiarities is reduced.
Table 2 lists the optimizedLV-model parameters of the best-fitting DESMs, and their volume and length timescales. Vertical elevation differences,Z0, and bed slopes,s, differ
considerably from the values of real glaciers. As discussed in Lüthi et al. (2010) these quantities include the effects of basal motion and terminus geometry, which are ignored in the simplisticLV-model dynamics and geometry.
The modeled GLCs obtained with the reconstructed ELA histories are robust against omission of length constraints and variations of glacier parameters (changingsby 5 %, andZ0
org˙by 10 % leads to 1 % changes in length change variabil-ity). During several time periods with small glacier extent no terminus position data are available and modeled terminus positions assume a wide spread of values (around 700, 900, 1000 and 1400–1530 C.E., hidden red lines in Fig. 1). Conse-quently, no information on ELA variations during these pe-riods can be extracted, and the modeled terminus positions and reconstructed ELAs can assume a wide variety of values within these periods.
The low reconstructed ELAs during the period 1300– 1350, only documented from trees killed by the advancing Gorner glacier, lead to large modeled advances of several glaciers that exceed the 1850 terminus positions. Indeed, on the Rhone glacier several moraine ridges from the early me-dieval period are documented, which could correspond to this reconstructed 1350 maximum position (Zumbühl and
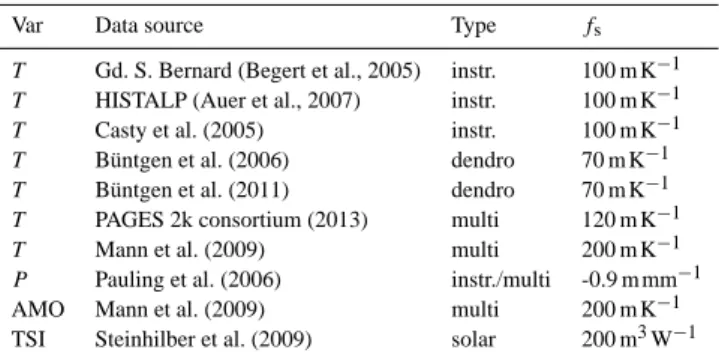
Table 3. ELA sensitivity factorsfsused in the data comparisons in
Figs. 2–4.
Var Data source Type fs
T Gd. S. Bernard (Begert et al., 2005) instr. 100 m K−1
T HISTALP (Auer et al., 2007) instr. 100 m K−1
T Casty et al. (2005) instr. 100 m K−1
T Büntgen et al. (2006) dendro 70 m K−1
T Büntgen et al. (2011) dendro 70 m K−1
T PAGES 2k consortium (2013) multi 120 m K−1
T Mann et al. (2009) multi 200 m K−1
P Pauling et al. (2006) instr./multi -0.9 m mm−1
AMO Mann et al. (2009) multi 200 m K−1
TSI Steinhilber et al. (2009) solar 200 m3W−1
Holzhauser, 1988). The slowly reacting glaciers Gorner and Grosser Aletsch on the other hand only reach terminus posi-tions that are less advanced than their 1850–1860 maximum.
3.2 Reconstructed ELA history
The reconstructed ELA histories leading to the best agree-ment between modeled and measured GLCs are shown in Figs. 2–4. Noteworthy are extended periods of low ELA which coincide with large and rapid glacier advances. Fig-ure 2 shows rapid ELA oscillations between 1650 and 1830, which correspond to the rapidly varying terminus positions of the fast-reacting glaciers (Bossons, Mer de Glace, Unterer Grindelwald and Rosenlaui, Fig. 1).
Periods of high ELA (high summer temperature and radia-tion, low solid precipitation), corresponding to decreasing or small glacier extents, are mostly missing in the reconstruc-tion before 1600. This is due to the lack of data on shorter glacier extents, traces of which might still be buried under the glaciers. The period with highest ELAs begins after 1980, ex-ceeding the reconstructed values of the preceding 1600 years. Since present-day glacier geometries have not yet fully ad-justed to the climate of the last decades (depending on glacier response time) the reconstructed ELA during the last decades might be considerably higher. The reason for this incomplete recent reconstruction is the delayed reaction of the terminus to mass balance changes.
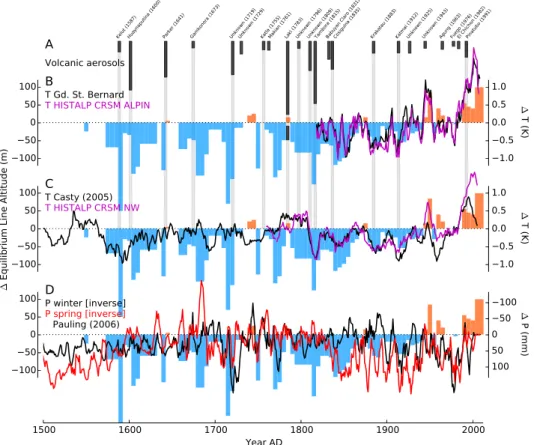
3.3 Comparison with instrumental data
The reconstructed ELA history is compared to instrumen-tal temperature data in Fig. 2. The agreement of sum-mer (JJAS) temperature with the high-Alpine Grand Saint Bernard meteorological station (2500 m a.s.l., Begert et al., 2005) and with the HISTALP CRSM Alpin multi-station reconstruction (Auer et al., 2007) in Fig. 2b is reassuring. To obtain similar variability of the records, the sensitiv-ity factor between reconstructed ELA and temperature is fs=80–100 m K−1(i.e., 80–100 m ELA change per Kelvin
10050 0 50
100 100
50 0 50 100 10050
0 50 100
1.0 0.5 0.0 0.5 1.0 10050
0 50 100
1.0 0.5 0.0 0.5 1.0
1500 1600 1700 1800 1900 2000
Year AD
∆
Eq
uil
ibr
ium
Li
ne
Al
titu
de
(m
)
∆
P
(m
m)
∆
T (K
)
∆
T (K
)
Laki (1783) Agung (1963)El Chichon (1982) Kelut (1587)Huaynaputina (1600)Parker (1641) Gamkonora (1673) Unknown (1719)Unknown (1729)Katla (1755)Makian (1761) Unknown (1796)Unknown (1809)Tambora (1815)Babuyan Claro (1831)Cosiguina (1835) Krakatau (1883)Katmai (1912)Unknown (1925)Unknown (1943)Fuego (1976)Pinatubo (1991)
Volcanic aerosols
T Gd. St. Bernard
T HISTALP CRSM ALPIN
T Casty (2005)
T HISTALP CRSM NW
P winter [inverse] P spring [inverse]Pauling (2006)
A
B
C
D
Fig. 2. ELA variation reconstruction leading to best agreement with length change records from seven glaciers (Fig. 1). Modeled ELAs are
shown with red and blue colored areas. Instrumental records are shown for comparison in panels (B) and (C) as 5-year running means of summer (JJAS) temperature (data from MeteoSwiss (Begert et al., 2005), Casty et al. (2005) and HISTALP (Auer et al., 2007)). Panel (D) displays winter and spring precipitation as 5-year running means (Pauling et al., 2006). (A) and vertical stripes show timing and magnitude of the Northern Hemisphere stratospheric sulfate loading from explosive volcanism (Gao et al., 2008; Arfeuille et al., 2014).
literature: 97 m K−1 (Thibert et al., 2013), 113 m K−1 (Oer-lemans, 2010), and 60–70 m K−1(Vincent, 2002).
Comparisons with the HISTALP CRSM NW (Auer et al., 2007) and the Casty et al. (2005) reconstruction of European temperature, reaching back to 1768 and 1500 C.E., are shown in Fig. 2c. The ELA reconstruction shows similar tempera-ture variability after 1820, but is considerably lower before (by 100 m, or 1 K), while the timing of high and low tem-perature events tends to agree. Such a discrepancy might be caused by a suspected warm bias in the early instrumental data (Frank et al., 2007; Böhm et al., 2010).
To evaluate the role of precipitation, a comparison with the gridded reconstruction form Pauling et al. (2006) is shown in Fig. 2d. Average precipitation values of winter and spring precipitation from 12 grid cells over the Alpine area are displayed. The low-ELA phases of 1712–1717, 1747– 1752, 1912–1922 and 1952–1957 coincide with high winter precipitation, while the periods 1712–1717, 1767–1777 and 1952–1957 coincide with high spring precipitation. None of the other precipitation variations are reflected in the recon-structed ELAs. Summer precipitation is mostly uncorrelated with the reconstructed ELAs and therefore not shown.
3.4 Comparison with proxy records
The reconstructed ELA history was compared to many long climate reconstructions of mid-European temperature from proxy data such as tree-rings, lake sediments, ice cores and speleothems. Since glacier mass balance is controlled by a combination of processes, one cannot expect one single proxy record to agree with the ELA history. In addition, cli-mate variability at high elevation might differ significantly from the low elevations from which most proxy records are recovered.
10050 0 50 100
0.6 0.4 0.2 0.0 0.2 0.4 0.6 10050
0 50 100
0.6 0.4 0.2 0.0 0.2 0.4 0.6 10050
0 50 100
0.6 0.4 0.2 0.0 0.2 0.4 0.6
400 600 800 1000 1200 1400 1600 1800 2000
Year AD
∆
Eq
uil
ibr
ium
Li
ne
Al
titu
de
(m
)
T Mann NH (2009)
∆
T (K
)
AMO Mann (2009)
AMO (K)
TSI Steinhilber (2009) ∆
TSI
(W
/m
2
)
VOLC Gao (2008)
A
B
C
D
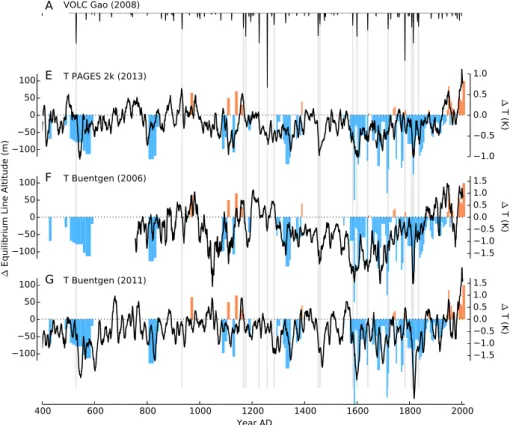
Fig. 3. ELA variation reconstruction for the time span 400–2010 compared to unsmoothed climate records from different proxies. (A)
Northern Hemisphere stratospheric sulfate loading from explosive volcanism (Gao et al., 2008). (B) total solar irradiance (TSI, red; Stein-hilber et al., 2009), (C) AMO index reconstruction (black; Mann et al., 2009), (D) multi-proxy temperature reconstruction for the Northern Hemisphere (yearly average) (Mann et al., 2009).
annual-mean temperature history for Europe (PAGES 2k consortium, 2013, Fig. 4e;) is very similar to the ELA re-construction throughout the considered 1600 years. It shows most of the early cold events (550, 800, 1100 C.E.) that are absent in other proxy records, but for which marked glacier advances are documented (Fig. 1). Tree-ring-based temper-ature histories of the Alps (Fig. 4f; Büntgen et al., 2006) and central Europe (Fig. 4g; Büntgen et al., 2011) show an overall close agreement with the ELA reconstruction. Tree growth is predominantly a proxy for summer (JJAS) temper-ature, which coincidentally is the same period which affects glacier melt, and thus glacier mass balance variability (e.g., Huss et al., 2008).
Figure 3b shows that reconstructed ELA variations resem-ble total solar irradiance (TSI; Steinhilber et al., 2009) dur-ing the period 1700–1950, but bear little similarity before 1700. The cooling effect of explosive volcanism can be eval-uated with the top panels and gray vertical bars in Figs. 2– 4, indicating the Northern Hemisphere stratospheric sulfate load from big volcanic eruptions (Gao et al., 2008; Arfeuille et al., 2014, NH, v2). It is noteworthy that most of the low-ELA phases during the LIA coincide with, or are preceded by, high stratospheric sulfate loads from volcanic eruptions. This aspect is investigated in the discussion below.
4 Discussion
Figure 1 shows the remarkable result that one single ELA history (Fig. 3) causes long-term GLCs of seven Alpine glaciers with very different geometries that mostly agree with the documented record. This result justifies a posteriori the important assumption that all GLCs are caused by the same ELA history. This assumption is also supported by studies of glacier mass balance variability (Vincent et al., 2004; Huss et al., 2009). Even if all glaciers are in the same mountain range and within 130 km of each other, local climate, and es-pecially precipitation, vary on short spatial scales, while their variability is similar (e.g., Frei and Schär, 1998; Casty et al., 2005). Long-term instrumental records show that variations in temperature are closely linked over the Alps (e.g., Casty et al., 2005; Auer et al., 2007).
10050 0 50 100
1.5 1.0 0.5 0.0 0.5 1.0 1.5 10050
0 50 100
1.5 1.0 0.5 0.0 0.5 1.0 1.5 10050
0 50 100
1.0 0.5 0.0 0.5 1.0
400 600 800 1000 1200 1400 1600 1800 2000
Year AD
∆
Eq
uil
ibr
ium
Li
ne
Al
tit
ud
e (
m)
T Buentgen (2011)
∆
T (K
)
T Buentgen (2006)
∆
T (K
)
T PAGES 2k (2013)
∆
T (K
)
VOLC Gao (2008)
A
E
F
G
Fig. 4. ELA variation reconstruction for the time span 400–2010 compared to climate records from different proxies. (A) Northern
Hemi-sphere stratospheric sulfate loading from explosive volcanism (Gao et al., 2008). (E) multi-proxy temperature reconstruction (PAGES 2k consortium, 2013). (F, G) temperature reconstructions from tree rings (Büntgen et al., 2006, 2011). All temperature curves are smoothed with a 7-year running mean.
by the responses of seven glaciers with very different geome-tries.
An important aspect of the presented method is that ter-minus positions documented for some glaciers can be used to infer missing data of the remaining glaciers. A sufficiently long calibration time span with well-documented glacier ad-vances and retreats is a prerequisite to obtaining good pa-rameters for the DESM glacier models. Obviously, modeled GLCs still differ from reality by the simplistic model dynam-ics and the assumed geometry which cannot represent the dynamical effects of small-scale terminus topography. How-ever, the overall timing and range of GLCs are stable.
4.1 Warm periods
The ELA values during warm periods with significant glacier retreat cannot be inferred from the terminus position record because of lack of data on minimum extents for the con-sidered glaciers (which might still be buried under ice). Ex-tended warm periods with glacier extents equal to, or smaller than today are possible within the gaps in the record, i.e., be-tween 650–800, 850–950, 980–1050, 1200–1280, and 1400– 1550 C.E. Recent findings of washed-out peat and wood from pro-glacial forefields of other Alpine glaciers indicate glacier
extents smaller than the present between 690–780 (Hormes et al., 2001, 2006; Joerin et al., 2006). No similar findings are reported for the other periods.
4.2 Climatic interpretation
4.2.1 Total solar irradiance
Several recent studies state that GLCs are closely related to total solar irradiance (TSI), although the similarity is limited to several time spans (e.g., Beer et al., 2009; Nussbaumer et al., 2011). Since GLCs are mostly a delayed reaction to climate forcing, a more direct relationship should exist be-tween ELA variations and shortwave radiation. The compar-ison with TSI in Fig. 3b does not support the hypothesis of a direct influence of solar variability on glacier mass balance, except for the limited time span 1700–1950, where the simi-larity is striking. After 1950 the TSI declines, whereas ELA strongly rises. Before 1700 the two quantities seem mostly unrelated.
The above reasoning does not exclude the potentially important radiation modulation by atmospheric processes (aerosols, moisture, cloudiness) which is likely important for glacier mass balance (Ohmura et al., 2007; Huss et al., 2009). Since no long-term reconstructions of these parameters exist, their influence cannot be meaningfully investigated with the presented ELA reconstruction.
4.2.2 Volcanic cooling
A potentially important cause for the episodic and rapid glacier advances, reflected in the reconstructed low ELA pe-riods, is radiative summer cooling by big volcano eruptions. Stratospheric sulfate aerosols from large explosive tropical volcano eruptions cause northern hemispheric summer cool-ing and altered circulation patterns (e.g., Crowley, 2000; Robock, 2000; Zanchettin et al., 2013). They cause incoming solar radiation reduction by several W m−2for 2 years (e.g., Robock, 2000; Weber, 2005; Fischer et al., 2007; Zanchet-tin et al., 2012), and an effect of 0.2 K cooling lasZanchet-ting about 4 years in central Europe (Esper et al., 2013b). The full range of cold periods caused by volcanic events might not even be recorded in tree rings (Mann et al., 2012). Increased summer precipitation in the following cool summers was attributed to the eruptions (Wegmann et al., 2014) which likely leads to considerably more positive mass balances. Longer-term persistence of cold summers is likely through sea ice/ocean feedback mechanisms, possibly even explaining the onset of the LIA cold period (Miller et al., 2012; Schleussner and Feulner, 2013) although this is a topic under debate (Esper et al., 2013b).
Northern Hemisphere stratospheric sulfate loads recon-structed from ice core data (Gao et al., 2008) are shown in panels A of Figs. 2–4. It is striking that most reconstructed low-ELA phases during the LIA coincide with, or are closely preceded by, high stratospheric sulfate loads (marked with gray vertical bars). Thus volcanic cooling might explain most of the short-lived, rapid LIA glacier advances of the glaciers Bossons, Mer de Glace, and Unterer Grindelwald (Fig. 1). Low-ELA phases since 1580 (in 5-year steps from the recon-struction) are compared to eruptions in Table 4 and Fig. 2. All
Table 4. Phases of very low reconstructed ELA between 1580 and
1920, and explosive tropical volcano eruptions causing significant aerosol loading in the Northern Hemisphere (NH). The1trow indi-cates the number of years of delay (+) or advance (−) with respect
to the eruptions. The estimated NH stratospheric aerosol loading (based on ice cores, Gao et al., 2008) is given in the last column (data from Table 1 in Arfeuille et al., 2014).
t0 t1 1t Year Volcano NH (Tg)
1587 1592 +0 1587 Kelut
1602 1612 +2 1600 Huaynaputina 46.0
1637 1642 +0 1641 Parker 33.8
1677 1687 +4 1673 Gamkonora 6.3
1712 1717 −2 1719 Unknown NH 31.5
1729 Unknown NH 12.0
1747 1752 −3 1755 Katla 8.0
1761 Makian 8.4
1767 1777 −6 1783 Laki (mostly tropospheric) 93.0
1796 Unknown NH 6.7
1809 Unknown 27.6
1812 1817 +0 1815 Tambora 58.7
1831 Babuyan Claro 17.0
1837 1847 +2 1835 Cosiguina 26.4
1882 1892 +0 1883 Krakatau 11.2
1912 1922 +0 1912 Katmai 11.0
of these cold phases are within±4 years of major eruptions, with the exception of the very large 1783 Laki event, which precedes reconstructed low ELAs by 6 years. This eruption was mainly tropospheric and caused a very cold year 1783/84 in Europe (e.g., Robock, 2000).
The hypothesis of a volcanic cooling effect on glacier mass balance is supported by Table 4, but the occurring time shifts of several years have to be explained. While the accuracy of the timing of big volcano eruptions is good (layer counting in ice cores), reconstructed glacier terminus positions are less well constrained. Old paintings are sometimes not accurately dated, and radiocarbon ages of trees have sometimes large error bars. Moreover, tree trunks are recovered from a vari-ety of positions with respect the glacier snout, which itself is not of constant shape, so that another source of dating error results. Furthermore, the ELA reconstruction uses bins of 5 years with constant ELA, such that the dates of reconstructed ELAs are of the same order at best. Whether such effects ex-plain the time lags between volcanoes and cold ELA phases could be assessed by forward modeling of GLCs with a com-bination of climate time series as forcing functions. Such work is currently in progress, and hints at an important role of volcanic forcing.
reconstructions from Büntgen et al. (2011) and PAGES 2k consortium (2013).
The absence of any recorded glacier advance after the very large 1258 volcanic eruption (Oppenheimer, 2003) is note-worthy. Although the dimming effect of volcanic aerosols only pertains to a few years, advances of several hundred meters of the fast-reacting glaciers (Bossons, Mer de Glace, Rosenlaui) were recorded following each volcanic event af-ter 1600. The lack of traces of a glacier advance afaf-ter 1258 hints at small glacier extents during the period 1200–1300.
4.2.3 Atlantic Multidecadal Oscillation
Huss et al. (2010) concluded from a study of 20th century glacier mass balance that the Atlantic Multidecadal Oscilla-tion (AMO) strongly influences glacier mass balance in the Alps. Figure 3c shows the comparison between a long AMO series (Mann et al., 2009) and the reconstructed ELA history. After 1250 C.E. the timing of warm and cold phases and the variability is very similar, although the low ELA events still would have to be explained by volcanic cooling. Our ELA reconstruction could thus be interpreted to support the hy-pothesis that the AMO influences mass balance of Alpine glaciers.
4.3 The riddle of the Little Ice Age glacier advance
Several studies concluded that the rapid glacier advances during the Little Ice Age (LIA, ca. 1550–1850 C.E.), and the last maximum extent around 1850–1865 cannot be ex-plained using homogenized instrumental temperature data (e.g., Nesje and Dahl, 2003; Vincent et al., 2005; Lüthi et al., 2010; Nussbaumer et al., 2011). Likely processes leading to this rapid glacier growth are increased accumulation due to 25 % higher winter precipitation than present (Vincent et al., 2005), or reduced melt due to lower incoming shortwave ra-diation (Miller et al., 2012). More qualitatively, Nussbaumer et al. (2011) conclude that “a combination of low solar forc-ing, frequent and strong volcanic eruptions, and dynamic ef-fects due to internal variability of the climate system led to the prominent glacier advances during the LIA”. The rapid recession of the glaciers after 1865 has been explained by glacier surface darkening, and thus albedo reduction, by in-creasing release of industrial black carbon (Painter et al., 2013).
The agreement between our ELA reconstruction and sev-eral reconstructions of temperature (Fig. 4e, PAGES 2k con-sortium, 2013; f, Büntgen et al., 2006; g, Büntgen et al., 2011) and AMO index (Fig. 3c, Mann et al., 2009) show that additional large changes in winter precipitation are not needed to explain the rapid glacier advances, although higher summer precipitation has been inferred between 1700 and 1810 from tree-ring reconstruction (Büntgen et al., 2011), and wetter winters were frequent between 1800–1850
(Paul-ELA during the LIA can be mostly explained by the effect of volcanic eruptions on incoming radiation. Also, the rapid melt-back of the glaciers after 1860 can be explained by temperature alone, without additional albedo changes due to black carbon (Painter et al., 2013).
The question remains why before 1850 the homogenized instrumental temperature records (Casty et al., 2005; Auer et al., 2007) are considerably (∼0.5–1 K) higher than the recent temperature reconstructions of Buentgen (tree rings) and PAGES (multi-proxy). One explanation is that early in-strumental measurements were biased because of inadequate shading from solar radiation of the thermometers (Frank et al., 2007; Böhm et al., 2010). Another possible explana-tion is the lack of instrumental temperature data from the Alps before 1850, which requires the extrapolation of data from distant stations.
5 Conclusions
The presented method to reconstruct ELA variations from a set of GLC records yielded a new 1600-year history, which is independent of other instrumental or proxy data. Through the simultaneous optimization on the GLCs of seven glaciers with one ELA history, the result is less sus-ceptible to geometry-dependent peculiarities of terminus dy-namics of individual glaciers. Resulting GLCs automatically fill gaps in individual length change records, and recorded variability from fast-reacting glaciers is transferred to slowly reacting glaciers.
The obtained ELA history agrees well with tree-ring-derived- and multi-proxy temperature reconstructions. Also, a close correspondence with the AMO index between 1250 and 2010 could be observed. Long-term and short-term variability of these reconstructions are reproduced with the glacier record. This shows that analysis of temperature records with independent GLC records is a useful tool to in-dependently validate these proxy-based reconstructions.
Additionally, the reconstructed ELA history shows cold phases only partially recorded in the proxy records, most of which closely correspond to explosive tropical volcanic eruptions during the LIA period. This hints at a strong direct influence of stratospheric radiation scattering from volcanic aerosols on the energy balance on the glacier surface. The de-pendence of summer mass balance on radiative forcing and the cooling due to changing stratospheric volcanic aerosols are not yet well understood.
due to industrial black carbon, are not needed to explain the observations. Work to identify the relative importance of different climate fields for the resulting GLCs with help of macroscopic glacier models is currently under way.
An additional avenue for further analysis are the glacier volume changes that the LV-model calculates simultane-ously. After calibration with measured volume change data, such model results could be used to quantify long-term runoff changes from glaciers. Such an analysis might decide a 150-year-old dispute as to whether glacier melt is to blame for frequent flooding and very high lake levels of Lac Léman (Lake Geneva) in the 1870–1880s, which was the main rea-son for the long and detailed investigation of glacier changes.
Acknowledgements. Thoughtful conversations with Will
Harri-son, Martin Funk, Heinz J. Zumbühl, Samuel Nussbaumer and Heinz Wanner are gratefully acknowledged. Comments from re-viewers Tómas Jóhannesson, Paul Leclercq and Gerard Roe helped improve the clarity of the presentation.
Edited by: G. H. Gudmundsson
References
Arfeuille, F., Weisenstein, D., Mack, H., Rozanov, E., Peter, T., and Brönnimann, S.: Volcanic forcing for climate modeling: a new microphysics-based data set covering years 1600-present, Clim. Past, 10, 359–375, doi:10.5194/cp-10-359-2014, 2014.
Auer, I., Böhm, R., Jurkovic, A., Lipa, W., Orlik, A., Potz-mann, R., Schöner, W., Ungersböck, M., Matulla, C., Briffa, K., Jones, P., Efthymiadis, D., Brunetti, M., Nanni, T., Maugeri, M., Mercalli, L., Mestre, O., Moisselin, J.-M., Begert, M., Müller-Westermeier, G., Kveton, V., Bochnicek, O., Stastny, P., Lapin, M., Szalai, S., Szentimrey, T., Cegnar, T., Dolinar, M., Gajic-Capka, M., Zaninovic, K., Majstorovic, Z., and Nieplova, E.: HISTALP – historical instrumental climatolog-ical surface time series of the greater Alpine region 1760–2003, Int. J. Climatol., 27, 17–46, 2007.
Beer, J., Abreu, J. A., and Steinhilber, F.: Sun and plan-ets from a climate point of view, in: Universal Heliophys-ical Processes, no. 257 in Proceedings IAU Symposium, doi:10.1017/S1743921309029056, 2009.
Begert, M., Schlegel, T., and Kirchhofer, W.: Homogeneous temper-ature and precipitation series of Switzerland from 1864 to 2000, Int. J. Climatol., 25, 65–80, 2005.
Böhm, R., Jones, P., Hiebl, J., Frank, D., Brunetti, M., and Maugeri, M.: The early instrumental warm-bias: a solution for long central european temperature series 1760–2007, Climatic Change, 101, 4167, doi:10.1007/s10584-009-9649-4, 2010. Breitenmoser, P., Beer, J., Brönnimann, S., Frank, D.,
Stein-hilber, F., and Wanner, H.: Solar and volcanic fingerprints in tree-ring chronologies over the past 2000 years, Palaeogeogr. Palaeocl., 313–314, 127–139, doi:10.1016/j.palaeo.2011.10.014, 2012.
Büntgen, U., Frank, D. C., Nievergelt, D., and Esper, J.: Summer Temperature Variations in the European Alps, A.D. 755–2004, J. Climate, 19, 5606–5623, 2006.
Büntgen, U., Tegel, W., Nicolussi, K., McCormick, M., Frank, D., Trouet, V., Kaplan, J. O., Herzig, F., Heussner, K.-U., Wan-ner, H., Luterbacher, J., and Esper, J.: 2500 years of European climate variability and human susceptibility, Science, 331, 578– 582, doi:10.1126/science.1197175, 2011.
Callendar, G.: Note on the relation between the height of the firn line and dimensions of a glacier, J. Glaciol., 1, 459–461, 1950. Casty, C., Wanner, H., Luterbacher, J., Esper, J., and Böhm, R.:
Temperature and precipitation variability in the Euro-pean Alps since 1500, Int. J. Climatol., 25, 1855–1880, doi:10.1002/joc.1216, 2005.
Chen, J. and Funk, M.: Mass balance of Rhonegletscher during 1882/83–1986/87, J. Glaciol., 36, 199–209, 1990.
Crowley, T.: Causes of climate change over the past 1000 years, Science, 289, 270–277, 2000.
Esper, J., Büntgen, U., Luterbacher, J., and Krusic, P. J.: Testing the hypothesis of post-volcanic missing rings in temperature sensi-tive dendrochronological data, Dendrochronologia, 31, 216–222, doi:10.1016/j.dendro.2012.11.002, 2013a.
Esper, J., Schneider, L., Krusic, P. J., Luterbacher, J., Büntgen, U., Timonen, M., Sirocko, F., and Zorita, E.: European summer tem-perature response to annually dated volcanic eruptions over the past nine centuries, Bull. Vocanol., 75, 736, doi:10.1007/s00445-013-0736-z, 2013b.
Fischer, E. M., Luterbacher, J., Zorita, E., Tett, S. F. B., Casty, C., and Wanner, H.: European climate response to tropical volcanic eruptions over the last half millennium, Geophys. Res. Lett., 34, L05707, doi:10.1029/2006GL027992, 2007.
Frank, D., Büntgen, U., Böhm, R., and Maurizio Maugeri, J. E.: Warmer early instrumental measurements vs. colder recon-structed temperatures: shooting at a moving target, Quaternary Sci. Rev., 26, 3298–3310, 2007.
Frei, C. and Schär, C.: A precipitation climatology of the Alps from high-resolution rain-gauge observations, Int. J. Climatology, 18, 873–900, 1998.
Gao, C., Robock, A., and Ammann, C.: Volcanic forcing of cli-mate over the past 1500 years: an improved ice core-based index for climate models, J. Geophys. Res., 113, D23111, doi:10.1029/2008JD010239, 2008.
Glaciological Reports: The Swiss Glaciers, 1880–2006/07, Tech. Rep. 1–128, Yearbooks of the Cryospheric Commission of the Swiss Academy of Sciences (SCNAT), published since 1964 by Laboratory of Hydraulics, Hydrology and Glaciology (VAW) of ETH Zürich, available at: http://glaciology.ethz.ch/ swiss-glaciers/, 1881–2011.
Greuell, W.: Hintereisferner, Austria: mass-balance reconstruction and numerical modelling of the historical length variations, J. Glaciol., 38, 233–244, 1992.
Guiot, J., Corona, C., and ESCARSEL members: Grow-ing season temperatures in Europe and climate forc-ings over the past 1400 years, PLOS One, 5, e9972, doi:10.1371/journal.pone.0009972.g001, 2010.
Harrison, W. D., Raymond, C., Echelmeyer, K., and Krimmel, R.: A macroscopic approach to glacier dynamics, J. Glaciol., 49, 13– 21, 2003.
Secular glacier mass balances derived from cumulative glacier length changes, Global Planet. Change, 36, 295–306, doi:10.1016/S0921-8181(02)00223-0, 2003.
Holzhauser, H.: Zur Geschichte des Gornergletschers, Vol. G 84, Geographica Bernensia, 2011.
Holzhauser, H. and Zumbühl, H.: Nacheiszeitliche Gletscher-schwankungen, Tech. rep., Hydrologischer Atlas der Schweiz, Sonderdruck zum 54. Deutschen Geographentag, 2003. Holzhauser, H., Magny, M., and Zumbühl, H.: Glacier and
lake-level variations in west-central Europe over the last 3500 years, The Holocene, 15, 789–801, 2005.
Hormes, A., Müller, B. U., and Schlüchter, C.: The Alps with lit-tle ice: evidence for eight Holocene phases of reduced glacier extent in the Central Swiss Alps, The Holocene, 11, 255–265, doi:10.1191/095968301675275728, 2001.
Hormes, A., Beer, J., and Schlüchter, C.: A geochronological ap-proach to understanding the role of solar activity on Holocene glacier length variability in the Swiss Alps, Geogr. Ann., 88, 281–294, doi:10.1111/j.0435-3676.2006.00301.x, 2006. Huss, M., Bauder, A., Funk, M., and Hock, R.: Determination of
the seasonal mass balance of four Alpine glaciers since 1865, J. Geophys. Res., 113, F01015, doi:10.1029/2007JF000803, 2008. Huss, M., Funk, M., and Ohmura, A.: Strong Alpine glacier melt in the 1940s due to enhanced solar radiation, Geophys. Res. Lett., 36, L23501, doi:10.1029/2009GL040789, 2009.
Huss, M., Hock, R., Bauder, A., and Funk, M.: 100-year glacier mass changes in the Swiss Alps linked to the At-lantic Multidecadal Oscillation, Geophys. Res. Lett., 36, L10501, doi:10.1029/2010GL042616, 2010.
IPCC: Climate Change 2007, the Physical Scientific Basis, Con-tributions of Working Group I to the Fourth Assessment Report of the Intergovernmental Panel on Climate Change, Tech. rep., WMO/UNEP, Cambridge University Press, avail-able at: http://www.ipcc.ch/publications_and_data/ar4/wg1/en/ contents.html, 2007.
Joerin, U. E., Stocker, T. F., and Schlüchter, C.: Multicentury glacier fluctuations in the Swiss Alps during the Holocene, The Holocene, 16, 697–704, doi:10.1191/0959683606hl964rp, 2006. Johnson, S. G.: The NLopt nonlinear-optimization package,
avail-able at: http://ab-initio.mit.edu/nlopt, 2012.
Klok, E. and Oerlemans, J.: Deriving historical equilibrium-line al-titudes from a glacier length record by linear inverse modelling, The Holocene, 13, 343–351, 2003.
Leclercq, P. W. and Oerlemans, J.: Global and hemispheric temper-ature reconstruction from glacier length fluctuations, Clim. Dy-nam., 38, 1065–1079, doi:10.1007/s00382-011-1145-7, 2012. Leclercq, P. W., Oerlemans, J., and Cogley, J. G.: Estimating the
glacier contribution to sea-level rise for the period 1800–2005, Surv. Geophys., 32, 519–535, doi:10.1007/s10712-011-9121-7, 2011.
Leysinger-Vieli, G. J.-M. C. and Gudmundsson, G. H.: On estimating length fluctuations of glaciers caused by changes in climatic forcing, J. Geophys. Res., 109, f01007, doi:10.1029/2003JF000027, 2004.
Lüthi, M. P.: Transient response of idealized glaciers to climate vari-ations, J. Glaciol., 55, 918–930, 2009.
records with a macroscopic glacier model, Geogr. Helvetica, 65, 92–102, 2010.
Lüthi, M. P., Bauder, A., and Funk, M.: Glacier volume change reconstruction from length change data of the Swiss Alps, J. Geophys. Res.-Earth, 115, F04022, doi:10.1029/2010JF001695, 2010.
Mann, M. E., Zhang, Z., Rutherford, S., Bradley, R. S., Hughes, M. K., Shindell, D., Ammann, C., Faluvegi, G., and Ni, F.: Global signatures and dynamical origins of the Little Ice Age and Medieval Climate Anomaly, Science, 326, 1256–1260, doi:10.1126/science.1177303, 2009.
Mann, M. E., Fuentes, J. D., and Rutherford, S.: Underes-timation of volcanic cooling in tree-ring-based reconstruc-tions of hemispheric temperatures, Nat. Geosci., 5, 202–205, doi:10.1038/NGEO1394, 2012.
Messerli, B., Zumbühl, H. J., Amman, K., Kienholz, H., Oeschger, H., Pfister, C., and Zurbuchen, M.: Die Schwankun-gen des Unteren Grindelwaldgletschers seit dem Mittelalter, Zeitschrift für Gletscherkunde und Glazialgeologie, XI, 3–110, 1975.
Miller, G. H., Geirsdóttir, À., Zhong, Y., Larsen, D. J., Otto-Bliesner, B. L., Holland, M. M., Bailey, D. A., Refsnider, K. A., Lehman, S. J., Southon, J. R., Anderson, C., Björnsson, H., and Thordarson, T.: Abrupt onset of the Little Ice Age triggered by volcanism and sustained by sea-ice/ocean feedbacks, Geophys. Res. Lett., 39, L02708, doi:10.1029/2011GL050168, 2012. Nesje, A. and Dahl, S. O.: The “Little Ice Age” – only temperature?,
The Holocene, 13, 139–145, doi:10.1191/0959683603hl603fa, 2003.
Nussbaumer, S. U. and Zumbühl, H. J.: The Little Ice Age history of the Glacier des Bossons (Mont Blanc massif, France): a new high-resolution glacier length curve based on historical doc-uments, Climatic Change, 111, 301–334, doi:10.1007/s10584-011-0130-9, 2012.
Nussbaumer, S., Zumbühl, H., and Steiner, D.: The history of the Mer de Glace AD 1570–2003 according to pictorial and written documents, Zeitschrift für Gletscherkunde und Glazialgeologie, 40, 2005.
Nussbaumer, S. U., Steinhilber, F., Trachsel, M., Breitenmoser, P., Beer, J., Blass, A., Grosjean, M., Hafner, A., Holzhauser, H., Wanner, H., and Zumbühl, H. J.: Alpine climate during the Holocene: a comparison between records of glaciers, lake sed-iments and solar activity, J. Quaternary Sci., 26, 703–713, doi:10.1002/jqs.1495, 2011.
Nye, J. F.: On the theory of the advance and retreat of glaciers, Geo-phys. J. Roy. Astr. S., 7, 431–456, 1963.
Nye, J. F.: A numerical method of inferring the budget history of a glacier from its advance and retreat, J. Glaciol., 5, 589–607, 1965.
Oerlemans, J.: Extracting a climate signal from 169 glacier records, Science, 308, 270–277, doi:10.1126/science.1107046, 2005. Oerlemans, J.: Estimating response times of Vadret da
Morter-atsch, Vadret da Palü, Briksdalsbreen and Nigardsbreen from their length records, J. Glaciol., 53, 357–362, 2007.
Oerlemans, J.: Minimal Glacier Models, Igitur, Utrecht Publishing & Archiving Services, iSBN 978-90-6701-022-1, 2011. Ohmura, A., Kasser, P., and Funk, M.: Climate at the equilibrium
line of glaciers, J. Glaciol., 38, 397–411, 1992.
Ohmura, A., Bauder, A., Müller, H., and Kappenberger, G.: Long-term change of mass balance and the role of radiation, Ann. Glaciol., 46, 367–374, 2007.
Oppenheimer, C.: Ice core and palaeoclimatic evidence for the tim-ing and nature of the great mid-13th century volcanic eruption, Int. J. Climatol., 23, 417–426, doi:10.1002/joc.891, 2003. PAGES 2k consortium: Continental-scale temperature
variabil-ity during the past two millennia, Nat. Geosci., 6, 339–346, doi:10.1038/NGEO1797, 2013.
Painter, T. H., Flanner, M. G., Kaser, G., Marzeion, B., Van-Curen, R. A., and Abdalati, W.: End of the Little Ice Age in the Alps forced by industrial black carbon, P. Natl. Acad. Sci. USA, doi:10.1073/pnas.1302570110, 2013.
Pauling, A., Luterbacher, J., Casty, C., and Wanner, H.: Five hun-dred years of gridded high-resolution precipitation reconstruc-tions over Europe and the connection to large-scale circulation, Clim. Dynam., 26, 387–405, doi:10.1007/s00382-005-0090-8, 2006.
Pauling, A. and Paeth, H.: On the variability of return periods of Eu-ropean winter precipitation extremes over the last three centuries, Clim. Past, 3, 65–76, doi:10.5194/cp-3-65-2007, 2007.
Pfister, C.: Wetternachhersage: 500 Jahre Klimavariationen und Naturkatastrophen (1496–1995), Haupt, Bern, 1999.
Powell, M. J. D.: The BOBYQA algorithm for bound constrained optimization without derivatives, Tech. Rep. NA2009/06, De-partment of Applied Mathematics and Theoretical Physics, Cam-bridge, England, 2009.
Robock, A.: Volcanic eruptions and climate, Rev. Geophys., 38, 191–219, doi:10.1029/1998RG000054, 2000.
Roe, G. H. and O’Neal, M. A.: The response of glaciers to intrin-sic climate variability: observations and models of late-Holocene variations in the Pacific Northwest, J. Glaciol., 55, 839–854, 2009.
Schleussner, C. F. and Feulner, G.: A volcanically triggered regime shift in the subpolar North Atlantic Ocean as a possible origin of the Little Ice Age, Clim. Past, 9, 1321–1330, doi:10.5194/cp-9-1321-2013, 2013.
Schmeits, M. and Oerlemans, J.: Simulation of the historical vari-ations in length of the Unterer Grindelwaldgletscher, J. Glaciol., 43, 152–164, 1997.
Shapiro, A. I., Schmutz, W., Rozanov, E., Schoell, M., Haberre-iter, M., Shapiro, A. V., and Nyeki, S.: A new approach to the long-term reconstruction of the solar irradiance leads to large historical solar forcing, Astron. Astrophys., 529, A67, doi:10.1051/0004-6361/201016173, 2011.
Steiner, D., Walter, A., and Zumbühl, H.: The application of a non-linear back-propagation neural network to study the mass bal-ance of Grosse Aletschgletscher, Switzerland, J. Glaciol., 51, 313–323, 2005.
Steiner, D., Pauling, A., Nussbaumer, S. U., Nesje, A., Luter-bacher, J., Wanner, H., and Zumbühl, H. J.: Sensitivity of Eu-ropean glaciers to precipitation and temperature – two case stud-ies, Clim. Change, 90, 413–441, doi:10.1007/s10584-008-9393-1, 2008.
Steinhilber, F., Beer, J., and Fröhlich, C.: Total solar irradi-ance during the Holocene, Geophys. Res. Lett., 36, L19704, doi:10.1029/2009GL040142, 2009.
Thibert, E., Eckert, N., and Vincent, C.: Climatic drivers of seasonal glacier mass balances: an analysis of 6 decades at Glacier de Sarennes (French Alps), The Cryosphere, 7, 47–66, doi:10.5194/tc-7-47-2013, 2013.
Vincent, C.: Influence of climate change over the 20th Century on four French glacier mass balances, J. Geophys. Res., 107, 4375, doi:10.1029/2001GL014592, 2002.
Vincent, C., Kappenberger, G., Valla, F., Bauder, A., Funk, M., and Le Meur, E.: Ice ablation as evidence of climate change in the Alps over the 20th century, J. Geophys. Res., 109, D10104, doi:10.1029/2003JD003857, 2004.
Vincent, C., Le Meur, E., Six, D., and Funk, M.: Solving the para-dox of the end of the Little Ice Age in the Alps, Geophys. Res. Lett., 32, L09706, doi:10.1029/2005GL022552, 2005.
Weber, S. L.: A timescale analysis of the Northern Hemisphere tem-perature response to volcanic and solar forcing, Clim. Past, 1, 9–17, doi:10.5194/cp-1-9-2005, 2005.
Wegmann, M., Brönnimann, S., Bhend, J., Franke, J., Folini, D., and Luterbacher, M. W. J.: Volcanic influence on European summer precipitation through monsoons: Possible cause for “Years With-out a Summer”, J. Climate, doi:10.1175/JCLI-D-13-00524.1, 2014.
Zanchettin, D., Timmreck, C., Graf, H.-F., Rubino, A., Lorenz, S., Lohmann, K., Krüger, K., and Jungclaus, J. H.: Bi-decadal variability excited in the coupled ocean-atmosphere system by strong tropical volcanic eruptions, Clim. Dynam., 39, 419–444, doi:10.1007/s00382-011-1167-1, 2012
Zanchettin, D., Timmreck, C., Bothe, O., Lorenz, S. J., Hegerl, G., Graf, H., Luterbacher, J., and Jungclaus, J. H.: Delayed winter warming: A robust decadal response to strong trop-ical volcanic eruptions?, Geophys. Res. Lett., 40, 204–209. doi:10.1029/2012GL054403, 2013.
Zumbühl, H.: Die Schwankungen der Grindelwaldgletscher in den historischen Bild- und Schriftquellen des 12. bis 19. Jahrhun-derts, Denkschriften der Schweizerischen Naturforschenden Gesellschaft, 92, 279, 1980.