FUNDAÇÃO GETÚLIO VARGAS
ESCOLA DE ECONOMIA DE EMPRESAS DE SÃO PAULO
FREDERICO JOSE RODRIGUES DRENKER DOS REIS
DETECTING PATTERNS OF THE SPINOFF DECISION OF COMPANIES AND ACCESSING THE DETERMINATION OF THE ABNORMAL RETURNS
FUNDAÇÃO GETÚLIO VARGAS
ESCOLA DE ECONOMIA DE EMPRESAS DE SÃO PAULO
FREDERICO JOSE RODRIGUES DRENKER DOS REIS
DETECTING PATTERNS OF THE SPINOFF DECISION OF COMPANIES AND ACCESSING THE DETERMINATION OF THE ABNORMAL RETURNS
SÃO PAULO 2014
Dissertação apresentada à Escola de Economia de Empresas de São Paulo da Fundação Getúlio Vargas, como requisito para obtenção do título de Mestre Profissional em Economia.
Reis, Frederico Jose Rodrigues Drenker dos.
Detecting Patterns of the Spinoff Decision of Companies and Accessing the
Determination of the Abnormal Returns / Frederico Jose Rodrigues Drenker dos Reis. - 2014.
Number of Pages f. 39
Orientador: Daniel Monte
Dissertação (MPFE) - Escola de Economia de São Paulo.
1. Ações (Finanças). 2. Mercado de ações. 3. Investimentos. 4. Sociedades comerciais, Reorganização. I. Monte, Daniel. II. Dissertação (MPFE) - Escola de Economia de São Paulo. III. Título.
FREDERICO JOSE RODRIGUES DRENKER DOS REIS
DETECTING PATTERNS OF THE SPINOFF DECISION OF COMPANIES AND ACCESSING THE DETERMINATION OF THE ABNORMAL RETURNS
Dissertação apresentada à Escola de Economia de Empresas de São Paulo da Fundação Getúlio Vargas, como requisito para obtenção do título de Mestre Profissional em Economia.
Campo do Conhecimento: International Master in Finance
Data de Aprovação: ___/___/____.
Banca Examinadora:
_________________________________ Prof. Dr. Daniel Monte (ORIENTADOR)
_________________________________ Prof. Dr. Claudia Perdigão Dias Custódio
RESUMO
Esta tese examina o valor gerado através de processos de spin-off durante o período compreendido entre 2002 e 2010. Os rácios da Dívida Líquida/Preço Médio das Acções e da Dívida/Activo de uma empresa reflectem impactos estatísticos significativos na decisão deste tipo de processos de reestruturação. Assim sendo, o anúncio e decisão de se proceder a um spin-off contribui para que seja gerado um retorno anormal) (RA) para os accionistas da empresa-mãe. O tamanho relativo do spin-off e a respectiva alavancagem financeira correlacionam-se positivamente com os RA, enquanto, por outro lado, a dívida líquida por acção e a rendibilidade líquida dos activos correlacionam-se negativamente.
Deste modo, não é possível verificar uma transferência de riqueza dos detentores de títulos de dívida de uma empresa para os detentores de capital próprio.
ABSTRACT
This paper examines value created through spinoffs over a period from 2002-2010. The net debt to average share price ratio and the debt to asset ratio of a company impacts the decision for this restructuring process statistically significant. The announcement of a spinoff yields abnormal returns (AR) for the stockholders of the parent. The relative size of the spin and the financial leverage correlated with the AR positively, whereas the net debt per share and the return on asset negatively. Therefore, no direct wealth transfer from the debt holders of a company to the equity holders can be derived from these results.
I. List of Contents
1 Introduction ... 8
2 Literature Review ... 11
3 Determination of the Dataset ... 13
4 Comparison of Companies involved in a Spinoff Event against a Peer Group ... 15
4.1 Methodology ... 16
4.2 Empirical Findings ... 18
5 Determination and Findings on the Investigation of Cumulative Abnormal Returns ... 22
5.1 Methodology ... 23
5.2 Description of the Dataset ... 25
5.3 Empirical Findings ... 26
6 Empirical findings for the Determination of the abnormal Returns ... 30
6.1 Methodology ... 30
6.2 Empirical Findings ... 33
7 Summary and Conclusion ... 38
8 References ... 41
9 Appendix ... 44
II. List of Tables
Table 1: Spinoff Patterns according to financial ratios before the event ... 18Table 2: Spinoff Patterns according to financial ratios after the event ... 21
Table 3: Industrial Classification of the Parent Companies according to the BICS... 25
Table 4: Overview over the annual distribution of the spinoffs ... 25
Table 5: AR and CAR of the parent company due to the announcement ... 26
Table 6: CAR for the event window -5 until 8 days ... 31
Table 7: Correlation between the Return and different Predictors ... 33
Table 8: Future Industry of the Spinoff firms according to the BICS ... 36
Table 9: Result of the robustness regression ... 37
8
1
Introduction
The motivation of this paper arises from the conflict of interests observed between the
debt holders and the management of a corporation in the event of major restructuring
processes of a firm, like a spinoff. Thus, it investigates if the demerger decision of the
spinoff of a subsidiary by a parent is associated with a wealth transfer from the creditors
to the equity holders of a company.
The ultimate goal of the management of a company should be to maximize the wealth of
its owners and is often not in line with the interests of the creditors of a firm. This
phaenomena was described by Jensen and Meckling by the following statement: “[...] if
the owner has the opportunity to first issue debt, then to decide which of the investments
to take, and then to sell all or part of his remaining equity claim on the market, he will
not be indifferent between the two investments. The reason is that by promising to take
the low variance project, selling bonds and then taking the high variance project he can
transfer wealth from the (naive) bondholders to himself as equity holder” (Jensen, M. /
Meckling, W., 1976, P. 42).
From the statement above it can be derived, that bondholders are often negatively affected
by the decisions of a company to demerger parts of a company, as the whole company
can be seen as “the project”. Thus, corporate restructuring impacts the bondholders of a
company by two issues. First of all, bondholders prefer diversified firms, as they cash
flows tend to be more stable compared to undiversified corporations, so the “low variance
project”. Besides this, also the amount of collaterals for the securitization of their claims
9
the parent. Thus, the risk of a company after a demerger differs from the risk before the
event.
The reasons for a demerger decision of a company represents a widely discussed topic in
the common literature. Due to this corporate action companies often decrease or even
eliminate the negative synergies in the company. In line with this argument also a
reduction of the information asymmetry in the firm can be observed (See Burch, T./
Nanda, V., 2003). Moreover, also the momentum effect can increase shareholder wealth
significantly. Demerging a subsidiary in an industry with high valuation increases the
equity value (See Chavez et al., 2000). In line with this argument, also the clientele effect
has to be mentioned. The separation of the parent into two separate listed entities allows
to target different preferences of investors. For example the parent could be characterized
as a high dividend yield company, whereas the spinoff company targets investors
preferring capital gains (See Lizenberger, R./ Sosin, H., (1977). Furthermore, also the
management increases its focuses on the core business of the firm by demerging a not
substantial subsidiary of the corporation and involving in pure plays (See Comment, R./
Jarell, G. 1995). Last but not least, improving tax efficiency and less regulatory
constraints are also seen as an incentive for this corporate action (See Schipper, K./ Smith,
A., 1983). Thus, this action often improves the financial results of the company and its
announcement leads most of the time to abnormal returns (AR) for the shareholder.
The corporate restructuring ownership relationship actions can be divided into three broad
categories, the equity carve out, the spinoff and the split-up. Whereas, the first one
represents an own category, the last one is often only a special form of a spinoff. An
equity carve out is defined as the initial public offering of a minority interest of a
10
action. In contrast to this, the spinoff of a company is characterized by a special stock
dividend on a pro rata basis for the shareholders of the parent company. This stock
dividend consists of shares of the subsidiary. The main advantage of a spinoff compared
to the equity carve out is, that the capital gains from this event occur on a tax-free basis.
Thus, these gains become only taxable for the shareholders at the day of the sale of the
shares. Moreover, these two forms differ also in one very important fact. As the shares of
a spinoff are distributed among the “old owners” of a company no change of control
occurs, whereas in the case of an equity carve out the new shares are offered to the public
(See Weston, F., 1997). Therefore, the concentration on the restructuring in form of a
spinoff is chosen, as it is not associated with effects linked to a change of control on the
ownership side. Moreover, the regional concentration of this study is located in the United
States of America and period investigated ranges from 01.01.2002 until 31.12.2010.
This study examines the patterns of a spinoff decision by a company and also accesses
determinants of the AR around the announcement date of the event by investigating
different financial ratios. Moreover, it investigates if a wealth transfer from the debt
holders of a company can be associated with the event of spinoff. Thus, it closes a gap
between the relationship of the AR around the events and some financial ratios. The rest
of this paper is organized in six parts. The next part gives a brief overview over the
literature. In section three the datasets of this study were determined, in part four patterns
for the decision are represented, whereas in part five the abnormal returns are described.
Part six compares these AR with these ratios and investigates the source of them and the
11
2
Literature Review
The phaenomena of the abnormal returns of the parent company due to a spinoff
announcement represents a widely discussed topic in the common literature. Schipper and
Smith (1983) documented the positive reaction of the share price around the
announcement by the study of 93 voluntary spinoff announcement. In their research they
detected relaxed tax or regulatory constraints as one source of the AR. In the same year
Hite and Owers (1983) published a study about the statistically significant positive
relation between the relative size of the spunoff subsidiary and the parent company and
the AR. Besides this results, both of the researches failed to proof a wealth transfer
between the bondholders and the equity holders of a company.
Cusatis et al. (1993) investigated the long-term performance stock market of the parent
company and the spinoff by creating a market-weighted portfolio of these up to three
years after the completion. Their findings suggest that the abnormal returns of these
stocks over the observation window are limited to corporations involved in a takeover
activity. Thus, they conclude spinning out a company is an alternative method to “transfer
control of corporate assets to bidders who will generate value” (See Cusatis et al., 1993,
Page 1). This findings about the excess return of the portfolio were later criticized by Mc
Connell et al. (2001) for the selection of the holding period of Cusatis et al. and showed
evidence that the study was biased.1
Focusing on the costs of information asymmetry perceived by investors about the
profitability and operating efficiency of a company Krishnawasmi, S./ Subrumamiam, V.
12
(1999) proofed that enhancing the pure plays of a company by spinning of a company
reduces or even removes this asymmetry. Moreover, companies associated with high
information asymmetry costs are more likely to be involved in this corporate restructuring
action.
In contrast to this study, Burch, T./ Nanda, V. (2003) access the cost of information
asymmetry on the decision level of a firm. According to their findings, the lower valuation
of the combined firm can be explained by the diversified characteristic of the company
before the event. Reducing or even eliminating these negative synergies, increases the
value of the virtually combined firm after the event. In line with this argument – that the
two separate firms are more valuable – John, T. (1993) focussed on the debt side of the
capital structure. She recommends in her theoretical paper about the optimal allocation of
debt between the parent and the spinoff company, that the more profitable company
should take the larger portion of debt. This increases the tax shield, decreases the costs of
debt and the agency costs of underinvestment for the joint firm and thus improves the
value of the joint firm.
The capital structure of the spinoff and the parent company after the event was also
investigated by Mehrotra, V. et al. (2003) on a study of 98 voluntary spinoffs. Their
empirical results confirm the theoretical model of John, T. (1993). The leverage between
the parent and the spinoff depends positively on their profitability, the fixed asset ratio
and negatively on the variance of the returns of their industries.
In addition to this literature also many empirical studies about the conflict of interest
between the bondholder and equity regarding the event of the organizational restructuring
13
(1997) proofed a wealth transfer from bondholders to the shareholders of a company in
the case of the spinoff of the Marriott Corporation into Marriott International and Marriott
Host. Around the announcement window bondholders of the firm suffered losses of over
US-$ 190 Million, whereas the stockholders gained US-$ 80.6 Million.2 The first study confirming this often discussed issue in general is the paper written by Maxwell, W./ Rao,
R. (2003). In their analysis of 80 spinoff events they found statistically significance
evidence of the negative correlation of the negative AR of bondholders and the positive
AR of the shareholders. Thus, the former group on investors is affected by losses of 88
basis points, whereas the latter one benefits from AR of 3.6% around the announcement
day. In contrast to these results a latter study of the correlation of the AR of the holders
of straight bonds and the shareholders around the event window detected positive AR for
both groups of investors (See Veld, C./ Veld-Merkoulova, Y., 2008).
3
Determination of the Dataset
The Dataset was obtained via Bloomberg’s Mergers and Acquisition search for Spinoffs.
Bloomberg defines Spinoffs as “The creation of an independent company through the
sale or distribution of new shares of an existing business/division of a parent
company.”3(Bloomberg L.P. 2014) The period investigated ranges from the 01.01.2002
until the 31.12.2010 either for the completion date (Dataset A) or for the announcement
2 The differences between these two values was caused due to the transaction costs and inefficiencies linked to this event.
14
date (Dataset B). Both datasets are further geographically restricted to Spinoffs in the
United States of America and only completed spinoffs were considered.
For Dataset A the following restrictions were set:
a) Availability of financial data of the parent up to three years before the spinoff
completion and two years after the spinoff for the parent and the spunoff
company.4
b) Parent companies belonging to the financial sector by the Bloomberg Industry
Classification System Standards (BICS) were eliminated, because of the
coinciding event of the financial crisis during the observation period, new
statutory regulations and their differences from other sectors in the capital
structure and ratio analysis.5
c) Parent companies involved in bankruptcy within 12 months before or after the
spinoff were eliminated, as they were not seen as voluntary spinoffs.
This reduced the initial sample of 520 completed spinoffs in the period of investigation
to 35 spinoff events of 32 parent companies.
The initial number of firms of Dataset B consisted of 561 spinoffs. The following
restriction were set by the author:
a) Spinoffs with no availability of financial data for the financial year before the
event or no Ticker for the spinoff company were eliminated.
4 The availability of Data is restricted to the financial ratios defined in the Apendix
15
b) Parent companies with less than US-$ 100 Mio. total balance sheet assets were
eliminated, to ensure the liquidity of the stock.
c) Parent companies with no trading data for up to three days 400 days before and
30 days after the event were eliminated
d) Parent companies involved in other Merger and Acquisition deals between the
announcement and the completion of the spinoff were eliminated, because of the
influence of these events on the stock price.
e) Spinoff companies that were listed before the announcement were eliminated, as
only first time trading spinoff companies were respected in this study.
Moreover, also the above described filters b and c of Dataset A were applied. These
filters reduced the initial sample of 561 spinoffs to 63 events that were further
analysed in chapter 6.
4
Comparison of Companies involved in a Spinoff Event against
a Peer Group
To argue in favour of a wealth transfer from the debt holders to the equity holders of a
company the influence of different continuous predictor variables on the outcome of
doing a spinoff or not were tested. As the event of a spinoff often leads to a reallocation
of assets and cash flows (See John, T. 1993) and these are main contributors to the value
16
4.1 Methodology
For the comparison of the behaviour of companies involved in a spinoff or not for each
firm of Dataset A a peer was determined. The group of peers was built on numerous
relationships such as analyst coverage, correlated news stories and industrial
classification in accordance with the definition of peer groups by Bloomberg (See
Bloomberg L. P. 2014). Furthermore, to improve the comparability of the firm and its
peers, each of them consisted out of a group up to five companies. The financial ratios
for each of them were weighted by the total historical market cap of each peer group.
Moreover, as this part of the paper investigates the determination process for a company
in its decision of spinning out a subsidiary or not on the basis of financial ratios the
logistical model is used. This model is chosen by following arguments: Firstly, the
logistical model allows to set up a model for the binary qualitative variable “spinning
company or “not-spinning company” by quantifying them as 1 for the former and as 0 for
the latter. Moreover, the density function of the logistic model controls better than the
alternative Probit Model for the marginal effects around the mean and the tails of the
distribution, which is desirable because of the comparison of companies of different
industries and sectors in this section (See Heij, C. 2004).
The logistic regression model can be explained by the following equation (1)
𝑖 = + 𝑒 [− + 𝑋
𝑖+ 𝜀𝑖]
(1)
for every i this function is bounded by Pi to be located between 0 and 1, as > 0 and
17
influence of various variables on the behaviour of a spinning company in equation (1)
more variables will be included (i.e. 𝑋 𝑖+ 𝑋 𝑖 +∙∙∙ + 𝑘𝑋𝑘𝑖). Therefore the formula
used to explain the differences in spinning off and not-spinning off companies can be
explained by equation (2).
ln −𝑖
𝑖 = + 𝑋 𝑖+ 𝑋 𝑖 +∙∙∙ + 𝑘𝑋𝑘𝑖 + 𝜀𝑖
(1)
The term in the brackets delivers the odds ratio and determines the probability of outcome
based on the predictors (See Thomas, R. 1997). In this specific case being involved in a
spinoff or not, coded as 1 or 0.
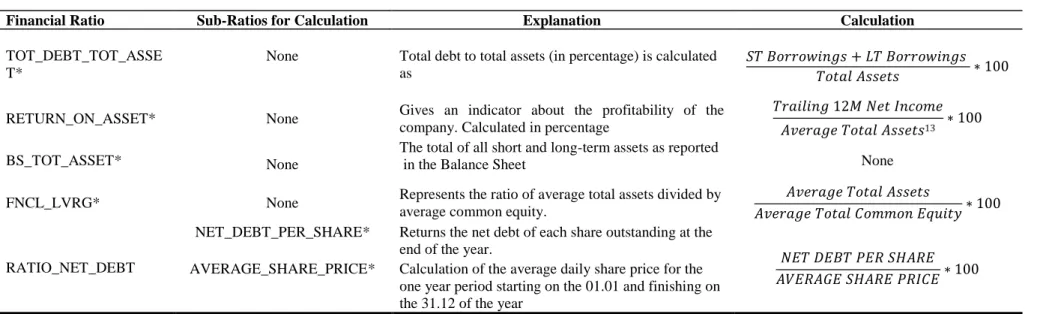
The following four ratios were tested: TOT_DEBT_TO_TOT_ASSET”,
“BS_TOT_ASSET” and “RATIO NET DEBT” and “RETURN_ON_ASSET”. These
indicators were chosen for the following reason: Firstly the total debt to total asset ratio
of a delivers the leverage factor of the balance sheet of a company. As assets were seen
as collaterals for debt holders, they impact the value of the debt of a company (See John,
T., 1993). Moreover, the second ratio gives a strong indicator about the relative size of
the company and controls for the size effect investigated by Hite and Owers (1983).
Because there is a strong heterogeneity of the firm size observable, due to different
industries and other factors this ratio was calculated on a logarithm basis and is
represented by the variable “Log_asset”. The ratio “Ratio Net Debt” represents a
symbiosis of a balance sheet number (the net debt) against a market ratio (average share
price). The idea for the inclusion of this ratio comes from the paper developed by Robert
Merton on the pricing of corporate debt. In this paper he emphasizes that the pricing of
18
probability of default of a company (See Merton, R. 1974). As debt holders are ranked
before equity holders in the case of a corporate default, a high “Ratio Net Debt” increases
their risk of not full repayment on their claims in case of bankruptcy of a company.6
Finally, the last ratio gives a good indicator about the performance of the company. Thus,
this ratio indicates the impact of the profitability of a company on the spinoff decision.
4.2 Empirical Findings
In the following table (1) an overview over the results of the logistic regression for the
binary outcome variable “dummyspin” against the continuous predictor variables
“TOT_DEBT_TO_TOT_ASSET”, “BS_TOT_ASSET” and “RATIO NET DEBT” and
“RETURN_ON_ASSET” is given:7
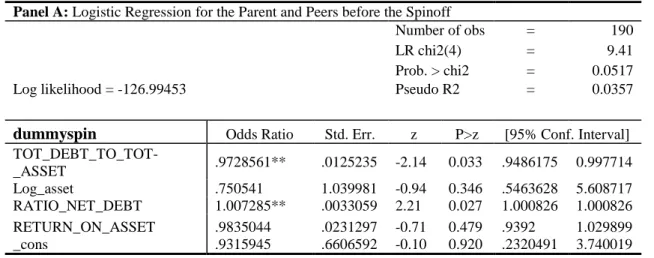
Table 1: Spinoff Patterns according to financial ratios before the event
Panel A: Logistic Regression for the Parent and Peers before the Spinoff
Number of obs = 190 LR chi2(4) = 9.41 Prob. > chi2 = 0.0517 Log likelihood = -126.99453 Pseudo R2 = 0.0357
dummyspin Odds Ratio Std. Err. z P>z [95% Conf. Interval]
TOT_DEBT_TO_TOT-_ASSET .9728561** .0125235 -2.14 0.033 .9486175 0.997714 Log_asset .750541 1.039981 -0.94 0.346 .5463628 5.608717 RATIO_NET_DEBT 1.007285** .0033059 2.21 0.027 1.000826 1.000826 RETURN_ON_ASSET .9835044 .0231297 -0.71 0.479 .9392 1.029899 _cons .9315945 .6606592 -0.10 0.920 .2320491 3.740019
Panel B: Overview over the distribution of the ratios before the Spinoff
Parent Peer
MEAN STD MEAN STD
TOT_DEBT_TO_TOT-_ASSET 25,655 17,47165 27,05402 14,44739
BS_TOT_ASSET 25605 45748 34580 45824
RATIO_NET_DEBT 79,85563 355,4414 32,83353 38,36121 RETURN_ON_ASSET 4,151114 8,17722 5,040145 4,758238
19 Panel A of Table 1 represents the results of the logistic regression of the ratio variables
“TOT_DEBT_TO_TOT_ASSET”,“BS_TOT_ASSET”,“RATIO NET DEBT” and “RETURN_ON_ASSET”
against the binary outcome variable “dummyspin”. The low Pseudo R2 was accepted because of the small
sample size. Therefore, to assure the explanatory power of the model a linktest can be found in the Appendix under section WY. Asterisks show significance at a value of 1% (***), 5%(**), 10%(*). Panel B represents the mean and standard deviation (STD) of the spinning company (“Parent”) and its Peer companies for the period three financial years before the spinoff event. All variables except BS_TOT_ASSET, which is in Million US-$ denoted, are in percentage.
Table 2 indicates at a 5% significance level that the event of a spinoff is negatively
correlated to its debt to asset ratio of the balance sheet. Therefore, the odds of doing a
spinoff decreases by almost 3% for each unit of increase of the percentage in leverage.
This fact is also confirmed by the higher mean of the leverage of the peer companies
compared to the companies involved in a spinoff. These results can be explained by
covenants by the creditors to protect against unforeseeable trigger events like spinoffs
(See Crabbe, L. 1991). So it cannot be concluded from this balance sheet ratio that
companies with a high leverage factor are more probably involved in a demerger decision
like a spinoff. Thus, this ratio does not indicate any wealth transfer from the “naive” debt
holders to equity holders of a company.
Although, the results of panel A indicate, that firms with a larger balance sheet sum are
less likely to be involved in a spinoff, this ratio fails to show significance. This result can
be explained by the determination of the peers. As one of the conditions of them is to
deliver financial data for an uninterrupted period of five years, the peer companies mainly
consisted of very large companies. The same is true for the test of the “RETURN
_ON_ASSET” ratio in the regression of Panel A. The odds ratio of less than 1 gives not
more than a signal for the negative correlation between a spinoff decision and this
profitability ratio. Thus, this result would be in line with various earlier researches about
20
but as it fails to show significance this cannot be conclude at a statistically significant
level.
On the other side the net debt to average share price ratio is significant at a 5 per cent
level. This outcome lead conclude that companies with a higher proportion of net debt on
its market capitalization are more in favour of doing a spinoff. For each increase of 10
units in this ratio the odds of being involved in a spinoff event increase by around 1.07.8
Putting this result in connection to the previous described pricing model of Robert Merton
this clearly indicates that companies faced with higher costs for the issue of new debt are
more likely to be involved in a spinoff event. Moreover, this result can be seen as a clear
indicator for raising agency costs of the company, as a company with high debt costs
faces the problem of underinvestment (See John, T., 1993). In addition this result is in
line with the pecking order theorem developed by Myers. Moreover, developing this idea
further, this result confirms also the pecking order theorem. Spinning out a subsidiary
allows a company besides other factors to reengineer its capital structure and to increase
cash flows due to efficiency gains. Thus, as a company prefer internal rather than external
financing the spinoff decision can be seen as a source for the former one. (See Myers, S.
1983).
To sum up, although some ratios failed to show significance a first picture from the
logistic regression of panel A about the differences in the behaviour of spinning and not
spinning firms can be drawn. First of all, firms with a higher debt to asset ratio are less
likely to be involved in a spinoff event. In contrast to this finding, the odds for companies
with a higher net debt to average share price ratio are positively correlated.
21
Although, the logistical analysis of the parent, the spinoff and its peer companies show
significance results, these are not further discussed in this section, as the explanatory
power of the model indicates misspecifications of the model based only on the four
variables of panel A. Thus, no conclusions about the behaviour of the companies after the
spinoff and its Peer group can be derived on this ratios.9 Therefore, an overview over the
financial ratios of the mean and the standard deviation for the Parent, the Spinoff and their
Peers is summarized in panel A and B of table 2.
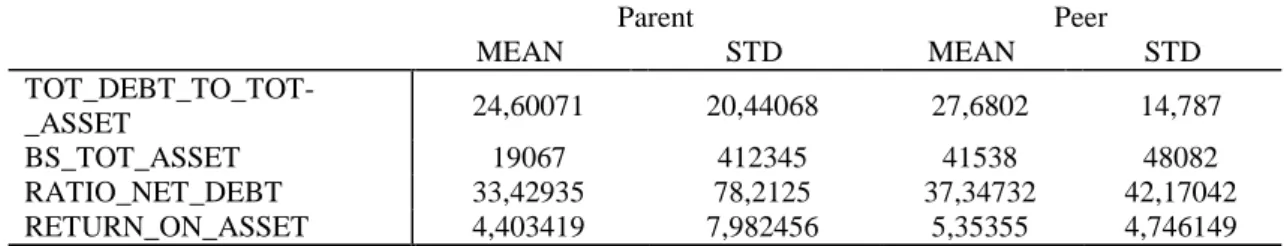
Table 2: Spinoff Patterns according to financial ratios after the event
Panel A: Overview over the distribution of the ratios after the event for the parent and its peers
Parent Peer
MEAN STD MEAN STD
TOT_DEBT_TO_TOT-_ASSET 24,60071 20,44068 27,6802 14,787
BS_TOT_ASSET 19067 412345 41538 48082
RATIO_NET_DEBT 33,42935 78,2125 37,34732 42,17042 RETURN_ON_ASSET 4,403419 7,982456 5,35355 4,746149
Panel B: Overview over the distribution of the ratios after the Spinoff for the spinoff and its peers
Spinoff PEER
MEAN STD MEAN STD
TOT_DEBT_TO_TOT_AS
SET 22,09874 78,33574 24,17092 12,9974
BS_TOT_ASSET 11956 34516 153391 652389
RATIO_NET_DEBT 19,61004 78,33574 20,4006 35,55785 RETURN_ON_ASSET 2,526557 16,70304 5,347497 5,708019 Panel B represents the mean and standard deviation (STD) of the spinning company (“Parent”) and its Peer companies for the period three financial years after the spinoff event. All variables except BS_TOT_ASSET, which is in Million US-$ denoted, are in percentage.
From table 2 we can conclude, that the financial ratios of the peer groups, the parent and
the spinoff are approximating. Especially, for the net debt to asset ratio this results stands
in clear contrast to the results of table 1. Although, the average return on asset improved
it is still lower than the one from the peer group. This can be explained by the following
22
argument. The improvements of a spinoff significantly depend on the diversity of the
company after it and the industries (See Burch, T./ Nanda, V. 2003). An indicator for this
phaenomena is the higher standard deviation of this ratio for the parent and the spinoff
company compared to their peer groups.
This leads us to conclude the following. The pattern for a spinoff in respect to its financial
ratios concerning the debt side of a company is positively determined by its net debt to
average share price and negatively to its debt to asset ratio. Thus, companies facing higher
costs of debts due to its higher portion of debt of its market capitalization are more likely
to be involved in a spinoff. This observation disappears over the next two year period of
a company after the event. Therefore, no direct wealth transfer between the debt holders
and equity holders can be observed, but the significance of the net debt to average share
price ratio in favour of the spinoff decision of a company can be seen as a signal in this
direction. To investigate this issuer more precisely the following parts of the paper
examines the observation of abnormal returns of the parent company around the
announcement date of the spinoff decision and links them directly to financial ratios.
5
Determination and Findings on the Investigation of Cumulative
Abnormal Returns
This part of the thesis examines the effects of the spinoff announcement on the parent’s
stock price for an event window of 61 days, starting 30 days before the event and finishing
30 days after it. Compared to other studies on the effects of spinoffs on the share price
(See Miles, J./ Rosenfeld, J. 1983) of the parent company around the event date a much
shorter window was chosen, because of the following reason. In Part six of this paper
23
caused by the spinoff announcement were tested. As these were seen as static variables
the short event window will reduce the effect of the financial reengineering and other
changes in the corporate structure of the company caused after the event. Therefore, the
idea of the efficient market hypothesis that prices react to news builds the basis of this
event study (See Fama, E., 1970).
5.1 Methodology
To estimate the abnormal returns of the parent company an estimation window of 400
days until 31 days before the announcement was chosen. Abnormal returns were defined
by the following equation (2):
= ∑ 𝑖 − ̂
𝑁
−
− ̂ (2)
The term represents the abnormal return at the event window t, N the number of
stocks, 𝑖 the return of the stock for a certain period at time t, ̂𝑖 the intercept of the
stock, ̂𝑖 the systematic risk of the stock.
The return of the market model is calculated from the S & P over the investigation period
by the ordinary least squared method. The selection of this index can be argued by the
following. As this sample only consist of spinoffs in the U.S. it represents a good
geographical fit. Moreover, the liquidity of the stocks of the sample should be comparable
with the stocks of the S &P 500, as only companies with more than 100 Million US-$
total assets were included in the sample. As well as the daily returns of the parent as the
24
Last but not least the cumulative abnormal returns (CAR) for different time periods t in
the event window were determined by the following equation (3):
𝑖 , = ∑ 𝑖
=
=
(3)
is defined as in equation (1), which begins at t = and ends at t= for a stock i. The
individual 𝑖 represents the sum of 𝑖 over this period.
The underlying sample for the investigation of the abnormal returns of the parent
companies around the announcement date of the spinoff is represented by the earlier
described dataset B. To determine the exact date of the announcement of the spinoff by
the parent company the Bloomberg data search for spinoffs was used. Moreover, to
eliminate the effect of other news, which could have influenced the stock price of the
parent company around the event date, a search for earning warnings and/or extraordinary
cash dividends was done with the result of no coinciding events for the 63 parent
companies in the event window. Furthermore, this paper assumes that there were no
further company events impacting the price of the stock around the announcement date
unless earning warnings and the in chapter three defined merger and acquisition news of
the 63 companies. The alternative hypothesis tested in this chapter of the paper is the
following:
“The stocks of the parent companies will yield abnormal returns caused by the spinoff
25
5.2 Description of the Dataset
According to the BICS standards 59 of the 63 parent spinoff companies could be
classified into seven different industries before the event and only for four of them no
classification was available. An overview over the sample and its BICS are given in the
following table 3.
Table 3: Industrial Classification of the Parent Companies according to the BICS
Sector BICS Number of Companies
Communications 10003 12
Consumer, Cyclical 10004 1
Consumer, Non-Cyclical 10005 20
Energy 10007 7
Industrial 10011 8
Technology 10013 8
Utilities 10014 3
N.A. -/- 4
Total 63
From table 3 we can clearly derive that the Non-Cyclical Consumer Sector was the
dominating factor regarding the number of Spinoffs over the observation period and is an
indicator for a consolidation of this sector during the observation period (See Mulherin,
H. /Boone, A. 2000). In contrast to the sector specific distribution of the spinoffs as
depicted in Table 3 there could be no concentration in certain years been observed.
Table 4: Overview over the annual distribution of the spinoffs
Year 2002 2003 2004 2005 2006 2007 2008 2009 2010 Total
Number of
Spinoffs 7 10 8 11 3 12 3 5 4 63
The size of the balance sheet sum of the spinning of company of the year before the event
26
15 Billion. The value of the spinoff company ranged between US-$ 12.584 Million up to
US-$ 10.67 Billion.10
Furthermore, as spinoffs are often associated with complicated legal processes the time
between the announcement and the completion of the spinoff company differed between
9 and 581 days with an average of 156 days for the sample. To reduce the effect of these
large fluctuations and other side effects in this period (i. e. other ad-hoc news influencing
the price) the short event window only around the announcement day was selected, as
explained earlier.
5.3 Empirical Findings
Panel A of Table 5 shows the daily abnormal returns of the parent company of Dataset B
around the announcement date for a period of 61 days starting 30 days before and
finishing 30 days after the event, whereas Panel B indicates the cumulative abnormal
returns for selected 30 days and 5 days window in the event window. Moreover, for the
visualization of the cumulative abnormal returns figure 1 is included.
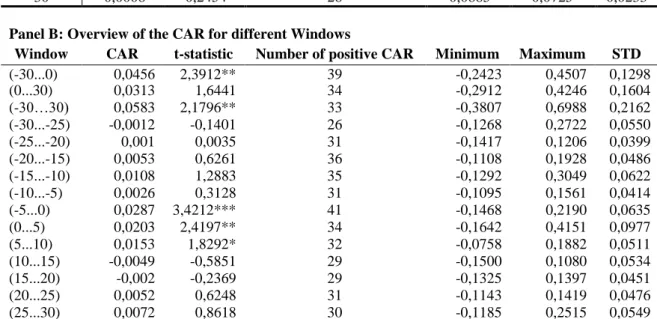
Table 5: AR and CAR of the parent company due to the announcement
Panel A:
Event
Day AR t-statistic Number of positive AR Minimum Maximum STD
-30 -0,002 -0,5791 28 -0,0492 0,0624 0,0198 -29 -0,0012 -0,3452 27 -0,0643 0,0537 0,0225 -28 0,0036 1,0434 36 -0,0316 0,0583 0,0196 -27 -0,0008 -0,2404 26 -0,0351 0,0796 0,0233 -26 -0,0001 -0,0257 31 -0,0377 0,0562 0,0200 -25 -0,0007 -0,1961 29 -0,0436 0,0811 0,0224 -24 -0,0013 -0,384 30 -0,0508 0,0285 0,0172 -23 0,0009 0,2684 33 -0,0342 0,0441 0,0198 -22 0,0047 1,3829 40 -0,0861 0,0511 0,0243
27 -21 -0,0007 -0,2189 38 -0,1851 0,0521 0,0422 -20 -0,0029 -0,8436 25 -0,0365 0,0469 0,0174 -19 0,0026 0,7493 27 -0,0726 0,1662 0,0372 -18 -0,0055 -1,6027 20 -0,1410 0,0793 0,0366 -17 0,0036 1,0579 37 -0,0564 0,0901 0,0243 -16 0,0032 0,9228 34 -0,1437 0,1903 0,0450 -15 0,0043 1,2499 38 -0,0984 0,0750 0,0284 -14 -0,0009 -0,2573 24 -0,0467 0,0799 0,0223 -13 0,0015 0,4443 34 -0,0392 0,0625 0,0213 -12 0,0082 2,3838** 38 -0,0388 0,3171 0,0573 -11 -0,0015 -0,4328 30 -0,0553 0,0428 0,0207 -10 -0,0008 -0,2322 24 -0,0971 0,0631 0,0254 -9 -0,0026 -0,7651 25 -0,0464 0,0434 0,0178
-8 0,0036 1,0402 35 -0,0431 0,0835 0,0217
-7 0,0011 0,3095 27 -0,0244 0,0518 0,0158
-6 0,0007 0,2045 28 -0,0448 0,0743 0,0219
-5 0,0007 0,2092 25 -0,0218 0,0568 0,0165
-4 0,0035 1,0086 34 -0,0310 0,0507 0,0178
-3 0,0001 0,0401 31 -0,1337 0,0466 0,0281
-2 0,0056 1,6424 31 -0,0241 0,1214 0,0274
-1 0,0001 0,0358 31 -0,0798 0,0682 0,0257
0 0,0186 5,444*** 42 -0,0854 0,2196 0,0538
1 0,0021 0,6177 24 -0,0990 0,4535 0,0860
2 -0,0048 -1,4084 22 -0,1179 0,0575 0,0264
3 0,0018 0,5369 26 -0,0485 0,1851 0,0393
4 -0,0039 -1,1367 26 -0,0947 0,0428 0,0269 5 0,0064 1,8737** 33 -0,0302 0,0800 0,0243 6 0,0091 2,6636*** 41 -0,0272 0,1568 0,0321
7 0,0028 0,8105 33 -0,0724 0,0593 0,0250
8 0,001 0,2789 31 -0,0513 0,0404 0,0190
9 -0,0013 -0,3712 25 -0,0730 0,0891 0,0240 10 -0,0027 -0,7748 26 -0,0947 0,0521 0,0251 11 -0,0041 -1,1948 26 -0,1293 0,0507 0,0301
12 0,0027 0,8009 40 -0,1615 0,0567 0,0325
13 -0,0024 -0,7054 29 -0,1052 0,0503 0,0252 14 -0,0001 -0,0272 29 -0,1006 0,0474 0,0230
15 0,0016 0,4681 32 -0,0618 0,0848 0,0254
16 -0,0011 -0,3144 28 -0,0731 0,0392 0,0231
17 0,0002 0,063 29 -0,0265 0,0889 0,0218
18 -0,0035 -1,0344 27 -0,1427 0,0256 0,0294 19 -0,0013 -0,3749 31 -0,0451 0,0938 0,0251
20 0,0021 0,6122 37 -0,0815 0,0885 0,0281
21 0,001 0,287 29 -0,0596 0,1121 0,0318
22 0,0001 0,0392 30 -0,0740 0,0788 0,0254
23 -0,0024 -0,714 29 -0,0815 0,0398 0,0198
24 0,0021 0,6034 37 -0,0989 0,0516 0,0261
28 26 -0,0031 -0,9195 24 -0,0902 0,0730 0,0257
27 0,0047 1,3867 33 -0,0655 0,0808 0,0251
28 0,0009 0,2576 29 -0,0963 0,0672 0,0284
29 0,0032 0,9287 34 -0,1216 0,1581 0,0377
30 -0,0008 -0,2454 28 -0,0885 0,0725 0,0233
Panel B: Overview of the CAR for different Windows
Window CAR t-statistic Number of positive CAR Minimum Maximum STD
(-30...0) 0,0456 2,3912** 39 -0,2423 0,4507 0,1298 (0...30) 0,0313 1,6441 34 -0,2912 0,4246 0,1604
(-30…30) 0,0583 2,1796** 33 -0,3807 0,6988 0,2162
(-30...-25) -0,0012 -0,1401 26 -0,1268 0,2722 0,0550 (-25...-20) 0,001 0,0035 31 -0,1417 0,1206 0,0399 (-20...-15) 0,0053 0,6261 36 -0,1108 0,1928 0,0486 (-15...-10) 0,0108 1,2883 35 -0,1292 0,3049 0,0622 (-10...-5) 0,0026 0,3128 31 -0,1095 0,1561 0,0414 (-5...0) 0,0287 3,4212*** 41 -0,1468 0,2190 0,0635 (0...5) 0,0203 2,4197** 34 -0,1642 0,4151 0,0977 (5...10) 0,0153 1,8292* 32 -0,0758 0,1882 0,0511 (10...15) -0,0049 -0,5851 29 -0,1500 0,1080 0,0534 (15...20) -0,002 -0,2369 29 -0,1325 0,1397 0,0451 (20...25) 0,0052 0,6248 31 -0,1143 0,1419 0,0476 (25...30) 0,0072 0,8618 30 -0,1185 0,2515 0,0549
Panel A and B represent the abnormal returns ranging from daily Panel (A) up to 30 days (Panel B) of the 63 parent companies of Dataset B over the estimation period of -30 days until +30 days of the announcement of the spinoff by the parent.. Moreover also the significance is indicated by the parametic t-statistic. The significance level is indicated by Asterisks, * indicates significance at a 10% level, ** at a 5% level and *** at a 1 per cent level
Figure 1: Cumulative abnormal returns of the event window -30 until 30 days
Figure 1 represents the cumulative abnormal returns for the event window. For a better visibility the window
– 5 days until 10 days after the event are marked in orange.
The analysis of the abnormal returns shows an overall positive trend of the abnormal
returns over the whole observation period. The CAR over the whole investigation period
29
especially enhanced from 5 days prior of the announcement until 8 days after it.
Moreover, in the 17 days window ranging from day -8 until 8 only on two days, namely
day two and four, negative abnormal returns could be observed. But these with no
statistical significance. Besides this fact also three of the four statistically significant daily
returns occurred during this period. As we can see in Panel A and figure 1 the abnormal
returns peaked on the day of the announcement at 1.86% at a significance level of 1%,
resulting in positive abnormal returns for 42 of the 63 companies of the investigated
sample. Moreover, also the standard deviation of the abnormal returns reached its two
maxima on this day and the following day, implicating that there was no homogenous
reaction on the stock price for all companies on this event. Furthermore, also on day 5
after the event statistically significant abnormal returns at a 5 per cent level of 0.64% can
be observed, whereas on day 6 after it abnormal returns at a 0.61% at a 1 per cent
significance level. Last but not least, also on day 12 before the event shows statistically
significant AR of 0.82% at 1 per cent level occurred.
In Panel B the daily abnormal returns were converted into CAR to investigate the AR
over different time periods in the event window. The window starting 30 days before and
ending at the day of the announcement results in CAR of 4.56% at a significance level of
5%, whereas the window from day 0 until day 30 results in CAR 3.13%, but failing to
show significance. In addition the splitting up of the event window in 12 five day
windows tell us a similar story as the investigation of Panel A. The standard deviation of
the abnormal returns increases around the event date and the significant CAR also are
occurring around this day. Therefore, statistically significant abnormal returns can be
observed in the period -5 until 0 of 2.87% at a 1%, from 0 to 5 of 2.03% at a 5% and of
30
be detected in the window starting 5 days prior and ending at the day of the announcement
of the spinoff by the parent company. This result can be seen as a leakage of information,
where a small group of investors receive the news before the broad public (See Bodie, Z.
et al. 2011). Moreover, the observed statistically significant positive CAR in the
investigation period caused by the spinoff announcement stands in line with prior studies
(See Miles, 1983, Hite, L. and Owers, J. 1983). Likewise, the highest abnormal returns
were observed around the days of the event. Thus, it can be concluded, that the
announcement of a demerger – like a spinoff – is associated with a positive impact on the
shareholder wealth for the equity owner of a company.
6
Empirical findings for the Determination of the abnormal
Returns
To estimate the source of the AR and CAR this part of the paper focusses on the
relationship between the financial ratios introduced in chapter 3. Moreover, it testes this
model also on its robustness including other variables.
6.1 Methodology
To model the relation between the above examined abnormal returns of the parent
company caused by the spinoff announcement and different financial ratios the
methodology of a multiple linear regression model based on the ordinary least squared
method (OLS) is adopted in this part of the paper. This method is applicable to show the
impact of dependent variables on the outcome of an independent variable. The multiple
31
𝑥 = + + +∙∙∙+ 𝑝 𝑝 (4)
where y represents the respond variable and , .. 𝑝 the independent variables (See
Williams 1959, P. 23) . In this study the individual cumulative abnormal returns of the
period five days before until eight days after the announcement are defined as the
dependent variable y. An overview over CAR of these window is given in the following
table 6.
Table 6: CAR for the event window -5 until 8 days
Window CAR t-statistic Number of positive CAR Minimum Maximum STD
-5 until 8 0,0583 2,180 ** 39 -0,192 0,5680 0,1222 Asterisks show significance at a value of 1% (***), 5%(**), 10%(*)
The selection of this window can be justified by the following reason. First of all, as this
study wants to measure the impact of the last available yearly financial ratio of the parent
on its abnormal returns a short window had to be chosen to not distort for additional
influential news. Thus a subjective maximum of fourteen days was defined by the author.
As during the period between -5 days until 8 days after the event the highest observable
statistically CAR occurred the author selected this windows (See Figure 1)
Moreover, also a dummy variable “SIC Dummy” was built to control for the fixed effect
indicating a difference between the future industry of the spinoff and the actual of the
parent company.11 This is in accordance with earlier developed papers indicating that increasing the industrial focus of companies by spinning out in a different industry than
the parent ones are associated with higher abnormal returns around the announcement
32
event (See Hemang, D./ Prem, C., 1999). Out of the 63 companies 50 spinoff companies
were classified in different industries rather than their parent firms.
To respect the impact of the relative size of the spinoff proofed by Hite and Owers (1983)
the variable “Size of the Spin” was created. As the value of the spinoff company was not
available for all companies on the Bloomberg Database the author calculated it by the
following equation 3
𝑉𝑎 𝑒 𝑝𝑖 = _ − ∗ 𝑒 ∗ 𝑋 𝑝𝑖 (3)
Where _ − represents the unadjusted shares outstanding of the parent for the fiscal
year before the completion date of the spinoff, 𝑒 the stock exchange terms between
the parent and the spinoff and 𝑋𝑝𝑖 the closing price of the spinoff on its first day of
trading.
In addition to estimate the size of the demerger decision relative to the total size of the
company the value of the parent company was similar calculated as in equation 3 by the
following formula:
𝑉𝑎 𝑒𝑃𝑎 𝑒 = _ − ∗ 𝑋𝑃𝑎 𝑒 (5)
Where _ − represents the unadjusted shares outstanding of the parent for the fiscal
year before the completion date of the spinoff and 𝑋 𝑝𝑖 the closing price of the parent
company on the first day of trading of its spinoff. The relative size of the demerger is
measured in by equation (6) in per cent:
𝑒 𝑎 𝑖 𝑒 𝑖 𝑒 = 𝑉𝑎 𝑒 𝑉𝑎 𝑒 𝑝𝑖
𝑃𝑎 𝑒 + 𝑉𝑎 𝑒 𝑝𝑖
33
6.2 Empirical Findings
To assure a comparability of the results of Part XY a linear regression for the response
variable “Return” against the predictor variables “TOT_DEBT_TO_TOT
_ASSET”,“RATIO NET DEBT”,“RETURN_ON_ASSET” adjusted for the additional
variables “Size of the Spin” and the dummy variables “SIC Dummy” and “Spinoff
Industry” was tested. This regression failed to fulfil the skewness and kurtosis
assumptions of the OLS.Therefore instead, of the OLS method a robust regression
method was chosen.
Table 7: Correlation between the Return and different Predictors
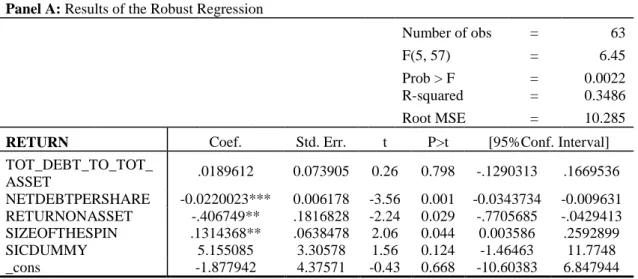
Panel A: Results of the Robust Regression
Number of obs = 63 F(5, 57) = 6.45 Prob > F = 0.0022 R-squared = 0.3486 Root MSE = 10.285
RETURN Coef. Std. Err. t P>t [95%Conf. Interval] TOT_DEBT_TO_TOT_
ASSET .0189612 0.073905 0.26 0.798 -.1290313 .1669536 NETDEBTPERSHARE -0.0220023*** 0.006178 -3.56 0.001 -0.0343734 -0.009631 RETURNONASSET -.406749** .1816828 -2.24 0.029 -.7705685 -.0429413 SIZEOFTHESPIN .1314368** .0638478 2.06 0.044 0.003586 .2592899 SICDUMMY 5.155085 3.30578 1.56 0.124 -1.46463 11.7748 _cons -1.877942 4.37571 -0.43 0.668 -10.60383 6.847944
Panel B: Overview over the distribution of the Ratios according to the Quartiles of the Return
Variable/ Quartile CAR < -2,42304 2,98275 7,180863 >7,180 TOT_DEBT_TO_TOT_
ASSET 30,49422 21,74077 27,35639 18,15453
NETDEBTPERSHARE 129,1419 42,70242 53,42211 15,55122 RETURNONASSET 4,439488 0,581485 3,846498 -6,0178 Size of the Spin 19,05583 20,73007 27,41285 31,90912 Panel A represents the results of the robust linear regression using Huber weights of the variables
“TOT_DEBT_TO_TOT_ASSET”,“RATIO NET DEBT”,“RETURN_ON_ASSET” , “Size of the Spin” and
34
From the outcomes of Panel A we can derive that almost 35% of the variance of the
returns can be explained by the selected four variables.
In more detail, the result of the variable Size of the Spin shows that the relative size of
the company does matter and influences the CAR of the parent company statistically
significant at a 5 percent level positively by 0.131. This, is also confirmed by the overview
given in Panel B, where the average relative size of the companies in the fourth quartile
is more than 50% larger than for the first. This result does stand in line with previous
studies about the impact of the relative size on the CAR of the stock around the
announcement day (See Hite and Owers 1983).
Moreover, also the Return on Asset, indicates at a significance level of 5 per cent that
stockholders of a company with a low return ratio are more likely to expect higher CAR
than otherwise. This results can be seen as a signal of the expectation of increasing
performance due to the demerger of a subsidiary of the company and stands in line with
earlier researches (See Hemang, D./ Prem, C., 1999 or Burch, T./ Nanda, V., 2003).
Furthermore, the CAR of this window is at a 1 per cent significance level negatively
correlated with the net debt per share. Therefore, each unit increase in the net debt affects
the CAR negatively by 0.022. This result is also confirmed by Panel B where the lower
quartile of the distribution of the returns shows higher average returns. This finding,
stands in contradiction to the outcome of the logistic regression in part 4, namely that the
net debt per share affects positively the spinoff decision. Thus, companies basing their
decision on this ratio seem to have to accept the following trade-off. As already explained,
companies with a high net debt per share ratio are more likely to suffer from high debt
35
companies can often readjust their capital structure and thus, reducing these costs. On the
other side, as Panel A indicates, that the expected CAR shrinks with the increase in the
net debt per share. Linking this to the condition of shareholder wealth maximization by
the decision takers of a company, managers of a firm do not act in favour by basing their
demerger decision only on this ratio. Besides this, as the net debt per share ratio does
negatively correlate with the CAR of the investigated period and bearing in mind the debt
pricing model developed by Merton (1974) debt holders are likely to be negative affected
by this event, especially these investing in firms with a high net debt per share ratio. On
the other side, also the equity holders of these companies suffer from lower CAR.
Therefore, no direct wealth transfer from the debt holders to the equity holders of a
company can be derived from this result, but as the overall CAR is positive for the sample
a signal in this direction is given.
Moreover, the debt to asset and the SIC dummy variable failed to show significance. For
the latter one, this stands in contradiction to the results developed Burch, T./ Nanda, V.
(2003) on the one side, but on the other side this outcome could be caused by different
methods of calculation.
Test for Robustness
To test the developed model for its robustness a second regression was designed to detect
further ratios that influence the CAR of the investigated period statistically significant.
Besides the net debt to average share price ratio, the size of the spin and the SIC dummy,
the dummy variable “Spinoff Industry” and the continuous variable “FNCL_LVRG” are
included. For the former one, this differentiation is necessary, as the spinoffs of the
36
depend on the market environment of the future target industry (See Chavez et al., 2000).
As this study is confronted with a small sample size, this classification was done on the
basis of the BICS.An overview over the Spinoff target industries is given in the following
table 8.
Table 8: Future Industry of the Spinoff firms according to the BICS
Sector BICS Number of Companies
Basic Materials 10002 5
Communications 10003 8
Consumer, Cyclical 10004 5
Consumer, Non-Cyclical 10005 23
Diversified 10006 1
Energy 10007 6
Financial 10008 2
Industrial 10011 7
Technology 10013 5
Utilities 10014 1
Total 63
The large cluster of companies located in the BICS sector 1005 is an indicator for a
consolidation of that sector during the observation period (See Mulherin, H. /Boone, A.
2000).
The FNCL_LVRG ratio represents the financial leverage of a company. It is calculated
by dividing the average assets of a company by its historical market cap of a financial
year. Thus, it can be seen as the inverse of the commonly known price to book ratio.
Hence, it can be interpreted as the impact of the conglomerate discount on the company
valuation. Therefore, companies with a high “FNCL_LVRG” ratio are assumed to benefit
more from the spinoff announcement than companies with a low ratio (See
Krishnaswami, S./Subramaniam, V. 1999). The following table 9 represents the results
37 Table 9: Result of the robustness regression
Panel A represents the results of the robust linear regression of the variables “”RATIO NET DEBT”,
“Leverage” and, “Size of the Spin” and the dummy variables “SIC Dummy” and “Spinoff Industry” (denoted by t) against the response variable “Return”. Asterisks show significance at a value of 1% (***), 5%(**), 10%(*).
The adjusted R2 of 0.5262 indicates that the multiple linear regression model table 9 explains over 50% of the variance of the response variable Return can be explained by
this model. Thus, this model represents a better goodness of fit than the former one.
Although, in this model sign of the coefficient of the net debt per share ratio sill indicates
a negative correlation between these ratios, it fails to show significance. The same is true
for the dummy variable SIC.
On the other side the size of the spin maintains to be a significant variable and the
FNCL_LVRG indicates significance at a 1 per cent level. This independent variable
impacts on average the CAR around the defined event window by over 0.8 for each
Panel A: Result of the OLS regression
Number of obs = 63
Source SS df MS F( 13, 49) = 6.30
Model 5613.23411 13 431.787239 Prob > F = 0.0000 Residual 3360.29322 49 68.5774126 R-squared = .6255
Total 8973.52733 62 144.734312 Adj R-squared = 0.5262 Root MSE = 8.2811
RETURN Coef. Std. Err. t P>t [95%Conf. Interval] NETDEBTPERSHARE -.0138269 .0090151 -1.53 0.132 -.0319433 .0042896 SIZEOFTHESPIN .0935946* .0509961 1.84 0.073 -.0088859 .1960751 FNCL_LVRG .8446827*** .1254539 6.73 .000 0.5925737 1.096792 SICDUMMY 2.695379 2.801434 0.96 0.341 -2.934314 8.325072 t1 -3.706255 9.096614 -0.41 0.685 -21.98659 14.57408 t2 .2792036 8.917191 0.03 0.975 -17.64056 18.19897 t3 -2.043341 9.162545 -0.22 0.824 -20.45616 16.36948 t4 -6.11833 8.529163 -0.72 0.477 -23.25833 11.02166 t5 1.826791 11.75333 0.16 0.877 -21.79241 25.44599 t6 4.745554 9.11963 0.52 0.605 -13.58103 23.07214 t7 -7.382833 10.26515 -0.72 0.475 -28.01142 13.24575 t8 -1.428652 8.969662 -0.16 0.874 -19.45386 16.59656 t9 12.28082 9.229017 1.33 0.189 -6.265585 30.82722
t10 0 (omitted)
38
increase in financial leverage. These results can be explained by the following
phenomena. The large regression coefficient is a strong indicator for the theory that two
separate firms are more worth than one alone standing entity. The causes for this
observation of this are various. For example, large companies are often devalued by a
conglomerate discount. This discount represents the costs of non-synergetic effects like
information asymmetries observable in these (See Krishnaswami, S./Subramaniam, V.
1999). Moreover, the management of these companies does more often involve in
strategies that are not in line with the interests of the shareholders and thus conflicts of
interests between arise between these two groups (See Roll, R. 1986). As a demerger like
a spinoff stands in clear contradiction to this problem, the announcement of this event by
the parent signals the market a good corporate governance. This phaenomena was also
confirmed by earlier studies that a good corporate governance does impact positively the
equity price of a company (See Gompers et al., 2003).12
7
Summary and Conclusion
As the empirical research about the determination of the patterns of companies of a
spinoff decision had shown this decision of a company depends statistically significant
on its debt to asset and its net debt per average share price ratio. The negative impact of
the first ratio does indicate that bondholders or creditors of companies do protect against
trigger events like demergers of firms. Moreover, the positive influence on the net debt
per average share ratio on the event implies that companies facing high debt costs are
more likely to be involved in a spinoff. On the one side, this indicates for the debt holders
39
of a company a loss of collateral or/and cash flows and thus a devaluation of their debt.
But on the other side no disadvantage of the status of the debt holder based on these ratios
could be measured over a period two years after the event. On contrary, on a long-term
perspective the average net debt per share ratio improved and approximated the ratio of
the peer group. Therefore, no negative impact on the creditors and their claims can be
derived from this perspective and hence also no wealth transfer from the bondholders to
the equity holders of a company.
Furthermore, like earlier researches had shown, this study confirms the abnormal returns
for stockholders resulting from the announcement of a spinoff by a company. The
investigation of the abnormal returns for 63 companies over an event window of 30 days
prior and 30 days after the event resulted in statistically significant cumulative abnormal
returns of 5.83 per cent. Moreover, the abnormal returns peaked on the announcement
date statistically significant at 1.86 per cent. Thus, spinning out a subsidiary firm does
increase the wealth of the shareholders of a company.
As sources of the statistically significant positive abnormal returns of the parents stocks
three different sources could be detected in a first regression. First of all, the expectation
of improving performance from the return on asset ratio, secondly, a possible wealth
transfer from the bondholders to the equity holders and last but not least also the increased
focus by the relative size of the company.
The first and the last source of shareholder gains represents the expectations about the
decrease of the conglomerate discount of a company after the spinoff of a subsidiary.
Therefore, companies with a low performance are considered to have a larger potential
40
cumulative abnormal returns and this ratios. Moreover, also the size of the spin does give
an indicator about the intensification on the focus of a company. Thus, relatively large
spinoffs do impact the cumulative abnormal return for the shareholders significant.
The negative correlation between the cumulative abnormal returns and its net debt per
average share price ratio delivers a two edged picture. On the one side no direct wealth
transfer between the debt holders and the equity holders of a company can be concluded
from it, as the overall cumulative abnormal returns are positive. Thus, the average ratio
net debt per share decreases due to the spinoff. On the other side, the redistribution of
collaterals does affect the creditors of a company negatively. Therefore, for companies
with a high net debt to asset ratio this impact should be worse, as their expected
cumulative abnormal return is also lower. Hence, a wealth transfer from the debt holders
to the equity holders of a company seems to be more likely these companies. These results
could also explain the contradictionary results of Maxwell, W./ Rao, R. (2003) and Veld,
C./ Veld-Merkoulova, Y. (2008) about a wealth transfer from the bondholders of a
company to the equity holders of a company.
In a second regression one additional source for the shareholder gains around the
announcement date could be detected, the financial leverage of a company. This result
strongly indicates an undervaluation of the aggregated parts of a company. By
announcing to demerge a subsidiary the expectation of the improvement of the now less
diversified firm is reflected by the strong positive correlation between this ratio and the
cumulative abnormal returns.
To sum up, spinning out a company is determined by the debt to asset and the net debt
41
positive abnormal returns for the shareholders of a company. These are statistically
significant correlated with the net debt to average share price ratio, the performance, the
size of the spin and the financial leverage of a company.
8
References
Bloomberg L. P. 2014. “Definitions”. Retrieved July 6, 2014 from Bloomberg Database.
Berk, J./ DeMarzo, P. 2014. Corporate Finance. Essex: Pearson Education Limited.
Bodie, Z. et al. 2011. “The Efficient Market Hypothesis”. In Investments and Portfolio
Management. 371-408. New York: Mc-Graw Hill.
Burch, T./ Nanda, V. 2003. “Divisional Diversity and the Conglomerate Discount:
Evidence from Spinoffs”. Journal of Financial Economics, 70: 69-98.
Chavez, R. et al. 2000 “Should you Spinoff your Internet Business”. Business Strategy
Review, 11(2): 19-31.
Comment, R./ Jarell, G. 1995. “Corporate Focus and Stock Returns”. Journal of
Financial Economics, 37 (1): 67-87
Crabbe, L. 1991. “An Analysis of Losses to Bondholders and “Super Poison Put Bond
Covenants””(Sic!). The Journal of Finance, 40(2): 689-706.
Cusatis, P. et al. 1993. “Restructuring through Spinoffs”. Journal of Financial
Economics, 33: 293-311.
Fame, E. 1970. “Efficient Capital Markets: A Review of Theory and Empirical Work”.
The Journal of Finance, 25(2): 383-417.
Gompers, P. et al. 2003. “Corporate Governance and Equity Prices”. The Quarterly