G
ROWTH
,
S
TRUCTURAL
C
HANGE AND
T
ECHNOLOGICAL
C
APABILITIES
L
ATIN
A
MERICA IN A
C
OMPARATIVE
P
ERSPECTIVE
M
ARIO
C
IMOLI
M
ARCIO
H
OLLAND
G
ABRIEL
P
ORCILE
A
NNALISA
P
RIMI
S
EBASTIÁN
V
ERGARA
Outubro
de 2009
T
T
e
e
x
x
t
t
o
o
s
s
p
p
a
a
r
r
a
a
D
D
i
i
s
s
c
c
u
u
s
s
s
s
ã
ã
o
o
Os artigos dos
Textos para Discussão da Escola de Economia de São Paulo da Fundação Getulio
Vargas
são de inteira responsabilidade dos autores e não refletem necessariamente a opinião da
FGV-EESP. É permitida a reprodução total ou parcial dos artigos, desde que creditada a fonte.
Growth, Structural Change and
Technological Capabilities
Latin America in a Comparative Perspective
Mario CIMOLI
*Marcio HOLLAND
**Gabriel PORCILE
***Annalisa PRIMI
*Sebastiàn VERGARA
**ECLAC-United Nations, Santiago, Chile **Federal University of Uberlandia and CNPq, Brazil
***Federal University of Parana and CNPq, Brazil
L
L
E
E
M
M
Laboratory of Economics and Management
Sant’Anna School of Advanced Studies
Piazza Martiri della Libertà, 33 - 56127 PISA (Italy)
Tel. +39-050-883-343 Fax +39-050-883-344
Email: [email protected] Web Page: http://www.lem.sssup.it/
Growth, Structural Change and Technological Capabilities
Latin America in a Comparative Perspective
♣♣♣♣Mario Cimoli
*Marcio Holland
**Gabriel Porcile
***Annalisa Primi
*Sebastián Vergara
*April 2006
Abstract
Countries differ in terms of technological capabilities and complexity of production structures.
According to that, countries may follow different development strategies: one based on
extracting rents from abundant endowments, such as labor or natural resources, and the other
focused on creating rents through intangibles, basically innovation and knowledge
accumulation. The present article studies international convergence and divergence, linking
structural change with trade and growth through a North South Ricardian model. The analysis
focuses on the asymmetries between Latin America and mature and catching up economies.
Empirical evidence supports that a shift in the composition of the production structure in favor
of R&D intensive sectors allows achieving higher rates of growth in the long term and
increases the capacity to respond to demand changes. A virtuous export-led growth requires
laggard countries to reduce the technological gap with respect to more advanced ones. Hence,
abundance of factor endowments requires to be matched with technological capabilities
development for countries to converge in the long term.
Key words: Latin America, Structural Change, Technological Capabilities, Growth JEL Classification: O30, O33
♣ This paper is based on Cimoli, M., Porcile. G., Primi, A. and Vergara S. (2005), “Cambio estructural, heterogeneidad productiva y tecnología en América Latina”, and Holland, M. and Porcile G. (2005), “Brecha tecnológica y
crecimiento en América Latina”, published in “Heterogeneidad estructural, asimetrías tecnológicas y crecimiento en América Latina”, Cimoli M. (ed), CEPAL, BID, 2005. Corresponding author: Mario Cimoli, [email protected] * Division of Production, Productivity and Management, ECLAC-UN, United Nations-Economic Commission for
Latin America and the Caribbean. The views expressed in this document are those of the authors and do not necessarily reflect the views of the Organization.
Introduction
The capability to promote structural change in order to profit from new technological
paradigms and demand growth is a critical determinant of a country relative economic
performance in the international arena. And, this is mostly true in open economies, where
products, production processes and sectors internationally emerge and disappear at a high pace.
Actually, the relationship between structural change and economic development
traces back to the analyses of the development theory pioneers. In the fifties, development
required the reallocation of production factors from low productivity to high productivity
sectors where increasing returns prevailed3, and hence industrialization was seen as the way
out from the “peripheral” condition. The manufacturing sector would allow increasing returns
to ensue and technological learning to develop; and an increasing participation of industry in
total value added would grant spillover effects, backward and forward linkages and
technological externalities, which in turn would accelerate capital accumulation and growth4.
Within this framework, production structure transformation would, gradually, lead to
a change in the international specialization pattern. Prebisch (1950;1981) emphasized that the
production structure of peripheral countries implied a much higher income elasticity of
demand for imports than their income elasticity of demand for exports, thus inducing recurrent
external imbalances in the those countries. Assuming low price elasticities of import and
export demand, the South would have to grow at lower rates than the North to avoid external
disequilibrium (Rodriguez, 1981). This implies divergence in income per capita between North
and South, which could only be avoided by a reorientation of the relative specialization.
This view on structural change and development has been enriched in the 1960s by
some new contributions in the technology and trade theory (Posner, 1961; Freeman, 1963;
Hirsch, 1965; Vernon, 1966). International asymmetries in technological capabilities started to
be regarded as main determinants of trade flows and specialization patterns, hence influencing
economic growth5. Knowledge and technology leave the free good domain and are converted
in oligopoly assets that confer a significant competitive advantage to those who innovate.
3 Hirschman, Prebisch, Rosenstein-Rodan, Gerschenkron, Chenery and Sirkin are some of the classical authors in the
development theory. For a reviewof their contributions see Ray (1998, Chapter 5).
4 Recently, these “old" issues, such as as: externalities, indivisibilities, spillovers and increasing returns are evoked in
the "new growth theories" (Grossman and Helpman, 1992; Krugman, 1991; Aghion and Howitt, 1998; Ray, 2000; Ros, 2000). Diversification in production structures and increasing returns in R&D intensive sectors explain sustained per capita income growth in the long term and structural change depends on the creation of new capital assets, increasing labor division and improvements in the quality of the industrial produce. At the same time, the innovation pace of the R&D intensive sectors sustains production structure diversification and increasing returns.
5 Freeman (1963) highlights the differences that determine the specialization pattern before and after the imitation
This perspective is also the distinctive feature of the evolutionary school, which
emphasizes the role of technological change in shaping structural change and growth (Dosi et
al 1990). Economies that are able to absorb new technological paradigms and that transform
their production structure increasing the participation of R&D intensive sectors or production
stages will converge. Three relevant implications emerge from this approach.
First, the evolutionary theory predicts persistent asymmetries in production
capabilities. At any point in time two major testable conjectures can be drawn: (i) different
countries can be unequivocally ranked both according to the efficiency of their average
production techniques and, in the product space of the price-weighted performance, according
to the characteristics of their outputs, irrespectively of relative prices; (ii) there will be no
significant relationship between these gaps and international differences in the capital/output
ratios. The capability to develop new products and the capacities to imitate already existing
ones will be extremely skewed. Indeed, the international distribution of innovative capabilities
is at least as uneven as that regarding the production processes.
Second, development and industrialization are strictly linked to inter- and
intra--national diffusion of "superior" techniques. At any point in time there is likely to be only one
or at most very few "best practice" production techniques that correspond to the technological
frontier. In the case of developing economies, industrialization is thus closely associated with
the transfer, imitation and adaptation of established technologies from more advanced
economies. Capabilities of adopting and adapting technologies are, in turn, influenced by the
specific capabilities of each economy.
Third, evolutionarists emphasize the importance of the institutional dimension for
production and innovation development. Actually, at a micro level, technologies embedded in
particular institutions, the firms, whose characteristics, decision rules, capabilities, and
behaviors directly shape the pace and directions of technological advance. Within this
framework the concept of "national innovation system” ensues as a relevant dimension for
understanding the relative performance of countries in international competition (Cimoli and
Dosi 1995; Freeman, 1987; Nelson, 1993).
Actually, technological and institutional gaps and asymmetries can jointly reproduce
themselves over rather long spans of time, or, conversely, it might be precisely the institutional
and technological diversity among countries that may foster catching-up (and, in some rare
cases, leapfrogging) in innovative capabilities and per capita income. And, it is within this
evolutionary micro-theory that we are going to analyze the evolution of technological
capabilities, structural change and growth of Latin America in a comparative perspective.
The paper is organized in four sections. Section I develops a simple model of
convergence and divergence, based on Cimoli (1988) and Fagerberg (1988). Section II
discusses the transformation of the Latin America production structure in terms of
technological capabilities and international competitiveness, showing that the virtuous link
between exports and output growth requires a reduction in the technological gap with respect
to more advanced economies. On the basis of these analyses, section III identifies two types of
countries’ rent seeking strategies: one which exploits the opportunities offered by the relative
abundance of natural resources or labor and the other based on the capacity to extract rents
from technological capabilities. Section IV concludes.
1
A Model of Convergence and Divergence
Empirical evidence on international trade and convergence suggests that caution is needed
when exploring the impact of trade on the specialization pattern. In conventional models,
international trade is expected to contribute to convergence by inducing the adoption of new
technologies and by encouraging a more efficient allocation of resources (see for instance
Barro and Sala-i-Martín, 1994). Therefore, there should be a positive association between
openness and economic growth. But this perspective is challenged by that literature pointing
out that convergence and openness have not always gone hand by hand (Easterly, 2001;
Rodríguez and Rodrik, 2001). Convergence or divergence, in these cases may depend on
whether openness is complemented by local efforts of technological learning and on the
adoption of policies favoring a more dynamic specialization pattern (Cimoli and Correa, 2005;
Fagerberg, 1994; Hausmann and Rodrik, 2003; UNCTAD, 2003).
Within this framework, Ricardian trade models with a continuum of goods are powerful tools
for analyzing the role of technology in international trade; they bridge Keynesian (demand-led)
growth, the balance-of-payments constraint and technological and structural change. In these
models, countries specialize on the basis of the differences in labor productivity arising from
technological frontier show much higher productivity in high-tech, innovation-driven sectors
than laggard countries. At the same time, productivity differences will be lower in sectors in
which technology is already standardized and, consequently, the technological frontier moves
slowly. These considerations frame a setting where innovation dynamics and technology
diffusion in the international economy determine a country’s specialization pattern
In point of fact, Ricardian models results effective in studying convergence and
divergence amongst countries in the international economy. In effect, in a two country model,
one of which is the technological leader (North) and the other the follower (South), current
account equilibrium implies that the relative North-South income must be a function of the
number of goods that each country produces, i.e. a function of the two different specialization
patterns. The evolution of relative income through time, i.e. the convergence or divergence in
the international economy, will depend on how technological change redefines the location of
production: if the South expands the range of goods that it produces towards more dynamic
sectors (i.e. towards sectors with rising demand or productivity), there will be convergence.
Moreover, Ricardian models may link the Schumpeterian perspective, with its focus
on technology and structural change, and the Keynesian balance of payments constrained
growth models, that highlight the role of demand in sustaining growth. In the Keynesian
tradition, the specialization pattern is embedded in the income elasticities of demand for
exports and imports (McCombie and Thirlwall, 1994), thus being the link between
specialization patterns and demand implicitly present in these models. Ricardian models permit
to look at elasticities as the outcome of a process of structural change. The elasticities are then
expressed as a function of the parameters that define the relative rates of innovation and
technology diffusion in the international economy. In what follows a simple model of
convergence and divergence is presented.
a) The Ricardian Model and the Technological gap
The Ricardian model presented in this section is based on Dornbush et al (1977), and the
subsequent Neo-Schumpeterian revisions of Cimoli (1988) and Dosi et al (1990). We assume a
two-country model, where the North (N) and the South (S) differ in terms of their
technological development, being the North the more advanced country. Both countries
compete in the production of a large number of goods. Comparative advantage depends on
relative labor requirements defined as
z z
a
a
z
A
(
)
=
*
, where a*z are the hours per workerrequired to produce one unit of good z in the North and az are the hours per worker required to
technology. The subscript
z
∈
[ ]
0
,
1
is defined in such a way that goods are ranked in adescending order in terms of the comparative advantage of the South. The slope of the AA
curve reflects the rate at which the South looses its comparative advantage as the economy
diversifies towards sectors that are more technology intensive. The WW curve represents
relative wages W= w/w* between South (w) and North (w*).
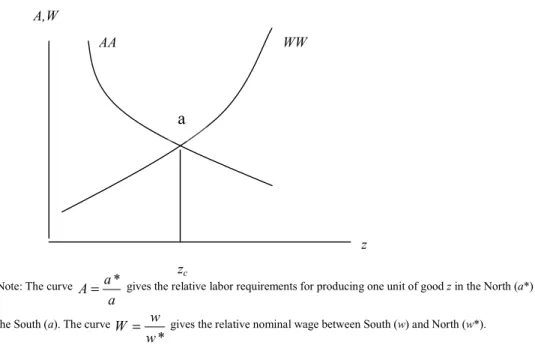
Figure 1 shows the curve AA that represents relative labor requirements and the curve
of relative wages (WW), that both define the specialization pattern. Assuming that labor is the
only factor of production, the exchange rate is constant and equal to 1, and the goods market is
perfectly competitive, the South will produce the goods for which A>W. Thus, the South will
produce goods ranging from z0 to zc while the North will start producing goods from zc .
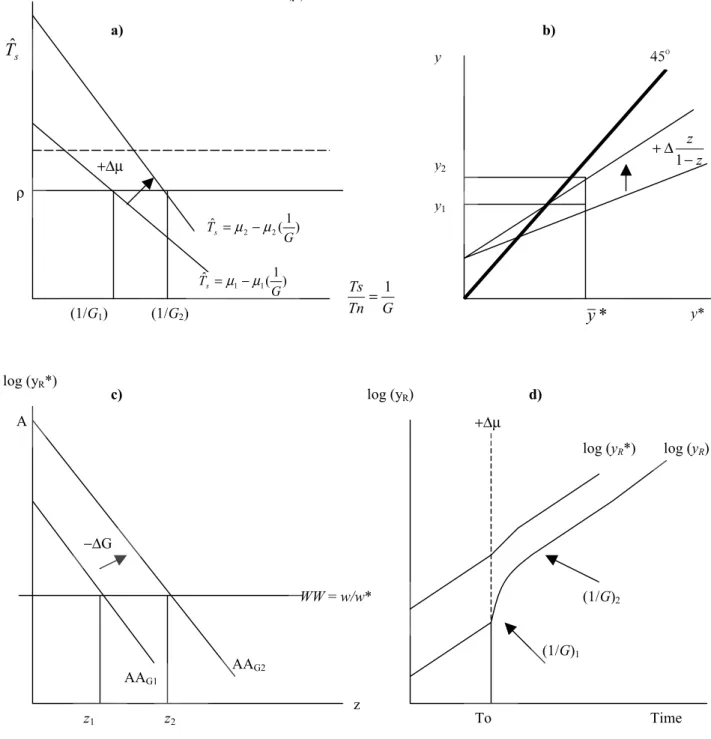
Figure 1. The Ricardian model
Note: The curve a a
A= * gives the relative labor requirements for producing one unit of good z in the North (a*) and the South (a). The curve
* w
w
W = gives the relative nominal wage between South (w) and North (w*).
It is assumed that the position of the AA curve depends on the technological gap
defined as = ≥1
Ts Tn
G , where Tn and Ts are respectively, the technological levels of North
and South. The evolution of the technological gap depends on the relative rates of innovation
in the North and of technology diffusion towards the South. Following Fagerberg (1988) and zc
WW
z AA
A,W
Narula (2004), technological spillovers from North to South are assumed to be a linear
function of the inverse of the technological gap and the learning efforts in the South6:
(1)
− − =
G
Gˆ ρ µ 1 1
Where
G G
Gˆ = D the proportional growth rate of the technological gap, ρ is the exogenous rate of
growth of knowledge in the North and µ is the domestic effort of the South to master Northern
technology. Both parameters are positive and constrained, so that µ > ρ > 0.
Although the model is aggregate and not micro-founded, the parameters that define
the evolution of the technological gap can be easily interpreted in the light of the
Schumpeterian literature on social capabilities (Abramovitz, 1986) and National Systems of
Innovation (Freeman, 1987). The parameters ρ and µ reflect the amount of resources allocated
to R&D and the institutional setting in which technological learning proceeds in both
countries. There is evidence pointing out that imitation does not occur automatically, but it is
the result of investments in learning that may vary considerably across countries (Cimoli and
Katz, 2002). These differences are reflected in µ. Alternatively, the parameters of the model
can be seen as the equilibrium result of a micro process in which economic agents choose to
become either innovators or bureaucrats, as in the Sah and Stiglitz (1988) model. In this case,
the South will reach an equilibrium featuring a larger proportion of bureaucrats than the North,
and this explains the asymmetry between North and South in terms of technological learning.
The stability of the technological gap implies that:
(2)
ρ µ
µ − =
⇒
=0 G* G
GD
Equation (2) gives the equilibrium value of the technological gap (G*) as a function
of the parameters that define the effort for innovation in the North and for imitation in the
South. It is straightforward that in equilibrium the gap will not be fully closed.
b) Productivity, wages and diversification
In what follows we address the role of technological gap in shaping the pattern of comparative
advantages. It is assumed that the technological gap affects the position of the curve AA, as in
the following equation:
6 A more realistic assumption would be that of a nonlinear relationship between technological spillovers and the
(3) Az G bz z
a z a
− − = = ( ) α β )
( ) ( *
Where α, β and b are positive parameters and α > β + b.
A reduction in the technological gap shifts the AA curve to the right, increasing the relative
labor requirements of the North for all goods z produced in the international economy. At this
point, assumptions about how the WW curve behaves are needed. To start, let us assume that
nominal wages are constant and therefore WW is horizontal – in other words, the relative
nominal wage remains constant as z increases7. Constant nominal wages can be justified
considering that the labor market in the “large” North is fairly resistant to changes in
competitiveness in the “small” South, while the abundant supply of labor in the South allows it
to boost employment rather than nominal wages when the economy grows8. Therefore:
(4) W h
w w
= =
*
Where 0<h≤
α
−β
. Since in equilibrium A must equal W, it is possible to get the specialization pattern (the set of goods produced in) of South and North as a function of thetechnological gap.
(5)
b h G zc=α−β −
If the technological gap is in equilibrium, then using equation (2) in (5) yields:
(5 )
b h zc
) (
) )( (
ρ µ
µβ ρ µ α
− − − − =
This equation gives the pattern o specialization as a function of the exogenous parameters. The
partial derivative of (5) with respect to µ is unambiguously positive, suggesting that the
Southern economy can diversify the economy by intensifying its imitative effort. On the other
hand, if the rate of innovation in the North suffers an positive exogenous shock, while the
imitative effort in the South stays still at about the same level as before, then the technological
gap and the number of goods produced in the North will expand at the expense of employment
in the South.
c) Specialization and the external constraint
Now, the model allows studying how specialization shapes North-South relative income levels.
This requires the study of the conditions necessary for international current account
equilibrium. Equilibrium in the international economy (assuming the absence of capital flows)
requires the current account of the two countries to be balanced. We assume that consumers
spend exactly the same percentage of their nominal income in each type of z. good. If the
7 On the other hand, as it will be discussed later, despite nominal rigidity, real wages may be increasing as a result of
productivity growth in both in the North and in the South.
8 Under these assumptions, it is the level of employment in the South that endogenously adjusts so as to completely
South produces goods for which 0
≤
z≤
zc (and hence the North produce goods for which zc< z
≤
1), then zc will be the percentage of the nominal income that consumers, both in theNorth and in the South, spend on goods produced in the South. If the exchange rate is fixed
and assumed unitary, then Southern exports will equal the Northern nominal income (y*) times
zc (Obstfeld and Rogoff, 1996, p.240). Symmetrically, Southern imports will equal the
Southern nominal income (y) times (1-zc) (the latter being the share of the nominal income of
the South that goes to buy Northern goods). Then, the current account equilibrium condition
requires that (1- zc)y = zc y*. The equilibrium condition in the international economy is as
follows:
(6) *
z 1
z
c c y y
− =
Equation (6) gives the nominal income in the South that is consistent with external equilibrium
as a function of the Northern nominal income and the degree o diversification of the Southern
economy (the number of goods whose production is located in the South in relation with the
total number of goods). This represents a Ricardian version of Thirlwall’s Law (McCombie
and Thirlwall, 1994, chapter 3), in which the elasticity parameters of the demand functions for
exports and imports have been replaced by parameters that reflect the production
diversification in the South. The economy will be constrained by external equilibrium, and if it
fails to pass the test of international competitiveness, the result would be either less
employment or lower wages. Since zc depends on the technological gap (equation 5), then
equation (6) can be written as:
(7)
) (
) ( * b uG
G u y
y
− =
where u(G) = α – βG – h, ie. the relative North-South nominal income is as a function of the technological gap. The impact of changes in the technological gap on relative nominal incomes
through deriving (7) with respect to G:
(8)
2 )) ( ( *) / (
G u b
b G
y y
− − = ∂
∂ β
And (8) is negative. Moreover, equation (6) states that nominal incomes will be equal in North
and South only in the special case in which the two countries produce exactly the same number
of goods, zc = ½.
d) Convergence and Divergence
By differentiating equation (6) with respect to time, it is possible to analyze how the evolution
(9) c c z z y y − = − 1 ˆ * ˆ ˆ
where cap on variables denote rates of growth (
y
ˆ
=
y
/
y
). This equation stresses that forconvergence to occur the South must be diversifying its economy. Moreover, as changes in
specialization respond to adjustment in the technological gap, it results that income and
technological convergence are interrelated, as the differentiation of (7) with respect to time
shows, see equation 10)9
(10) 2 )) ( ( *) ˆ ˆ (
* b u G
G b y y y y − − =
− βD
Equation (10) shows that convergence (
y
ˆ
−
y
ˆ
*
> 0) will occur when the technological gapcloses (GD < 0).
So far the discussion has focused convergence in nominal incomes. But, as according
to the model’s assumptions the principle of purchasing power parity (PPP) holds true in its
strongest version (the Law of One Price), the model’s conclusions can be extended to
convergence in real incomes as well., In effect, nominal wages are constant in both countries
and therefore they do not affect prices; consumers spend their nominal income in the same
goods, and in exactly the same proportions; perfect competition assures that productivity
growth fully translates into lower prices; and the exchange rate is constant. As a result, at any
moment inflation rates are equivalent in the two countries, and the evolution of the
North-South relative income in nominal terms will be the same as the evolution of relative income in
real terms:
(11)
y
ˆ
R−
y
ˆ
*
R=
y
ˆ
−
y
ˆ
*
+
(
p
ˆ
*
−
p
ˆ
)
, and forp
ˆ
=
p
ˆ
*
, then(12) c c R R
z
z
y
y
y
y
−
=
−
=
−
1
ˆ
*
ˆ
ˆ
*
ˆ
ˆ
where the subscript R indicates that the variable is expressed in real terms10.
e) Flexible Relative Nominal Wages
So far nominal wages were assumed constant and changes in nominal income reflected
adjustments in employment in the South. Let us assume now full employment both in the
North and in the South and suppose that relative nominal wage adjusts to respond to changes in
international competitiveness. Since labor is the only factor of production, its amount is
9 where dots on the variables denote derivates with respect to time (i.e. dt dG GD = ).
10
constant, the followings hold: y = wL and y* = w*L*. Therefore, the current account
equilibrium condition defined by equation (6) can be written as follows:
(13) * *
1 z w L
z wL
c c
− =
The value of zc as a function of G derives from equations (3) and (13) and the equilibrium
condition A=W=
*
w
w
(given L and L*):
(14)
b
G b G f G f zc
2
) ( 4 )] ( [ )
( 2 α β
− − −
=
Where
f
(
G
)
=
α
−
β
G
+
b
+
c
> 0, and c = (L*/L).Although equation (14) is not as simple as equation (5), it does not affect the basic model’s
results. In particular, relative income levels continue to be described by equations (6) and (7),
while the rate of nominal and real convergence are described by equations (9) and (10). The
difference is that, in this case, convergence is related to changes in relative nominal wages that
endogenously respond to the diversification in the South (while employment remains
constant). Therefore:
(15)
c c
z
z
w
w
y
y
−
=
−
=
−
1
ˆ
*
ˆ
ˆ
*
ˆ
ˆ
If one makes the additional assumption that the North is big enough so as to remain unaffected
by structural change in the South, then nominal wages in the North will remain constant and
the effects of new policies will be fully translated into an increase of nominal wages in the
South. In this case, the mechanism of convergence will be a reduction in the gap between real
wages in North and South. The Ricardian model gives rise to two testable predictions. These
predictions stem from equations (6), (7), (9) and (10) and can be summarized as follows:
o GDP per capita growth will be positively related to technological
capabilities, which are represented by the parameter µ;
o GDP per capita growth will be positively associated with the diversification
of the export structure towards technology-intensive sectors.
f) Empirical Evidence
The empirical evidence that follows is based in econometric estimations for two different panel
data: i) a two-year panel data (using the years 1990 and 2000) and ii) a 14-year panel data
(including data for the whole period 1990-2003). The two-year panel data assesses the role
played by National Innovation Systems in economic growth. The 14-year panel data tests the
The ArCo index, based on by Archibugi and Coco (2004), is proxy for technological
learning. This Index is as a linear combination of three indicators related to different
dimensions of NIS: (Ia) creation of technology; (Ib) technological infrastructure development
and (Ic) human capital formation efforts11. As mentioned, the ArCo index is available only for
two years, 1990 and 2000.
The second panel data (14-year series) 12 helps to study the role of international
specialization using terms of trade, participation of agricultural raw materials in total exports13
and participation of high-technology exports in total exports14 as proxies for the degree of
export diversification. Terms of trade are equal to the capacity to import minus export of goods
and services in constant prices. A first econometric tests is run on the following equation:
(17)
y
ˆ
it=
α
i+
β
iArCo
it+
ε
itWhere
y
ˆ
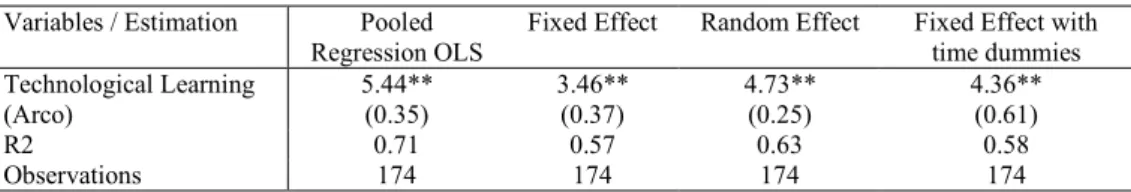
it is the per capita GDP growth rate of country i at time t. Table 1 shows the resultsfor Ordinary Least Squares (OLS), random and fixed effects estimations. Estimated parameters
suggest that the Schumpeterian approach to Ricardian model is consistent with empirical
evidence. In all cases the coefficient of the technological learning index is positive and
significant. As stressed by the Schumpeterian literature, catching-up in the international
economy in terms of technology and real incomes is a function of what has been broadly
defined as the national innovation system.
Table 1. Economic Growth and Technological Capabilities
Variables / Estimation Pooled Regression OLS
Fixed Effect Random Effect Fixed Effect with time dummies Technological Learning
(Arco)
5.44** (0.35)
3.46** (0.37)
4.73** (0.25)
4.36** (0.61)
R2 0.71 0.57 0.63 0.58
Observations 174 174 174 174
Notes: ** significant at 5%
The Balance-of-Payments constrained approach suggests, in turn, that technological
learning affects growth by allowing for the diversification of the export structure towards more
11 The variable (Ia) includes number of patents per capita obtained in the United States and per capita number of
scientific papers published by the residents of the country; (Ib) is a combination of three variables that seek to capture the development of the technological infrastructure: internet penetration, telephone penetration and electricity consumption; and (Ic) is a proxy for investment in human capital, including mean years of schooling, tertiary science and engineering enrolment, and the literacy rate.
12 Data were obtained from UN COMTRADE Database and World Bank (2005).
13 Agricultural raw materials comprise section 2 (crude materials except fuels) excluding divisions 22, 27 and 28
(crude fertilizers and minerals excluding coal, petroleum, and precious stones and metal ores and scrap) of the Standard International Trade Classification (SITC).
14 The high-technology exports comprise exports from sectors that are intensive en R&D, namely aerospace,
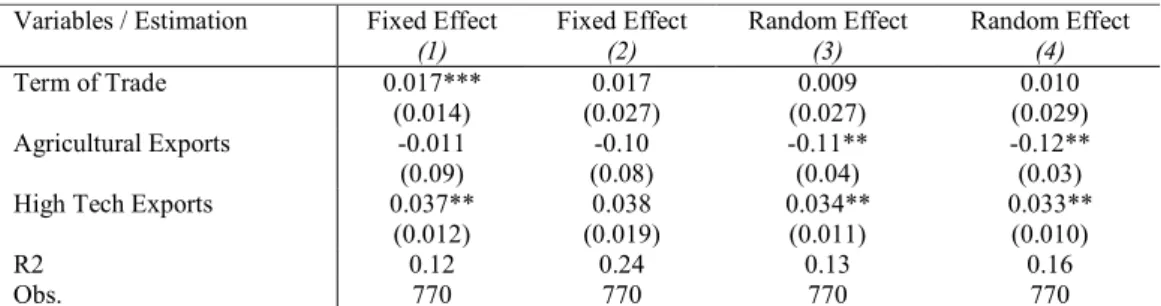
dynamic sectors. In other words, the demand-side must not be neglected. To test this
hypothesis, the following econometric model is estimated:
(18)
y
ˆ
it=
α
i+
β
iPS
it+
ε
itWhere PS is the vector of the three variables used as proxies for the dynamism of the
specialization pattern.: terms of trade, participation of agricultural exports in total exports and
participation of high-technology exports in total exports. We suppose that high-tech exports
represent dynamic items in international trade, while agricultural exports tend to generate less
technological externalities and also face a lower income elasticity of demand. And the
econometric results are consistent with the hypothesis that specialization matters for growth.
All coefficients are significant and have the expected signs (see Table 2).
Table 2. Economic Growth and Specialization
Variables / Estimation Fixed Effect
(1)
Fixed Effect
(2)
Random Effect
(3)
Random Effect
(4)
Term of Trade 0.017***
(0.014)
0.017 (0.027)
0.009 (0.027)
0.010 (0.029) Agricultural Exports -0.011
(0.09)
-0.10 (0.08)
-0.11** (0.04)
-0.12** (0.03) High Tech Exports 0.037**
(0.012)
0.038 (0.019)
0.034** (0.011)
0.033** (0.010)
R2 0.12 0.24 0.13 0.16
Obs. 770 770 770 770
Notes: (2) Estimation with time dummies. (4) Estimation with regional dummies. ** significant at 5%; ** * significant at 10 %.
These econometric estimations confirm the predictions of the Ricardian model
previously presented15.
15 However, future research based on a wider panel data would be beneficial. The authors are currently working on
2
Structural change and technological capabilities
This section compares empirical evidence on the Latin American technological and structural
change in a comparative perspective during the last 30 years focusing on production structure
and exports’ dynamism. The analysis is based on a sample composed by 17 countries; seven of
which are from Latin America and represent more than 90% of Latin America’s GDP. The
analysis is based on the following variables: i) structural change, measured as the share of the
value added of R&D intensive sectors in the total manufacturing added value, ii) R&D
expenditures as % of GDP, iii) relative labor productivity in the manufacturing industry with
respect to the US; iii) accumulated number of per capita patents registered in the USPTO, iv)
changes in the international specialization pattern, measured by the Adaptability Index; and v)
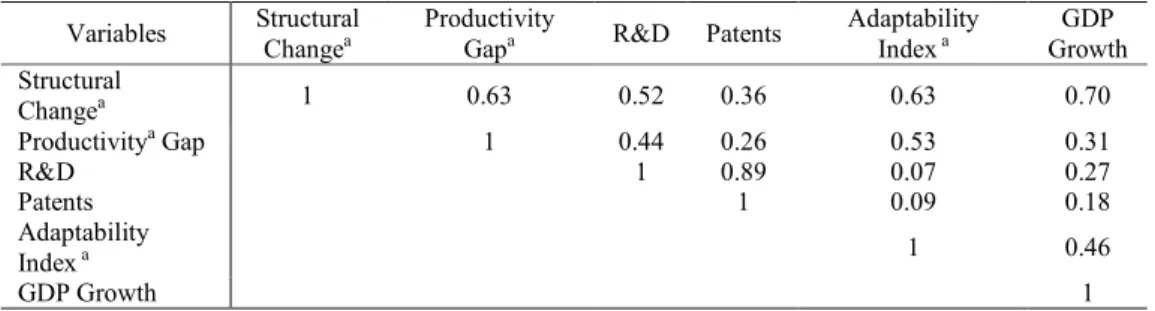
economic growth16. Table 3 presents the correlation matrix between these variables.
Table 3. Matrix of Variable Correlations
Variables Structural Changea
Productivity
Gapa R&D Patents
Adaptability Index a
GDP Growth Structural
Changea 1 0.63 0.52 0.36 0.63 0.70
Productivitya Gap 1 0.44 0.26 0.53 0.31
R&D 1 0.89 0.07 0.27
Patents 1 0.09 0.18
Adaptability
Index a 1 0.46
GDP Growth 1
Source: Own elaboration based on Annex 2. d Variation rates.
According to simple correlations structural change appears as highly correlated with
GDP growth. At the same time, the intensity of structural change is closely related with R&D
expenditure (relative to GDP) and the Adaptability Index. This suggests that the economies
that increased the share of R&D intensive sectors in total manufacturing value added increased
and that invested the more in innovation, grew faster.
Correlations between technological variables and economic growth are not as high as
those between growth and the variables that grasp the characteristics of the production
structure. This suggests that the effects of learning and innovation on growth are mediated by
structural change. In what follows we give evidence of the asymmetries in structural change
and technological efforts in Latin America with respect to emerging or frontier’s countries.
Manufacturing industry can be classified in three different categories: natural resource
intensive, labor intensive and R&D intensive activities (see Annexes 2 and 3). The US,
Finland, Korea, Malaysia, Singapore and Taiwan show the highest increase in the share of
R&D intensive sectors in total manufacturing value added between 1970s and 2000. At the
same time, almost all countries saw, during the same period, a reduction in the participation of
labor-intensive activities in total manufacturing value added. Latin America, On the other
hand, shows a quite stable production structure.
Figure 2 portrays the variation in the participation of R&D intensive activities in
manufacturing value added between 1970 and 2000. Figure 2a compares Latin America with
US, Norway, Finland and Australia. The weight of R&D intensive sectors increased in mature
economies, like US and Finland from 40% to 60% and 23.8% to 46.4%, respectively. On the
other hand in Latin America the participation of the R&D intensive sectors only increased
from 21.1% to 28.3%. Figure 2b highlights the technological leadership of Asian countries
where the participation of R&D sectors reaches 63%, 65.4% and 55.3% of total manufacturing
value added in Korea, Singapore and Malaysia, respectively. Figure 2c helps to identify
heterogeneity within Latin American countries. Between 1970 and 2000 the share of R&D
sectors in Argentina, Colombia, Peru and Uruguay decreased, while it increased in Brazil and
Figure 2. Participation of R&D intensive sectors by regions and countries, 1970 and 2000
(Percentages)
a) b) c)
Figure 3 looks at structural change from a different perspective. The production
structure composition is measured in the Y-axis, where the cumulative share of natural
resource intensive, labor intensive and R&D intensive activities is measured17. The X-axis
measures labor productivity. Shifts along the X-axis reveal productivity changes, while
movements along the Y-axis measure variations in the share of each kind of activity within
total value added, i.e. structural change.
Figure 3a) compares Latin America with the US. The increase in productivity
achieved by the US is much higher than that of Latin America. Differences are not limited
to productivity; they also concern the production system. In 2000 in the US R&D intensive
activities represented 60% of the industrial value and were, at the same time, the most
productive activities. This is not the case for Latin America. There, natural resource
intensive activities are the more productive ones and those that contribute the most to the
generation of total manufacturing value added. Although in some Latin American
countries the participation of R&D intensive activities increased, the intensity of this
change is clearly less marked than the one that occurred in US and in catching up
economies like the Asian ones.
The increasing share of R&D intensive sectors in manufacturing matched with
productivity growth is the source for a virtuous process that generates and diffuses
knowledge. Firms and sectors interact absorbing products and improving their production
processes with greater technological content (Dalum, Laursen and Verspagen, 1999).
Abramovitz and David (2001), for example, explain the variation in the pattern of growth
in the US between 1800 and 1900 as a result of the modification in the sources of labor
productivity growth; the importance of physical capital and tangibles was progressively
less relevant in accounting for growth that the role of intangibles18. The US shifted from
natural resource intensive specialization pattern to a pattern based on creation and
diffusion of knowledge and intangibles mostly supported by the accumulation of
technological and organizational capabilities.
The relevance of the specialization pattern in determining growth also finds
empirical support in the analyses of cases of Korea, Singapore, Taiwan and Hong Kong
(Nelson and Pack, 1999). These authors demonstrate that the higher growth rates in these
countries derived from a substantial modification of their production structure due to an
increase in the participation of R&D intensive activities in manufacturing and to the efforts
directed to augment the capacity to gradually diffuse knowledge.
Figures 3b) and 3c) compare structural change in Korea with Brazil and Mexico.
Both Latin American countries present a modest performance compared to Korea.
17 Obviously the cumulative shares should sum 100, and the relative participation of each kind of activity can be
obtained by difference in the Y-values.
18 Abramovitz and David interpret economic growth in the US throughout the last two centuries as the result of
Nevertheless, the industrial trajectories of Brazil and Mexico imply different strategies. In
Brazil, market size and the active policies of the seventies supported the development of
quite remarkable R&D intensive industries (Ferraz et al, 2004), whereas in Mexico
attraction of foreign direct investments (FDI) and the integration to global productive
systems, especially with the US, was the dominant aptitude (Capdevielle, 2005; Mortimore
and Vergara, 2003).
On the other hand, the Korean development strategy was deliberately oriented to
the creation and accumulation of technological capabilities; the first industrial
development plan dates back to 1962. Korean structural change resulted from an
intentional strategy to foster a gradual industrialization that aimed to create the technical
capabilities and to promote innovation privileging knowledge intensive industries. A
selective combination of industrial and commercial policies was used to promote this
knowledge-oriented industrialization. Figures 3b) and 3c) show the transformation of the
Korean production structure and its gains in labor productivity19.
Figure 3d) present the cases of Chile and Finland. In both countries, at the
beginning of the seventies natural resource intensive activities dominated the production
system, representing 61.7% of the Chilean manufacturing value added and the 52%of the
Finnish one But in the decades after, the two countries followed different industrial
trajectories. Finland experienced a radical technological upgrading of the production
structure by increasing the participation of R&D intensive sectors from 23.8% to 46.4, and
maintaining, at the same time, a significant share of natural resource intensive activities
(these activities accounted for 40.4 % of total manufacturing value added in 2000).
Conversely, Chile reinforced its specialization pattern in natural resources. In 2000, natural
resource intensive activities accounted for 67.5 % of total manufacturing value added,
while R&D intensive activities only represented the 12 %.
19 See Krugman, 1994 for a discussion on the relative importance of capital accumulation and Nelson and Pack,
Figure 3. Structural Change and Productivity, 1970-2000
(Percentages and dollars)
a) Latin America and US b) Brazil and Korea
0.0 25.0 50.0 75.0 100.0
0 20000 40000 60000 80000 100000 120000 140000 160000
Labor productivity (1985 US$ dollars)
Indus tr ial s h a r (P erce n tag es)
Natural resources intensive Labor intensive R&D intensive
Latin America 2000 USA 1970
Latin America 1970
USA 2000 0.0 25.0 50.0 75.0 100.0
0 5000 10000 15000 20000 25000 30000 35000 40000 45000 50000
Labor productivity (1985 US$ dollars)
Indus tr ia l S ha r (P ercen ta je s)
Labor intensive "R&D intensive Natural resources intensive
Brazil 2000 Brazil 1970
Korea 1970 Korea 2000
c) Mexico and Korea d) Chile and Finland
0.0 25.0 50.0 75.0 100.0
0 5000 10000 15000 20000 25000 30000 35000 40000 45000 50000
Labor productivity (1985 US$ dollars)
Indus tr ia l s h ar (P er ce nt ages )
Labor intensive R&D intensive Natural resources intensive
Mexico 2000 Mexico1970
Korea 1970 Korea 2000
0.0 25.0 50.0 75.0 100.0
0 10000 20000 30000 40000 50000 60000
Labor productivity (1985 US$ dollars)
In d u st ri a l sh ar (P er cent aj es)
Labor intensive R&D intensive Natural resources intensive
Chile 2000 Chile 1970
Finland 1970 Finland 2000
There is an issue that has been implicitly involved in our discourse: the role of
R&D spending. Actually, countries that experienced successful structural change showed,
simultaneously and not surprisingly, increasing R&D expenditures. This is the typical case
of Finland and Southeast Asian countries. This twofold process of changing the
composition of the production structure and the raise in R&D expenditure stemmed, in
general, from the application of a set of long-term coordinated policies directed at the
accumulation of technological capabilities. Industrial and trade polices in Korea promoted
a gradual upgrading in domestic technological capabilities and in Finland subsidies to
technology intensive activities supported the structural change. In general, those countries
in their period of industrialization experimented a sort of selective State intervention that
fostered the reorientation of the production structure towards R&D intensive sectors (Kim,
1993; Ormala, 2001). Figure 4 shows a cross-country comparison between production
structure and R&D expenditure. Most Latin American countries are concentrated at the
bottom of the curve and are characterized by a low participation of R&D intensive sectors
and by a reduced R&D expenditure (around 0.5% of the GDP).
Figure 4. R&D Intensive Sectors and R&D (Percentages)
Finland USA
Korea Singapore
Taiwan
Australia Norway Malaysia
Peru UruguayChile
Argentina India Brazil Philippines
Mexico
Colombia
y = 13.0Ln(x) + 40.6 R2 = 0.56 0.0
20.0 40.0 60.0 80.0
0.0 0.5 1.0 1.5 2.0 2.5 3.0 3.5 R&D/GDP1996-2002
(Percentajes)
R
&
D
in
te
n
siv
e
s
e
c
to
r
(P
er
cent
a
ges)
Source: Own elaboration based on Annex 2.
3
Trade and growth: the reinforcement of international
specialization
Obviously the kind of international specialization is not independent from the
characteristics of the production structure and the technological capabilities. The open
economy setting on the one hand, favored the dynamics in the production structure
presented in the previous section and on the other hand, induced the reinforcement of Latin
one proper of the Mexican Gulf and the other specific to Southern Cone. Mexico and
Central American countries integrated their manufacturing and assembly activities into
global chains, basically offering to Northern economies cheap labor (ECLAC, 2002;
Cimoli and Correa, 2005; Mortimore and Peres, 2001; Reinhardt and Peres, 2000). On the
other hand, Southern Cone countries (like Argentina, Brazil, Chile and Uruguay)
reinforced their specialization in natural resources and standardized commodities. Plants in
these industries are now highly capital-intensive but produce scant domestic value added.
Changes in the dynamism of international specialization can be described by the
evolution of the Adaptability Index (see Annex 2). When this index is greater than one the
participation of dynamic products (in international markets) exceeds the participation of
stagnant products (sectors whose international demand grows at lower rates than the world
average). A virtuous international specialization usually implies an increase in the
Adaptability Index through time.
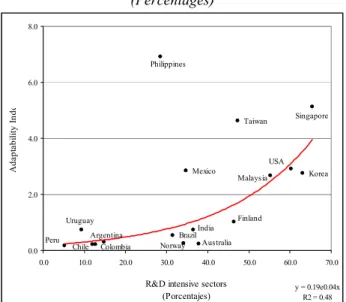
Figure 5 shows the relation between the participation of R&D intensive sectors
and the Adaptability Index. Countries specialized in technology intensive sectors show
higher values of the Adaptability Index (Southeast Asia and the US), whereas those
specialized in segments of medium and low technological activities are characterized by a
reduced index value (like Latin America excluding Mexico due to the maquila industries).
In this respect, let us compare the peculiar cases of Mexico and the Philippines with Korea
and Malaysia.
Figure 5. R&D Intensive Sectors and Adaptability Index
(Percentages)
Argentina Chile Colombia Peru
Uruguay
Australia Norway
India Brazil
Finland Mexico Philippines
Taiwan
USA Korea Malaysia
Singapore
y = 0.19e0.04x R2 = 0.48 0.0
2.0 4.0 6.0 8.0
0.0 10.0 20.0 30.0 40.0 50.0 60.0 70.0 R&D intensive sectors
(Porcentajes)
A
d
a
p
ta
b
ili
ty
I
n
d
e
Source: Own elaboration based on Annex 2.
Mexico, Malaysia and Korea show similar adaptability indexes, but they differ in
manufacturing value added is higher in Korea and Malaysia than in Mexico. We can argue
that the Mexican adaptability is explained by exports originated from assembling activities
that require low R&D expenditures and that generate weak spillovers effects. Capdevielle
(2005) indicates that in Mexico the maquila industry has neither increased its productivity
nor displayed strong linkages with the rest of the economy; in fact an increasing
integration with international market does not imply increasing dynamism in all
technological activties20. Conversely, in Korea and Malaysia the most dynamic exporting
sectors are those with the highest share in total manufacturing value added, thus revealing
stronger linkages between exports and domestic production.
Australia and Norway are other two peculiar cases. These countries show low
adaptability but high R&D expenditures in terms of GDP. Their scant adaptability suggests
that R&D expenditures have reinforced the external insertion in natural resource intensive
sectors, which in general tend to be less dynamic. Philippines, in turn, stands out as a
singular case due to the high degree of adaptability and the reduced participation of R&D
intensive sectors in the production structure (28,5%). As in Mexico, the increase in the
share of R&D intensive activities derives from FDI and assembly activities. These
differences in countries’ performances may help to identify different typologies of
international specialization, according to the participation of natural resource intensive
activities in total exports and R&D efforts.
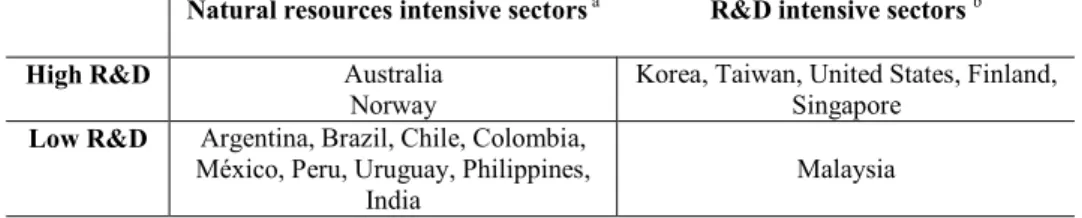
Table 4. Trade and growth: a typology based on factors endowment or technological capabilities: A typology
Natural resources intensive sectors a R&D intensive sectors b High R&D Australia
Norway
Korea, Taiwan, United States, Finland, Singapore
Low R&D Argentina, Brazil, Chile, Colombia, México, Peru, Uruguay, Philippines,
India
Malaysia
Source: own elaboration.
a Principal industrial activities in these countries are natural resources intensive, see Annex 2. b
Principal industrial activities in these countries are R&D intensive, see Annex 2.
According to international specialization patterns and technological efforts
countries can be classified in terms of two basic types of growth strategies. The first one is
based on taking advantage of the economic rents conferred by a privileged access to
abundant factors of production, namely cheap labor or natural resources endowment.
Countries that follow this strategy will tend to concentrate their efforts in maintaining or
20 Ciarli and Giuliani (2005) reach to similar conclusion for the case of Costa Rica. The diversification of exports
extending their participation in natural resources intensive sectors. In some cases,
especially when natural resources are abundant but labor is scarce, significant
technological efforts may be required to boost labor productivity. Some production
linkages can arise spontaneously, but if those countries fail to actively encourage structural
change it is likely that their specialization pattern will not automatically create the
incentives to to shift towards more sophisticated technological production stages and
activities.
The second type of strategy is based on trying to extract rents from knowledge,
which must be continuously recreated as new paradigms arise and/or imitators gradually
erode the dominant position reached by the innovator. Dynamic competitive advantages
predominate in this type of strategy, as described by Schumpeter. Although the initial
advantage can be based on some abundant factor, structural changes in the production
system is continuous and it pushes for an increasing participation of R&D intensive
activities within manufacturing.
In the ling term, the strategy based on fostering R&D intensive sectors induces
higher rates of growth than the strategy of creating economic rents out of the relative
abundance of natural resources or cheap labor. However, if a country benefits from natural
resource abundance, this does not necessarily implies that the dutch disease or any other
“natural resources curse” will affect it.
Societies face different options and they can choose between a set of possible
growth trajectories. This choice– which has to do with complex variables related to
institutions and political economy and their interplay with the economic structure and the
dynamics of technological progress at each point in time - is more important in the long
term than initial endowments. Abundance of resources can sustain growth without
significant efforts for learning during a certain period, but in the long term economic rents
derived from these resources tend to be eroded. Growth is sustainable only if backward
and forward linkages are created, as it was anticipated by Hirsmann (1977) and by the
“staples theory”, and if the initial advantage is used to build up technological advantages.
4 Conclusions
A North-South Ricardian growth model in which the specialization pattern depends on the
technological gap is an interesting framework for discussing convergence and divergence
between central and peripheral countries. Convergence requires deep and well-built local
efforts to foster learning and the development of technological capabilities in the South.
This strengthening of National Innovation Systems aims at reducing the technological gap
and diversifying the export structure towards more dynamic secors in terms of
technological paradigms and demand growth. Assuming that comparative advantages are a
and catching-up in the South, the model lead to a set of results that are consistent with the
Schumpeterian hypothesis that links growth to technological capabilities. And consistency
extends also to the Keynesian (demand based) perspective in which growth requires the
transformation of the specialization pattern in order to ease the balance of payments
constraint.
Learning and innovation reshape international competitiveness and allow
countries to exploit the opportunities of international trade and growth. Moreover,
technological efforts are mediated by the transformation of the production structure. A
structural change that promotes sectors that create and diffuse technology allows to capture
the opportunities of international demand dynamism. Convergence requires that the
economies are able to transform their production structure, and look for rents generated by
knowledge and learning activities. In that transformation, R&D intensive sectors must
reach an increasing weight in the industry being a source of externalities and spillovers.
The existence of abundant natural resources or cheap labor can sustain high rates
of growth during a certain period without requiring high R&D investments. However,
changes in the international economy and demand patterns are likely to expose countries
pursuing this strategy to vulnerabilities, because, in the long term, this behavior reduces
the structural capacities of capturing the opportunities of technological progress. Actually,
rents derived from knowledge, which are cumulative by nature, can be continuously
re-created, redefining the conditions for allowing entrance in new markets. On the other hand,
when rents are purely based on the relative abundance of resources, the capacities to
induce or respond to shocks and changes is reduced, since the country basically lacks the
technological capabilities necessary to readapt the production system to changing contexts.
References
Abramovitz, M. (1986), “Catching Up, Forging Ahead and Falling Behind”, Journal of Economic History; 46 (2); 385- 406.
Abramovitz, M. and David, P. A., (2001), “Two Centuries of American Macroeconomic Growth: From Exploitation of Resource Abundance to Knowledge Driven Development”, SIEPR Discussion Paper no. 01-05.
Archibugi, D. and Coco, A. (2004), “A New Indicator of Technological Capabilities for Developed and Developing Countries”, World Development; 32 (4); 629 -654. Aghion, P. and Howitt, P. (1998), Endogenous growth theory. MIT University Press. Barro, R. and Sala-i-Martin, X., (1994) Economic Growth, New York: McGraw-Hill. Capdevielle, M. (2005), “Globalización, Especialización y Heterogeneidad Estructural en
México”, in Heterogeidad Estructural, Asimetrías Tecnológicas y Crecmiento en América Latina, M Cimoli (ed), Inter-American Development Bank and ECLAC, December.
Ciarli, T. and E. Giuliani (2005), “Inversión Extranjera Directa y Encadenamientos Productivos en Costa Rica”, in Heterogeneidad Estructural, Asimetrías Tecnológicas y Crecmiento en América Latina, M Cimoli (ed), Inter-American Development Bank and ECLAC, December.
Cimoli, M. and Katz, J. (2002), “Structural Reforms, Technological Gaps and Economic Development: A Latin American Perspective”, Serie Desarrollo Productivo n. 129, ECLAC, Santiago Chile.
Cimoli, M. and Dosi, G. (1995), “Technological Paradigms, Patterns of Learning and Development: an Introductory Roadmap”, Journal of Evolutionary Economics, 5 (3), 242-268.
Cimoli, M. (1988), “Technological Gaps and Institutional Asymmetries in a North-South Model with a Continuum of Goods”, Metroeconomica; 39; 245 - 274.
Dalum, B., Laursen, K. and Verspagen, B. (1999) “Does Specialization Matter for Growth?” Industrial and Corporate Change, Vol. 8, No. 2.
Dornbusch, R.; Fisher, S. and Samuelson, P. (1977), “Comparative Advantage, Trade and Payments in a Ricardian Model With a Continuum of Goods”, American Economic Review; 67, 823 - 839.
Dosi, G., K. Pavitt and Soete, L. (1990), The Economic of Technical Change and International Trade, London and New York, Harvester Wheatsheaf Press/New York University Press.
Easterly, W. (2001) “The Lost Decades: Developing Countries’ Stagnation In Spite of Policy Reform, 1980-1998”, Working Paper, World Bank, February.
ECLAC (Economic Commission for Latin America and the Caribbean) (2002), Globalization and Development, (LC/G.2157(SES.29/3)), Santiago, Chile.
Fagerberg, J. (1994), “Technology and International Differences in Growth Rates”, Journal of Economic Literature, 32, 1147- 1175.
Fagerberg, J. (1988), “International Competitiveness”, Economic Journal; 98; 355 - 374. Ferraz, J., D. Kupfer and Iootty, M. (2004), “Industrial Competitiveness in Brazil”, ECLAC
Review 82, pp. 91-117.
Freeman, C., (1987), “Technology Policy and Economic Performance: Lessons From Japan”, Pinter Publisher, London
Freeman, Christopher (1963), “The Plastic Industry: a Comparative Study of Research and Innovation”, National Institute Economic Review, Nº 26.
Grossman, G. and Helpman, E. (1992), Innovation and growth in the global economy. MIT University Press.
Hausmann, R. and Rodrik, D. (2005), “It is Not How Much But What You Export That Matters”, Working Paper, John F. Kennedy School of Government, Harvard University, November.
Hirsch, S. (1965), “The US Electronics Industry in International Trade”, National Institute Economic Review, Nº 34.
Hirschman A. (1977) “Generalized Linkage Approach to Development, With Special Reference to Staples,” in Nash M. (ed.), Essays on Economic Development and Cultural Change in Honor of B. F. Hoselitz, University of Chicago press.
Katz, J. (2000), “The Dynamics of Technological Learning during the Import-Substitution Period and Recent Structural Changes in the Industrial Sector of Argentina, Brazil and Mexico”, in L.Kim and R. Nelson, Technology, Learning and Innovation: Experiences of Newly Industrialized Economies, Cambridge University Press.
Kim, L. (1993), “National System of Industrial Innovation: Dynamics of Capability Building in Korea”, National Innovation System, Richard Nelson (comp.), Oxford University Press.
Krugman, P. (1994), “Competitiveness: a Dangerous Obsession”, Foreign Affairs, vol. 73, n.2.
Krugman, P. (1991) “Increasing Returns and Economic Geography”, Journal of Political Economy, 99, pp. 483-499.
McCombie, J.S.L and Thirlwall A. (1994), Economic Growth and the Balance of Payments Constraint. New York: St. Martin Press.
Mortimore, M. and Vergara, S. (2003), “Nuevas Estrategias de Empresas Transnacionales, el caso de México en el Contexto Global”, in Perspectivas y Retos de la Competitividad en México, E. Dussels (ed.), UNAM and CANACINTRA, 970-32-1350-2.
Narula, R. (2004), “Understanding Absorptive Capacities in an Innovation Systems Context: Consequences for Economic and Employment Growth”, DRUID Working Paper n. 04-02, December, 2004.
Nelson, R. (ed) (1993), National Systems of Innovation, Oxford University Press.
Nelson, R. and Pack, H. (1999), “The Asian Miracle and Modern Growth Theory”, The Economic Journal, 109, 416-436, Royal economic society, Blackwell Publishers. Nelson, R. and Phelps, E. (1966), “Investments in Human, Technological Diffusion and
Economic Growth”, American Economic Review; 61; 69-75.
Obstfeld, M. and Rogoff, K. Foundations of International Macroeconomics. MIT Press, 1996.
Ormala, E. (2001), “Science, Technology and Innovation Policy in Finland”, in P. Paredo and P. Mustar (eds), Research and Innovation Policy in the Global Economy, Edgard Elgar, London.
Peneder, M. (2002) “Tracing Empirical Trails of Schumpeterian Development”, Papers on Economics and Evolution, Max Planck Institute for Research in Economic Systems, Viena.
Posner, M.V. (1961), “International Trade and Technological Change”, Oxford Economic Paper, vol. 13.
Prebish, R., (1950), The Economic Development of Latin America and its Principal Problems, New York, United Nations
Prebisch, R. (1981), Capitalismo Periférico: Crisis y Transformación. México, Fondo de Cultura Económica.
Ray, D. (2000) “What’s New in Development Economics?”, New York University, January, mimeo.
Ray, D. (1998) Development Economics. Princeton University Press.
Reinhardt, N. and Peres, W. (2000), “Latin America’s new economic model: micro responses and economic restructuring”, World Development, 28(9).
Rodríguez, O. (1981) La Teoría del Subdesarrollo de la CEPAL. México: Siglo XXI. Rodríguez, F. and Rodrik, D. (2001), “Trade Policy and Economic Growth: A Skeptics’
Guide to Cross-National Evidence”, in Bernanke, B. and Rogoff, K. (ed) Macroeconomics Annual 2000. MIT Press.
Ros, J. (2000) Development Theory and the Economics of Growth. Michigan University Press.
Sah, R.K. and Stiglitz, J.E. (1988), “Technological Learning, Social Learning and Technological Change”, paper presented to the World Congress of the International Economic Association, New Delhi, December.
UNCTAD Trade and Development Report 2003: Capital Accumulation, Growth and Structural Change. New York and Geneva: United Nations; 2003.
Vernon, R. (1966), “International Investment and International Trade in the Product Cycle”, Quarterly Journal of Economics, vol. 80.
Verspagen, B. (1993), Uneven Growth Between Interdependent Economies. Avebury: Aldershot.