The Beta Cell in Its Cluster: Stochastic Graphs
of Beta Cell Connectivity in the Islets of
Langerhans
Deborah A. Striegel1, Manami Hara2, Vipul Periwal1*
1Laboratory of Biological Modeling, National Institute of Diabetes and Digestive and Kidney Diseases, National Institutes of Health, Bethesda, Maryland, United States of America,2Department of Medicine, University of Chicago, Chicago, Illinois, United States of America
Abstract
Pancreatic islets of Langerhans consist of endocrine cells, primarilyα,βandδcells, which secrete glucagon, insulin, and somatostatin, respectively, to regulate plasma glucose.β cells form irregular locally connected clusters within islets that act in concert to secrete insu-lin upon glucose stimulation. Due to the central functional significance of this local connec-tivity in the placement ofβcells in an islet, it is important to characterize it quantitatively. However, quantification of the seemingly stochastic cytoarchitecture ofβcells in an islet requires mathematical methods that can capture topological connectivity in the entireβ-cell population in an islet. Graph theory provides such a framework. Using large-scale imaging data for thousands of islets containing hundreds of thousands of cells in human organ donor pancreata, we show that quantitative graph characteristics differ between control and type 2 diabetic islets. Further insight into the processes that shape and maintain this archi-tecture is obtained by formulating a stochastic theory ofβ-cell rearrangement in whole islets, just as the normal equilibrium distribution of the Ornstein-Uhlenbeck process can be viewed as the result of the interplay between a random walk and a linear restoring force. Requiring that rearrangements maintain the observed quantitative topological graph characteristics strongly constrained possible processes. Our results suggest thatβ-cell rearrangement is dependent on its connectivity in order to maintain an optimal cluster size in both normal and T2D islets.
Author Summary
High or low blood glucose levels are detrimental to human health. The hormone-secreting cells primarily responsible for maintaining glucose at physiologically appropriate levels are embedded in small clusters within the pancreas, the so-called islets of Langerhans. These islets have an irregular arrangement of cells,βcells that secrete insulin,αcells that secrete glucagon, and other cells with less well-understood functions. While the arrangement ofβ
cells is irregular, these cells need to be touching for the islet to respond to glucose with a11111
OPEN ACCESS
Citation:Striegel DA, Hara M, Periwal V (2015) The Beta Cell in Its Cluster: Stochastic Graphs of Beta Cell Connectivity in the Islets of Langerhans. PLoS Comput Biol 11(8): e1004423. doi:10.1371/journal. pcbi.1004423
Editor:Morten Gram Pedersen, University of Padua, ITALY
Received:December 8, 2014
Accepted:July 2, 2015
Published:August 12, 2015
Copyright:This is an open access article, free of all copyright, and may be freely reproduced, distributed, transmitted, modified, built upon, or otherwise used by anyone for any lawful purpose. The work is made available under theCreative Commons CC0public domain dedication.
Data Availability Statement:All relevant data are within the paper and its Supporting Information files.
Funding:This work was supported by Intramural Research Program of the National Institutes of Health, NIDDK. The funders had no role in study design, data collection and analysis, decision to publish, or preparation of the manuscript.
insulin secretion. We first use a mathematical formalism called graph theory to show that cell arrangements in islets from diabetic and control donors are significantly different. The question we then address is: Is there some set of moves of islet cells that will preserve the observed arrangement? The aim is to gain insight into the biological processes by which islets are formed and maintained. We find moves onβ-cell graphs that leave the same sig-nificant aspects of cell arrangements unchanged. These moves turn out to be severely restricted, and suggest thatβcells may prefer to move from larger clusters but can move to a cluster of any size, possibly to maximize their exposure to blood vessels.
Introduction
Pancreatic islets of Langerhans make up 2% of the average pancreatic mass (or 0.000028% of human body mass), yet contribute significantly to the regulation of blood glucose levels. These micro-organs consist primarily ofα,β, andδcells that produce the hormones glucagon, insu-lin, and somatostatin, respectively.
β-βcell contacts are necessary for proper islet function [1–3]. Their electrical coupling allows for the synchronization of intercellular [Ca2+] oscillations which results in pulsatile insulin release upon glucose stimulation [4–8] and increases insulin production two-fold as compared to isolatedβcells [9] (which show partial recovery in insulin production after reag-gregation [10]). This coupling is dependent on Connexin36 (Cx36) gap junction channels [11,
12] since Cx36-deficient mice show altered insulin pulse dynamics and glucose intolerance [13]. Prediabetic mice display impaired Cx36 coupling [14] suggesting a possible role in the progression to T2D. In humans,βcells contain Cx36 gap junctions and levels of Cx36 mRNA correlate with insulin expression [15]. However, Cx36 knockdown reduces incretin-stimulated, but not glucose-stimulated, insulin secretion [16] suggesting the importance of Cx36 may be not through glucose response but through the response to incretins which itself is disrupted by lipotoxicity. Interestingly, the upregulation of Cx36 occurs in unison with the main wave ofβ -cell differentiation [17], further illustrating the possible dependence ofβ-cell function on gap junction coupling. It has also been shown that Cx36 protectsβcells from apoptosis under cell injury [18] in mice.
Human islets have a unique cytoarchitecture with direct consequences on islet function [19]. The islet’s cytoarchitecture creates the anatomical basis for functional coupling betweenβ
cells [20]. However, what is the correct architecture for optimal function of pancreatic islet cells? Qualitatively, this arrangement is non-random [21] and species-dependent [19,22], with rodent islets displaying aβ-cell core surrounded by anα-δmantle and human islets varying in arrangement in a size-dependent manner [21,23,24]. Smaller human islets (effective
diameter<60μm) consist of an inner core ofβcells surrounded by anα- andδ-cell mantle (similar to rodents), whereas in larger islets,αandδcells are also found within the core possi-bly due to fusion of subunits [25] or lobules [26] consisting of the mantle-core architecture arranged around penetrating blood vessels [26,27].
Street et al. [38] found that nestin-positive cells in adult human islets were not colocalized with insulin positive cells suggesting nestin is not expressed in the mature humanβcell. With T2D, this initial increase is followed byβ-cell mass loss [36] and functional failure believed to be from glucolipotoxicity [14]. Inflammation also affectsβ-cell mass whereby low concentrations of interleukin-1β(IL-1β) promoteβ-cell function and prolonged high glucose exposure increases IL-1βwhich, in turn, increases Fas-mediated apoptosis [39].
β-cell migration is also suggested to occur, most notably during islet development but has also been shown in the adult pancreas. Cole et al. [40] demonstrated that individual humanβ
cells, previously suggested by [41], and large aggregates of cells can form within the ductal epi-thelium and migrate during gestation. They also found Vimentin (a mesenchymal protein) positive adult humanβcells suggesting that adultβcells are capable of remodeling. Recently it was shown that loss of Fbw7 induces pancreatic ductal stem cells to proliferate into endocrine cells in the adult human pancreas [42], with evidence for subsequent migration into islets. Note that the coordinated activation of genes essential for endocrine cell proliferation, migra-tion, vasculogenesis and hormone secretion has been demonstrated [43]. Thus, overall, the processes that govern humanβ-cell mass maintenance are not well understood. Supporting evi-dence for any specific process gleaned from rodent models must be considered in the context of possible structural differences between rodent and human islets.
The governing principle determining the optimal arrangement of cells in the healthy and T2D individual is a mystery. Further, there are observed architectural differences in T2D that may contribute to its progression [44], such asβ-cell mass loss preferentially in large islets [21], hypertrophy inβcells [45], and amyloid plaque formation in islets [46,47]. How these archi-tectural changes affect the organization ofβcells and their function remains unknown.
Given observations of the results of stochastic development and maintenance processes, there are two basic ways in which one can analyze these processes quantitatively. To set the stage for our isletβ-cell analysis, let us consider a hypothetical dataset consisting of a sample of real num-bers drawn from a one-dimensional normal distribution. The first standard approach is to make a histogram of the sample, and this histogram recapitulates an approximate normal distribution. A second approach is to consider the numbers as resulting from the equilibrium distribution of a stochastic Langevin process. In this approach, the same sample of normally-distributed random numbers leads us to the Ornstein-Uhlenbeck process with a random walk balancing a linear restoring force in the Langevin dynamics of each number, interpreted as the position of a particle on a line. These two approaches are equally valid views of the data, a static view and a stochastic view, and we shall apply them in turn to the study ofβ-cell arrangements in islets.
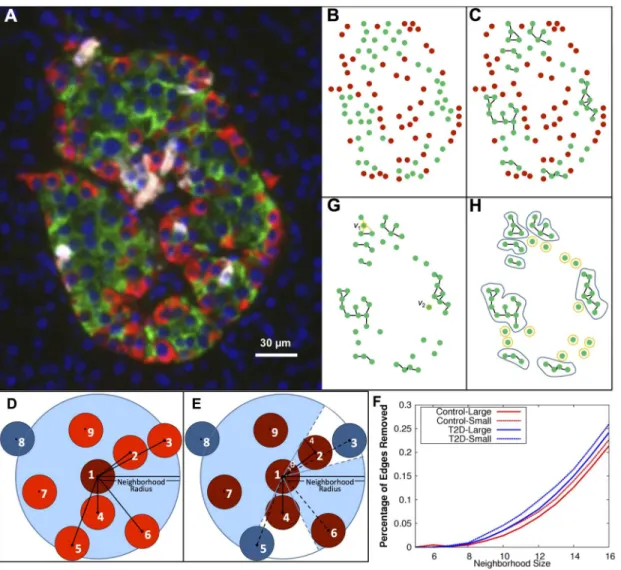
We propose that graph theory is an appropriate framework for quantifyingβ-cell arrange-ment because it captures quantitative aspects of connectivity flexibly. Graph theory has been used in many contexts in biology, in obvious contexts such as metabolic or regulatory net-works, and in more esoteric contexts such as functional MRI analysis [48] and tongue carci-noma prognostication [49]. Geometric graphs have been used to study protein-protein interaction networks [50]. With respect to islets, functional graphs representingβ-cell activity in individual mouse islets were created to analyze their small-world characteristics [10]. Images of islet sections show regularities in structure on casual inspection, but the significance of such regularities is difficult to ascertain without a mathematically sound framework for quantifying islet architecture. Here, we apply graph theory to the architecture of islets, and let the vertices of a graph consist ofβcells in each islet while the graph's edges represent intercellular connec-tivity (Fig 1A–1C). This geometric framework captures key architectural characteristics quanti-tatively in terms of graph-theoretic constructs, as we shall show.
two-dimensional sections of islets containing ~200,000 control and ~110,000 T2D cells. All graphs that we consider refer to this two-dimensional dataset, and we are cognizant of the limitations of working with two-dimensional sections of actual three-dimensional structures, the islets. We do address the differences between two-dimensional and three-dimensional graphs of islet cell arrangements by explicitly computing graphs in a smaller islet dataset that does have three-dimensional coordinates for every cell, showing that quantitative measures of these graphs are qualitatively similar. We show first, in the static view, that graph theory quantitative measures, such as mean connectivity ofβcells, size ofβ-cell clusters and number of clusters per islet, can distinguish between control and T2D islets. We then test, in the stochastic view, various models ofβ-cell degree- andβ-cell cluster size-dependent stochastic models of hypothetical graph rear-rangements to find possible topological constraints onβ-cell rearrangement processes. It is these theoretical relocation processes that are the analogs of the linear restoring force and the Fig 1.β-cell graphs were created from cells found in human organ donor pancreata and analyzed.The vertices of the graph represent the (x,y) coordinates of the cells (A,B). Forβ-cell graphs, vertices wereβcells and edges were added between cells within a given neighborhood radius (C). D,E. The neighbors of cells are determined using the shadow algorithm as described in the text, resulting in an increasing number of edges removed as the
neighborhood radius increases (F). G. Examples of the degree of cells whered(v1) = 3,d(v2) = 1. H. Example of the components of an islet. Nonsingular and
singular components are illustrated with blue and yellow loops, respectively.
random walk defining the normal distribution in the Ornstein-Uhlenbeck example above. To avoid confusion, we emphasize that in the absence of clear experimental evidence on the actual processes that maintain humanβcells, our use of verbs such as `move’is only a theoretical con-struction. The aim here is to use imaging data to pinpoint the precise mathematical equilibrium processes so that these mathematical constructs can be framed in terms of their contribution to the actual biological realizations, when the experimental data becomes unambiguous.
Materials and Methods
Human pancreatic specimens
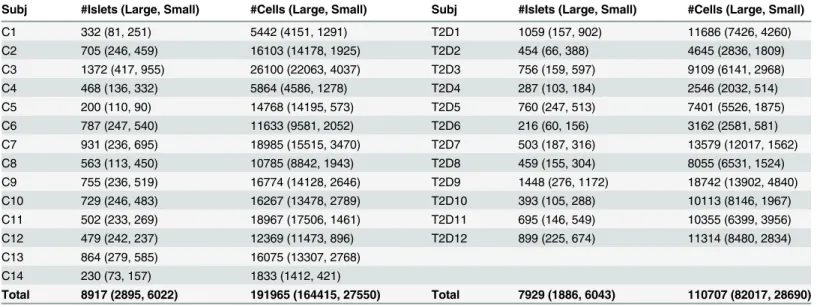
Twelve T2D and 14 non-diabetic (control) human organ donor specimens were collected and prepared as described in [21]. Briefly, a virtual slice was taken across each pancreatic specimen containing the head, body, and tail regions. This slice was then stained for insulin, glucagon, somatostatin, and DAPI. Tissue sections were imaged and two-dimensional (x,y) coordinates for each endocrine cell nucleus were recorded using a nucleus marker DAPI with identification of each cell type. The T2D group consisted of 4 males and 8 females ranging in age from 38–81. These subjects died of causes other than diabetes and it is assumed they were normoglycemic with ongoing treatment. The control group had 9 males and 5 females with ages ranging from 15–81. Further information about this dataset can be found in [21]. This dataset, after applying the described imaging method, produced location and cell-type information for ~200,000 cells found in ~9,000 control islets and ~110,000 cells found in ~8,000 T2D islets (Table 1) which was used for further analysis. The control and T2D datasets can be found inS1 Dataset.
Graph assignment
Here our focus is onβ-cell clusters so henceforth we consider onlyβcells as the vertices of the graph (Fig 1C). Edges betweenβcells, as determined by the nearest-neighbors of cells, describe the connectivity of theβ-cell cluster.
Table 1. Number of islets and cells per human cadaveric subject.For each control (C) and T2D subject the number of islets (number of large and small islets given in parentheses) and number of cells (number of cells located in large and small islets given in parentheses) are given.
Subj #Islets (Large, Small) #Cells (Large, Small) Subj #Islets (Large, Small) #Cells (Large, Small)
C1 332 (81, 251) 5442 (4151, 1291) T2D1 1059 (157, 902) 11686 (7426, 4260)
C2 705 (246, 459) 16103 (14178, 1925) T2D2 454 (66, 388) 4645 (2836, 1809)
C3 1372 (417, 955) 26100 (22063, 4037) T2D3 756 (159, 597) 9109 (6141, 2968)
C4 468 (136, 332) 5864 (4586, 1278) T2D4 287 (103, 184) 2546 (2032, 514)
C5 200 (110, 90) 14768 (14195, 573) T2D5 760 (247, 513) 7401 (5526, 1875)
C6 787 (247, 540) 11633 (9581, 2052) T2D6 216 (60, 156) 3162 (2581, 581)
C7 931 (236, 695) 18985 (15515, 3470) T2D7 503 (187, 316) 13579 (12017, 1562)
C8 563 (113, 450) 10785 (8842, 1943) T2D8 459 (155, 304) 8055 (6531, 1524)
C9 755 (236, 519) 16774 (14128, 2646) T2D9 1448 (276, 1172) 18742 (13902, 4840)
C10 729 (246, 483) 16267 (13478, 2789) T2D10 393 (105, 288) 10113 (8146, 1967)
C11 502 (233, 269) 18967 (17506, 1461) T2D11 695 (146, 549) 10355 (6399, 3956)
C12 479 (242, 237) 12369 (11473, 896) T2D12 899 (225, 674) 11314 (8480, 2834)
C13 864 (279, 585) 16075 (13307, 2768)
C14 230 (73, 157) 1833 (1412, 421)
Total 8917 (2895, 6022) 191965 (164415, 27550) Total 7929 (1886, 6043) 110707 (82017, 28690)
A cell has a non-zero radius. If we fix a neighborhood size (discussed in the next subsection), for a given cell, not every cell with a center in a neighborhood around this cell is a nearest-neighbor of the cell as not all nearby cells share a contact. The assignment of graphs to the posi-tion dataset must take this into account, so that only edges representing nearest-neighbor cell-cell contacts are added to the graph. A typical case is shown inFig 1D. To determine the neigh-bors of cell 1, we utilized a shadow algorithm, depicted inFig 1E, as follows: Neighboring cells were first sorted by distance, then as the sorted list of cells was traversed, edges were added to the graph only if the cell was not in a previous cell’s‘shadow’. The previous cell’s shadow angle, θ, was calculated byy¼tan 1 4
d , wheredis the distance to the previously added cell and the
radius of a cell is 4μm. In the example inFig 1D, cell 8 is not a neighbor since the distance between it and cell 1 is greater than the neighborhood radius. After sorting the remaining cells by their distance to cell 1, it is determined that cells 3 and 5 are in the shadow of cells 2 and 4, respectively. Therefore the neighbors of cell 1 are cells 2, 4, 6, 7, and 9 (Fig 1E). Between 2 and 6 percent of total edges are removed from aβ-cell graph of neighborhood radius of 10 microns by the shadow algorithm. This percentage increases with respect to an increase in neighbor-hood radius (Fig 1F). Graphs representing each control and T2D islet were computed. Differ-ences between large and small islets, where small islets are defined by an effective diameter of<60 microns, have been reported [23]. We will, therefore, analyze the large and small islet groups (defined by the 60 micron diameter) separately as well.
Neighborhood size from pair distribution functions
While graphs can be deduced with the shadow algorithm for any choice of neighborhood size, it is critical to use the data to determine a range of possible neighborhood sizes. To this end we calculated the pair distribution function,gðrÞdr¼IsletArea
2prN2
X
i
X
j6¼idðr rijÞwhereN
repre-sents the number of vertices,rijis the distance betweenviandvj, and
dðr r
ijÞ ¼
1 if r¼r
ij
0 otherwise (
. This function describes how the density of cells varies as a
func-tion of distance from a given reference cell.
We calculated the pair distribution function for eachβ-cell graph in the Control and T2D groups. The distributions for large and small islets were calculated separately, since architec-tural differences exist between them as previously shown in [21,23,24]. Bounding boxes of each islet were found and used for the islet area in the calculation. The pair distribution func-tion was then averaged for each radius over all islets in the control and T2D datasets.
We also examined the pair distribution functions for other cell types found in islets, namely
α-α,α-β,α-δ,β-δ, andδ-δ. For distributions of the same cell type, the formula above was used. For edges between vertices of mixed cell types (say, cell typesaandb), a different version ofg
(r) was used to capture the distribution ofbwith respect toa,gabðrÞdr¼
IsletArea
2prNaNb
XNa i¼1
XNb j¼1
dðr r
ijÞwhereNaandNbare the number ofaandbvertices, respectively.
Graph measures
measures: the mean degree of vertices, the mean number of components per graph, and the mean number of vertices per component.
The measures we consider (degree, component size and cells per component) are amongst the simplest numbers associated with a graph. We found (seeResults) that these were already biologically interesting as they could distinguish between T2D and normal islets. One measure we decided against using was the number of cliques, defined as a subgraph such that every ver-tex in the subgraph shares an edge with every other verver-tex in the subgraph. We found preserv-ing the number of cliques to be too strong a constraint to maintain with random
rearrangements.
Mean degree
The degree,dv, of vertexvis the number of edges containingvas a vertex (Fig 1G). For islet
graphs, this measures the number ofβcells in direct contact with a givenβcell. To definedv,
letE(a,b) = 1 ifeab, the edge between verticesaandb, exists andE(a,b) = 0 otherwise. Then
dva ¼
Xn
i¼1Eða;iÞwherenis the total number of vertices in the graph. Thus, the mean degree can be defined as1
N
XN
j¼1dvj¼
1
N
XN
j¼1
Xn
i¼1Eðj;iÞwhereNis the number of vertices in the dataset. For a given neighborhood radius, the degree of each cell of each islet was calculated and averaged together for the control and T2D groups.
Connected components and the mean number of cells per component
The second characteristic, the connected components, describes discrete clusters ofβcells. A component of a graph is a subset of vertices contained in the graph such that each vertex in the set shares an edge with at least one other vertex in the subset (Fig 1H). That is, if a closed curve can be drawn around a subset of a particular graph without crossing an edge, and this subset contains no other smaller subsets with this property, then the subset is a component. A compo-nent can also be singular, i.e. contain only one vertex, and thus describe loneβcells. In light of this, both the singular + nonsingular components and the nonsingular-only components, which representβ-cell clusters, were examined. For a given neighborhood radius, the compo-nents of each islet were found. The number of compocompo-nents per islet and number of cells per component for singular + nonsingular and nonsingular-only components were then averaged over the control and T2D groups for small, large, and all (small+large) islets.
Two-dimensional sections vs. three-dimensional volume: islet graph
quantification
randomized this dataset 10 times resulting in a three-dimensional dataset that was then used for a direct comparison between resulting graph measures in 3d and in 2d after simulated sectioning.
For the 3d case, graphs were created with specified edge type and neighborhood-sphere size. For 2d case, the dataset was sliced every 15 micron throughout the volume with respect to thez coordinate, i.e. the volume was sliced atz= 0, 15, 30,. . .. To examine the dependency of the placement of the slice, the starting point of the slicing was shifted by a certain number of microns i.e. the volume was sliced atz= 1, 16, 31,. . .for slice-start = 1, the volume was sliced atz= 2, 17, 32,. . .for slice-start = 2 and so on for slice-starts ranging between 0 and 14. For each slice, two-dimensional graphs were created where edges were created with specified edge type and neighborhood size (based solely on the (x,y) coordinates of the cells).
Stochastic process on graphs
To simulate stochastic graph-altering processes akin to the random walk and linear restoring force that define the Ornstein-Uhlenbeck process, we simulated vertex deletion and addition moves in each islet. We emphasize that these processes are a mathematical representation of all the developmental and homeostatic processes that resulted in the observed islet graphs. The question we focused on is: What possible graph stochastic processes would preserve the observed simple quantitative graph measures of such a set of islet graphs? Thus the deletion and addition moves do not represent actualβ-cell death and birth processes, which are well-known to be rare [28], but just as random steps and a linear restoring force with appropriate parameters will preserve the histogram of a sample of normal random numbers, we aimed to find graph dependencies for vertex addition and deletion moves that would preserve the observed distributions of graph measures.
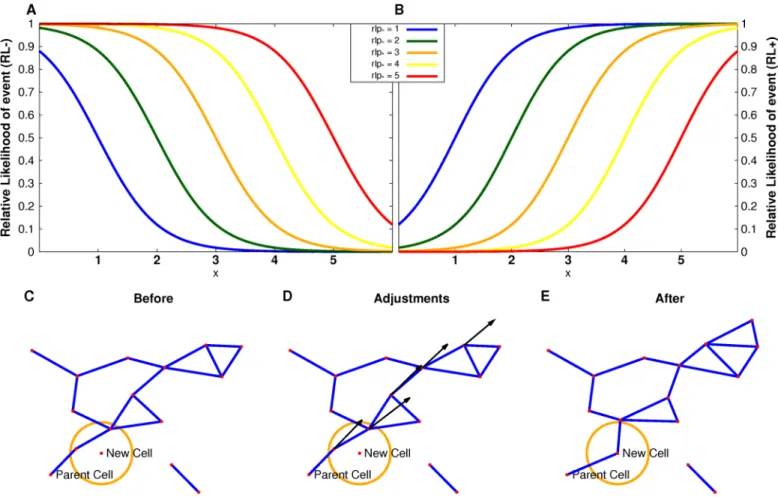
We considered two different classes of models depending on the dependencies of the vertex addition and deletion processes. Each model was characterized by relative likelihood (RL) func-tions chosen such that cells whose graph characteristics are either above (RL+) or below (RL-) a given parameter value have a higher likelihood of an event such as the theoretical addition of a cell in its vicinity or the theoretical deletion of that cell. The sigmoidal functions are
RLþ ¼0:5þ0:5tanhðx rlp
Þ ð1Þ
and
RL ¼0:5 0:5tanhðx rlp
Þ ð2Þ
wherexis the graph measure defining that class of models andrlpis the addition/deletion parameter value (Fig 2A and 2B). In general, stochastic simulations with hard transitions, as opposed to the sigmoidal functions defined here, will lead to artifacts. We tried to avoid such artifacts with the use of theRL+/-functions. In a deterministic process, such sharp transitions for where a cell can or cannot be placed would be required, as such sharp transitions would be part of the definition of the rules for such a process. There is no evidence for such determinism in any published experimental data.
We describe each class of model in turn. Each simulation has a givenRLfunction for the modeled addition (RLa) step with a given relative likelihood parameter (rlpa) and modeled
deletion (RLd) step with a given relative likelihood parameter (rlpd). We will introduce the
shorthand, M forRL-, P forRL+, a given (RLa,RLd) combination as [RLa] [RLd], and a given
simulation as [RLa][RLd][rlpa][rlpd] where [RLa] and [RLd] are eitherMorPand [rlpa] and
[rlpd] represent the given theoretical addition and deletion parameters. For example, MP01
Degree-dependent model
βcells receive cues from their environment and neighboring cells [1–3,6,10]. We hypothesized that the theoretical addition or deletion of a cell could be influenced by the number ofβ-cell contacts. Here we used the degree-dependentRLfunctions as described in Eqs1and2wherex represents the degree of the cell. Notice that forRL+, cells with larger degrees have a higher rel-ative likelihood than cells with smaller degrees of a given event (addition or deletion), whereas forRL-, the opposite holds.
(Fig 2A and 2B, wherexisdegandrlpisrlpaorrlpd). For combinations PP, PM, MP, and MM, 500 simulations consisting of 500 iterations of cell deletion and addition per graph for each combination ofrlpa= 0,. . .,7 (representing the observed degrees in the original
architec-ture) crossed withrlpd= 0,. . .,7 for each dataset (control large, control small, T2D large, and
T2D small islet graphs) were run. This totaled 512,000 simulations.
Fig 2. Details of Langevin model setup.Relative likelihood functions for a set of relative likelihood parameters (A,B). The functionRL−= 0.5−0.5*tanh(x −rlp*) forrlp*= 1. . .5 (A) describes the scenario where vertices with small component sizes or degrees have a higher relative likelihood of being selected for theoretical cell addition or deletion. Whereas, in the scenario with functionRL+ = 0.5+0.5*tanh(x−rlp*) forrlp*= 1. . .5 (B), vertices with large component sizes or degrees have a higher relative likelihood of being selected. Cell addition (C-E). C. The new cell was added in a random direction from the parent cell which results in two cells being within the given minimal distance of the new cell. D. These cells are moved radially outward from the parent cell. This move causes other cells to be within the given minimal distance and they are in turn moved outward. E. The resulting islet after the correction.
Component-dependent model
In vitro isolatedβcells are known to spontaneously re-aggregate into cluster-like structures [52]. It has also been shown thatβ-cell clusters are necessary for pulsatile glucose stimulated insulin response in vivo [6–8],[12],[53]. Finally, the proximity ofβcells to islet capillaries is essential for survival [54]. Greaterβ-cell distance from associated capillaries has been shown to result inβ-cell disappearance during islet transplantation [55]. Here we test to see if theoretical cell addition and/or cell deletion are influenced by component size. The addition (rlpa) and
deletion (rlpd) relative likelihood functions used were as described in Eqs1and2wherexnow
represents the size of a cell’s component. Notice that forRL+, cells existing within smaller com-ponents have a higher relative likelihood than cells within larger comcom-ponents of a given event (addition or deletion), whereas forRL-, the opposite holds.
For each combination of PP, PM, MP, and MM, 500 simulations consisting of 500 iterations of cell deletion and addition per graph for each combination ofrlpa= 1,. . .,5 (representing the
overwhelming majority of component sizes in the original architecture) crossed withrlpd=
1,. . .,5 for each dataset (control large, control small, T2D large, and T2D small islet graphs) were run. This totaled 200,000 simulations.
Vertex rearrangements
We implemented methods for stochastic changes to graphs consistent with the dataset. For each iteration, one vertex was deleted from and added to each graph based on a given probability function for the theoretical deletion and addition processes. We emphasize again that these are theoretical abstractions of cell rearrangements, not to be conflated withβ-cell birth and death. In particular, note that these theoretical processes are balanced in that they preserve cell number in each islet at each step in the simulation. Obviously no biologically valid birth and death simu-lation could coordinate the preservation of cell number. Such a rearrangement is not a trivial process because the islet graphs represent finite-sized cells with steric constraints, not idealized mathematical points. Particular care must be taken when aβ-cell is moved from one component in an islet to another, because there are geometric constraints that need to be preserved for the cell-cell contact interpretation of edges in the resulting graph. The process of removing a vertex from a graph is straightforward. However, adding a vertex to a graph can cause geometric com-plications, especially since there is a minimal distance between two vertices that needs to be maintained. The addition process used is: (i) for the chosen vertex,vparent, a new vertex,vnew, is
added at an angle chosen randomly from angles not occupied by a neighbor ofvparentand a
ran-dom distance between 8 and 13 microns; (ii) a‘frozen’list is created consisting ofvparentand
vnew; (iii) a‘problem’list is created consisting of vertices withindmindistance fromvnewwhere
dminis the minimal distance observed in the islet; (iv) for the first vertex on the‘problem’list,v1,
the closest vertex on the‘frozen’list,vc, is found andv1is moved radially fromvparenta given
dis-tance such that the new disdis-tance betweenv1andvcis betweendminand 10μm; (v) the vertices
withindminfromv1are added to the bottom of the‘problem’list; and (vi)v1is removed from
the‘problem’list and added to the‘frozen’list (vii) steps (iv) through (vi) are repeated withv1
representing the first vertex in the‘problem’list until it is empty. This algorithm intuitively envisions a propagating wave fromvparentin the direction ofvnewwhere vertices too close to
vneware moved outward, and vertices that are now too close to the just-moved vertices are
moved outward, and so on until the exterior vertices of the graph are reached (Fig 2C–2E).
Computation and statistics
simulations, this study utilized the high-performance computational capabilities of the Biowulf Linux cluster at the National Institutes of Health. The Mann-Whitney test, with a Bonferroni multiple comparison correction, was used for statistical tests.
To verify simulation convergence, the maximal standard deviation and maximal change in mean of each graph measure were calculated with the addition of each simulation. For simula-tioni, the standard deviations of simulations 1,. . .,iwere calculated for each (rlp
a,rlpd). The
maximal standard deviation is the maximum of these values and was found and plotted for
i= 1. . .n, wherenis the number of simulations. The change in mean was found with the
addi-tion of each simulaaddi-tion for each (rlpa,rlpd). The maximal change in mean is the maximum over
all (rlpa,rlpd). For convergence, asiapproachesnthe maximal standard deviation approaches a
constant and the maximal change in mean approaches zero.
Results
Islet and cellular composition
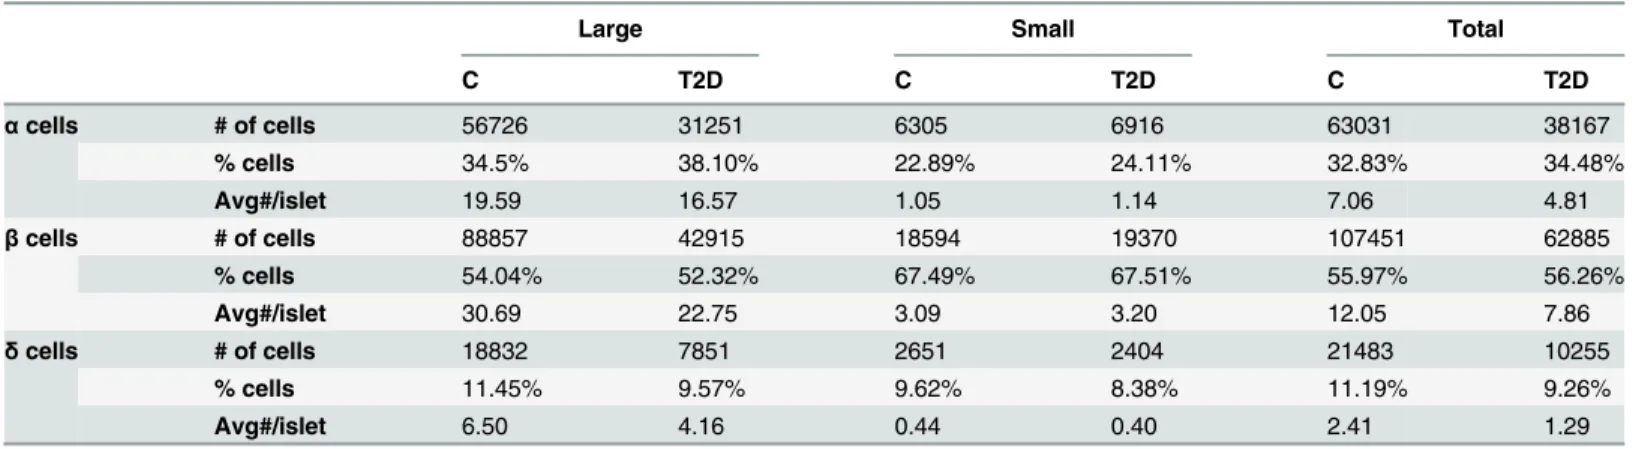
The number of islets obtained from each donor is given inTable 1, with the number of cells in large and small islets. We counted the number of endocrine cells of each type in large and small islets (Table 2). Notice the decrease in all cell types in large T2D islets as compared to control islets.
Neighborhood size
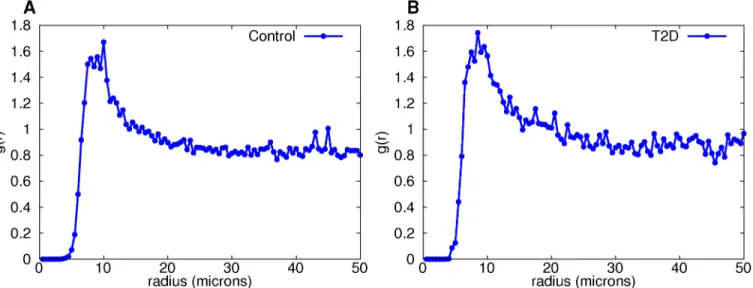
The pair distribution function showed a peak between 8 and 13 microns for all types of edges in large islets. Due to this, all measures were calculated for graphs with neighborhood radii between 8 and 13 (with radii 5–7 and 14–16 added for comparison).β-βedges are shown inFig 3with other edge types inS1–S3Figs. Small islet pair distribution functions do not show the expected asymptotic approach to 1, suggesting that there are not enough small islets for averag-ing over islets to produce stable results.
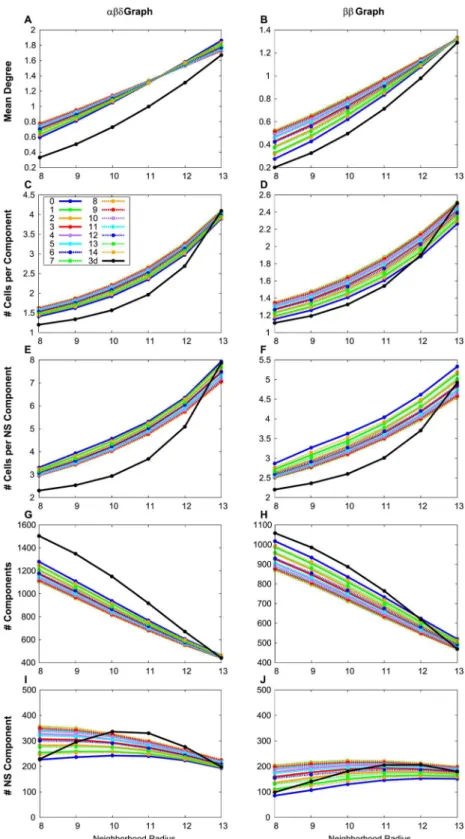
2d vs. 3d graph measures are qualitatively the same
We found that graph measures determined from 2d sections and 3d islet graphs are qualita-tively the same for any choice of neighborhood size (Fig 4). Conclusions drawn from 2d sec-tions should therefore be reflective of 3d differences. Of course, the significance of differences between T2D and normal sections has nothing to do with the 3d vs. 2d issue addressed here as any geometric difference would affect both types of sections alike.
Table 2. Quantifications of the number ofα,β, andδcells found in large and small islets for Control (C) and T2D islets.
Large Small Total
C T2D C T2D C T2D
αcells # of cells 56726 31251 6305 6916 63031 38167
% cells 34.5% 38.10% 22.89% 24.11% 32.83% 34.48%
Avg#/islet 19.59 16.57 1.05 1.14 7.06 4.81
βcells # of cells 88857 42915 18594 19370 107451 62885
% cells 54.04% 52.32% 67.49% 67.51% 55.97% 56.26%
Avg#/islet 30.69 22.75 3.09 3.20 12.05 7.86
δcells # of cells 18832 7851 2651 2404 21483 10255
% cells 11.45% 9.57% 9.62% 8.38% 11.19% 9.26%
Avg#/islet 6.50 4.16 0.44 0.40 2.41 1.29
Islet graph measures can distinguish T2D from normal islets
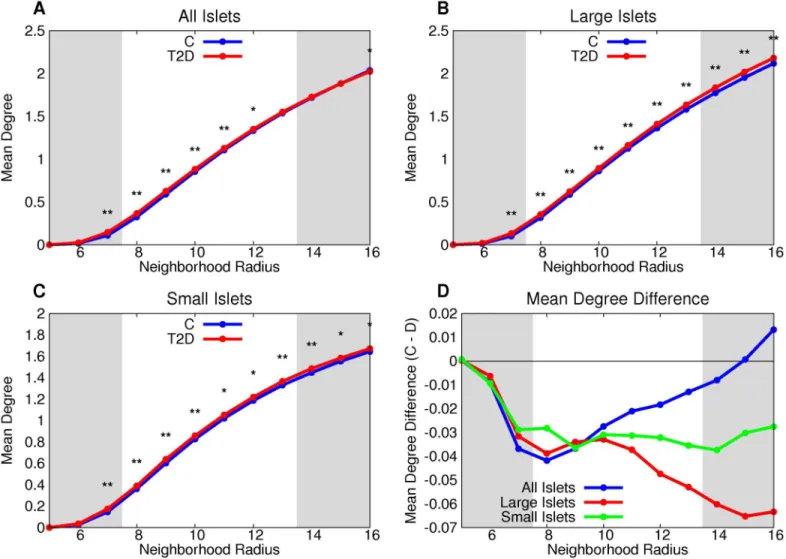
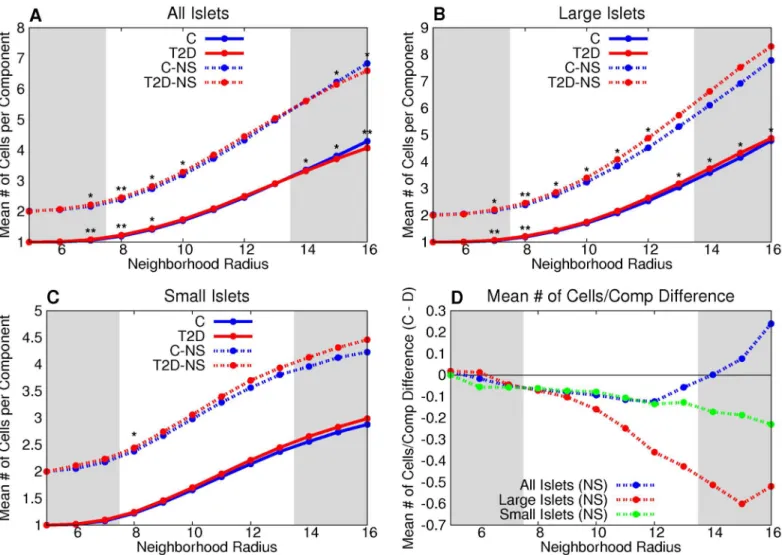
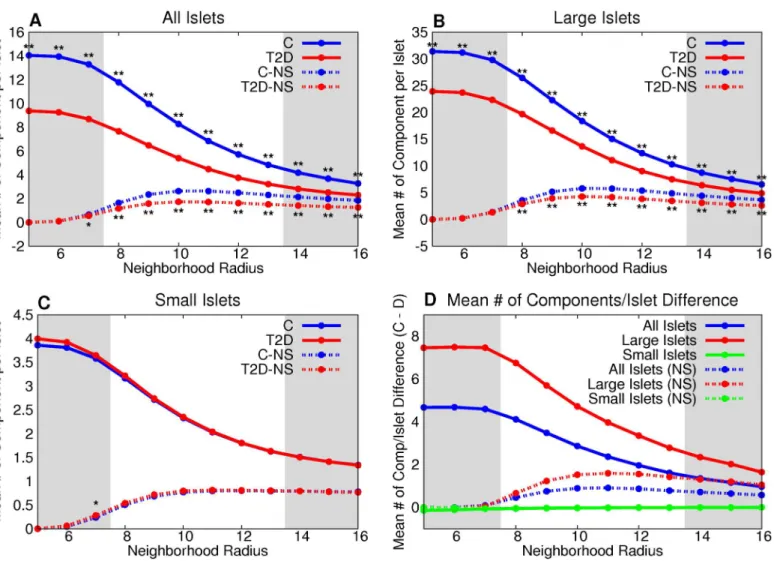
Both large and small T2D islets have a greater mean degree than control for all neighborhood radii (Fig 5). The number of vertices per non-singular component is greater in the T2D large-islet group than control for graphs of neighborhood radii between 7 and 12 microns (Fig 6). The difference between T2D and control was not statistically significant in small islets or the combination of small and large islets across the range of neighborhood radii (Fig 6A and 6C).
The number of components per graph is significantly lower in large islet graphs (Fig 7B) and when all islets are combined (Fig 7A) with T2D than the control group. There is no statisti-cally significant difference between the groups for small islets (Fig 7C). The size dependence and cumulative distributions of the three graph measures for all, large, and small islets, respec-tively, are shown inS4–S6Figs. The number of components per islet is significantly different between control and T2D groups even when comparing by subject (S4 Table, all measures were compared by subject inS1–S15Tables).
The differences in mean degree and number of components seen in T2D islets cannot be explained by the loss ofβcells alone (S7 Fig). The differences observed in T2D cannot be explained by age (S8 Fig). We also compared the number of components per islet with the mean degree of the islet controlling for the number of cells per islet. There was a statistically significant difference (P<0.0001) between the control and T2D group. Therefore, the decrease
in components observed in the T2D group as compared to the control group is not solely from the increase in mean degree. There is a difference in the mean degree and number of cells per component between large and small islets for the control and T2D datasets (S16 Table). How-ever, this difference is dependent on the neighborhood radius.
Stochastic graph component-dependent model on an individual islet
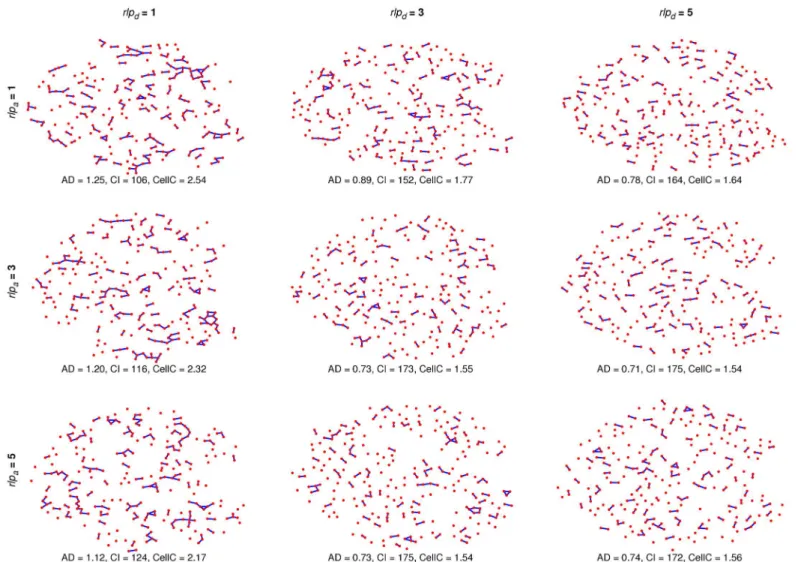
To see the effects of different parameter values, we ran the component-dependent MP model on an individual islet with the original graph measures given inFig 8. The resulting architec-tures are a mix of the islet containing varying numbers of large clusters (Fig 8,rlpd= 1) and
varying numbers of clusters consisting of only 2 or 3 cells (Fig 8,rlpd= 5). SeeS1–S4 Videosfor
Fig 3. Pair distribution functions for large-isletβ-cell graphs provide evidence that cell distances between 8 and 13 microns are non-random.The sole peak is clearly evident in the control (A) and diabetic (B) groups.
Fig 4. Comparison of measures between two-dimensional sections and a three-dimensional volume.
The mean degree (A,B), number of cells per component (C,D) and nonsingular component (E,F), and the number of components per graph (G,H) and nonsingular components per graph (I, J) were calculated for the three-dimensional volume and the two-dimensional sections with varying slice start values (different colors) as described in the text.
simulations of the component-dependent model using (rlpa,rlpd) = (3,1) for the PP, PM, MP,
and MM models, respectively.
Only some stochastic processes are consistent with the observed graph
measures
Table 3shows all the stochastic graph processes with parameter ranges in which they are con-sistent with the observed graph measures. Random theoretical addition and deletion processes do not preserve the graph measures found for the experimental data (S17 Table). There are two solutions possible for both degree-based and component-based models, for both normal and T2D islets. The solutions have different characteristics. The solutions that have precise parame-ter values are those in which cell deletion is more likely to occur from larger components (degrees) while cell addition is unconstrained by component size (degree). These solutions are termed MP solutions (Fig 9). The other solutions are PP solutions in which both cell deletion Fig 5. T2Dβcells have, on average, more neighbors than controlβcells.Both large (B) and small (C) T2D islets have a greater mean degree than control for all neighborhood radii. This is further emphasized by the difference between the two groups (D).*denotes p<0.05 between the control and T2D
groups,**denotes a statistically-significant difference after the Bonferroni correction (usingn= 32).
and cell addition have a range of correlated values (Fig 10). Notice that the cell deletion param-eter decreases as the cell addition paramparam-eter decreases, an intuitively natural compensation. These PP models (degree- or component-based) are therefore, mathematically-speaking, over-parametrized, but that is not a biologically valid reason for rejecting them.
We computed the correlation between mean degree and mean component size for each islet. We found that these are correlated (Fig 11F). Thus the degree-based and component-based solutions we found are qualitatively the same process.
All results for the component-based and degree-based models for small and large islets can be found inS9–S16Figs. The maximal mean difference and maximal standard deviation (cal-culated as described in Materials and Methods-Computation and Statistics subsection) for each model is given inS17–S24Figs, respectively.
Fig 6. T2Dβ-cell clusters in large islets have, on average, more cells than controlβ-cell clusters in large islets.The number of vertices per non-singular component is greater in the T2D large-islet group than the control for graphs of neighborhood radii between 7 and 12 microns (B). This is further emphasized by the difference between the two groups (D). The difference between T2D and control was not statistically significant in small islets or the combination of small and large islets across the range of neighborhood radii (A,C).*denotes p<0.05 between the control and T2D groups,**denotes a statistically-significant difference after the Bonferroni correction (usingn= 64).
Pair distribution functions are qualitatively unchanged only in equilibrium
solutions
Not only is it important for the resulting simulations to exhibit the original architecture’s mea-sures, but their edge distributions should be similar as well. For example, the pair distribution functions averaged over all degree-based simulations were calculated for measure-equilibrium models MP41 and PP42 and for non-measure-equilibrium model PM20 (Fig 11A–11C). The measure-equilibrium models show two joined peaks of varying heights between edge lengths 8 and 13, which correlates with the peak found in the pair distribution of control large islets. However, the PP model distribution has values greater than 1 for radii greater than 13, whereas the non-measure-equilibrium model distribution shows multiple peaks ranging from a dis-tance of 4 to 20, and then decays after 25 microns. To quantify the differences found when comparing the pair distribution functions for MP and PP simulations with the experimental pair distribution functions, we subtracted the difference for each radius for several MP and PP Fig 7. T2D large islets have fewerβ-cell clusters than control large islets.The number of components per graph is significantly lower in large islet graphs (B) and when all islets are combined (A) with T2D than the control group. This is further emphasized by the difference between the two groups (D). However there is no statistically significant difference between the groups for small islets (C).*denotes p<0.05 between the control and T2D groups,**denotes a
statistically-significant difference after the Bonferroni correction (usingn= 64).
measure-equilibrium solutions (averaged over 10 simulations each) (Fig 11D and 11E) and integrated the absolute value of the difference between radius 0 and radius 50 (Fig 11D and 11E, values in parentheses). There is a noticeable increase in the total difference for the PP models. There is also an increase in total difference for non-measure-equilibrium solutions, such as MPX2 and MPX3 (S25A and S25B Fig) where X = 0–7. This is most evident within the radial distance interval of 8 and 13 where the total difference for MPX2 averaged over X = 0–7 is 3.42 and for MPX3 is 3.96 as compared to the measure-equilibrium solution set, MPX1, which is 1.88. The model with the closest match to the pair distribution function found in the control and T2D (S25C Fig) data is MP01.
The distributions of clusters (components) and the distributions for mean degree and num-ber of cells per component for MP01 (MP02 and PP01, two other measure-equilibrium solu-tions, are given for comparison) simulations are given inS26 Fig. The experimentally observed distribution (S5 Fig) is qualitatively similar to that of the equilibrium solution MP01.
Fig 8. Effects of the component-dependentrlpdandrlpaon an individual islet.MP model simulations on an individual islet withrlpa= 1, 3, 5 crossed with
rlpd= 1, 3, 5 were run and the resulting architectures (and measures) are shown. The original architecture’s average degree (AD) is 1.21 with 119 (46
nonsingular, 73 singular) components (CI) and an average of 2.26 cells per component (CellC).
Discussion
Our main descriptive result is that T2D islets have (statistically significant) quantitative differ-ences compared to control with respect to their connectivity structure as quantified with basic graph theory measures. These subjects were being treated for T2D at the time of death, and dia-betes was not the cause of death in any case. It is likely that the usual natural history of T2D progression (initialβ-cell mass increase [31,32] followed byβ-cell mass loss [36] and func-tional loss from glucolipotoxicity [58] and inflammation [39]) has resulted in the differences we quantified. However, unlike animal models, it is not possible to attribute these changes solely to prolonged hyperglycemia and dyslipidemia.
It is striking that large T2D islets exhibit higher mean degrees, larger components but fewer components compared to control. Did the process of developing diabetes lead to the loss of cells that were not sufficiently connected, and the loss of components that were not large enough for the synergistic functional couplings betweenβcells needed to sustain them? Indeed, prolonged hyperglycemia, with concomitant higher demands for insulin secretion, leads to a decrease in Gjd2 expression (which codes for Connexin36 gap junction channels) in mice [59]. Further, Cx36 plays a protective role against apoptosis in the presence of toxins [18] suggesting
βcells with fewer connections have less apoptotic protection. A greater number of cells in tact could be a compensation for fewer gap junction channels between each pair of cells in con-tact, resulting in increased degree and cells per component.
Our central deductive result from the simulations of stochastic processes on islet architec-tures is that it is possible to find a stochastic process that maintains the graphical measures observed with a slight difference between parameters in T2D subjects compared to control. Table 3. Mean measure-equilibria for control and T2D, large and small islets. Ranges of equilibrium solutions, with respect torlpd, are given for the
degree (D), number of components per islet (Comp), and number of cells per component (Cell) for PP and MP. The measure equilibria given are the x-inter-cepts of quadratic interpolations of eachrlpacurve. The mean represents the mean value over all equilibria over all measures for each scenario. There were
no equilibrium solutions found for PM and MM.
Control Large Control Small T2D Large T2D Small
RLa RLd Measure
Range
Mean Measure
Range
Mean Measure
Range
Mean Measure
Range
Mean
Component–based Simulations
P P D 2.16–3.42 2.76 1.09–1.28 1.18 2.10–3.21 2.68 1.06–1.28 1.15
Comp 2.07–3.15 1.05–1.20 2.04–3.01 1.01–1.16
Cell 2.29–3.05 1.05–1.22 2.27–2.99 1.00–1.18
P M - - -
-M P D 1.79–1.93 1.89 0.85–0.91 0.90 1.70–1.84 1.82 0.78–0.85 0.81
Comp 1.79–1.97 0.91–0.95 1.73–1.92 0.82–0.87
Cell 1.94–2.11 0.90–0.93 1.89–2.06 0.77–0.82
M M - - -
-Degree-based Simulations P P D 1.21–2.11 1.95 0.003–0.45 0.26 1.18–1.97 1.83 -0.03–0.44 0.22
Comp 1.13–1.92 -0.02–0.32 1.09–1.76 -0.07–0.28
Cell 1.64–2.47 -0.07–0.36 1.61–2.33 -0.15–0.31
P M - - -
-M P D 0.75–1.06 1.05 -0.22–-0.07 -0.13 0.70–1.03 1.02 -0.30–-0.11 -0.21
Comp 0.78–1.00 -0.17–-0.07 0.73–0.97 -0.25–-0.13
Cell 1.06–1.42 -0.27–-0.13 1.01–1.41 -0.39–-0.22
M M - - -
Surprisingly, the data could rule out entire classes of stochastic rearrangement processes as implausible because of a failure to reproduce the observed architectures of islets for control and T2D. Our results indicate thatβcells are preferentially moved from largerβ-cell clusters while their destination clusters are picked randomly.
Fig 9. MP measure-equilibria for component- and degree-based simulations.The difference between the simulation and experimental measure values is plotted for each (rlpa,rlpd) combination (points on curves). Measure-equilibria (where measure difference between simulation and experimental is 0) were
found for different (rlpa,rlpd) values for the component-based model for the control (A-C) and T2D (D-F) large islet datasets and the degree-based model for
the control (G-I) and T2D (J-L) large islet datasets.
The idea here was not to examine changes in topology due to change inβ-cell mass, as that would require having information about the entire natural history of progression to T2D via insulin resistance. Such information would be very valuable but does not exist at this time. In addition, the specimens were obtained from T2D donors with unknown therapeutic
Fig 10. PP measure-equilibria for component- and degree-based simulations.The difference between the simulation and experimental measure values is plotted for each (rlpa,rlpd) combination (points on curves). Measure-equilibria (where measure difference between simulation and experimental is 0) were
found for different (rlpa,rlpd) values for the component-based model for the control (A-C) and T2D (D-F) large islet datasets and the degree-based model for
the control (G-I) and T2D (J-L) large islet datasets.
interventions, so the T2D dataset reflects possibly stable but inadequateβ-cell mass. Therefore, we took each dataset separately and found theoretical cellular rearrangement processes that conserved the topology of each dataset as determined by the three graph measures and the resulting pair distribution functions. The distribution of theoretical clusters was essentially unchanged under the stochastic rearrangement process.
One point of interest is that the structural line between T2D and normal islets appears to be fairly fine, i.e., the parameter difference between the stochastic process for T2D islets and that for control is small. Whether these differences are a reflection of the compensatory processes that took place during the stages of insulin resistance preceding the appearance of T2D, or are reflective of ongoing continuing pathological changes, cannot be ascertained from such donor data. Furthermore, the limited number of 3d islets that we had to test our qualitative similarity between 3d and 2d graph measure trends does not quantitatively guarantee that a future data-set with 3d structures analyzed with 3d graph measures will find the same significant difference between T2D and control 2d graph measures. In other words, we cannot preclude that 3d islet structures analyzed with 3d graph measures could conceivably find that T2D islets are not dis-tinct from control.
Our use of stochastic methods is motivated by two factors: (1) The exact processes of devel-opment and homeostasis in the human pancreas are unknown. Imposing a deterministic pro-cess would lead to many graph structures that might be artifacts of the simulation, as such a process would have to depend on many more parameters to detail how cells are placed depend-ing on cell vicinity at each step. We do not know of any extant dataset that could possibly be used to constrain such deterministic simulations, nor do we know any literature on experimen-tal results about in vivo endocrine development in the pancreas that could inform the design of an algorithm for deterministically re-arranging cells. (2) When we calculate pair distribution Fig 11. Analysis of simulation pair distribution functions.Average pair distribution functions for measure-equilibrium solutions MP41 (A) and PP42 (B) and non-measure-equilibrium solution PM20 (C). D and E. Difference between the given measure equilibrium solutions pair distributions and that of the original for given radii (cumulative total difference is given in parentheses for each parameter set). F. Mean component size versus mean degree of each control large islet.
functions from the experimental data, it is striking that there is no evidence of systematic higher order structures, as would be hard to avoid in a deterministic process. Thus, while we cannot conclude that the actual natural history of islet development in the pancreas is stochas-tic, there is no experimental evidence that the placement of cells within each islet is
deterministic.
The invariance of graphical measures turned out to be a constraint strong enough to deter-mine a unique set of stochastic graph rearrangement models. There was really only one true solution since degree- and component-models are related (Fig 11F) and MP01 fits the pair dis-tribution function best. This is a prediction that may be testable with lineage tracing techniques in animal models. Obviously, our mathematical formulation of cell rearrangements is not based on experimental data, but the equilibrium model pair distribution still captures the observed features of the pair distribution function observed in the data, and away from equilibrium, does not. This gives us some confidence that the mathematical formulation may not be too far from reality as it has been shown that endocrine cell proliferation and migration processes are not dis-joint [43]. Furthermore, when we repeated the analysis on 10% of the data, we found the same results as when we did the analysis on 100% of the data, with no change in parameters of the sto-chastic process. This can be interpreted as a 90% check on our initial 10% model.
Among the limitations of our analysis, the most important is the lack of information on vas-culature. The importance of vasculature in islets as endocrine organs needs no repetition. While it would be very interesting to carry out a more elaborate version of our simple graph theoretic simulations with data including vascularization, this would require a very large amount of 3d data as 2d sections are unlikely to capture the essential connectivity of capillaries [60].
Another limitation is that the donor characteristics available were not very detailed. With enough donor data at all age groups, it would be of great interest to follow the changes in graph measures with age, and ideally, with insulin resistance. That level of data may make it possible to consider independent addition and deletion processes to takeβ-cell number changes into account.
While we only addressed theβ-cell contacts in this work, the proximity ofαcells toβcells may be important for the suppression of glucagon secretion by insulin [61]. It would be inter-esting to carry out our analysis with graphs including all different endocrine cells as vertices. More data would probably be required to constrain such a model as there are many more pos-sible rearrangements that one would need to consider.
What might be the biological rationale for the MP01 model that is preferred by our theoreti-cal study? As we have no data on enervation and vascularization relative to the cell coordinates in the image dataset, we do not have a concrete basis for suggesting that some unknown func-tionally optimal amount of contact with neurons or capillaries is the cause. The functional char-acteristics of the sub-unit structures that Bonner-Weir and co-workers have suggested in islets [24] may provide a clue as to whyβ-cell migration may proceed from larger clusters to smaller.
A very challenging extension of this work would be to type 1 diabetes, where the auto-immune destruction of islets is an ongoing process. This would require donor data with dura-tion of disease besides more specific donor characteristics. The setup of stochastic simuladura-tions to take the duration of disease into account would require considerable thought, and there would likely be dependence on the age of the donor, besides the duration of disease.
Supporting Information
S1 Fig. Pair distribution functions forαα(A-D) andαβ(E-H) graphs in large and small
peaks above one, however when averaged together the averaged values are below one. The amplitude of the peak in the distribution of the large-isletαβgraph (E,G) is smaller than the large-isletααgraph (A,C). This could be fromβcells located in the interior of a cluster away fromαcells. The small isletsαβpair distribution shows numerous non-random peaks of differ-ent edge lengths (F,H).
(EPS)
S2 Fig. Pair distribution functions forαδ(A-D) andββ(E-H) graphs in large and small
control and T2D islets.The pair distribution functions of the large and smallαδgraphs show scattered non-random peaks (A-D). The sole non-random peak between 8 and 13 microns is clearly evident in theββlarge-islet graphs (E, G). However, this is not evident in the small islets (F,H).
(EPS)
S3 Fig. Pair distribution functions forβδ(A-D) andδδ(E-H) graphs in large and small
control and T2D islets.The averaged pair distribution functions of the largeβδcontrol graphs (A) shows a low amplitude peak between 8 and 13 microns, whereas the T2D graphs (C) show multiple low-amplitude peaks of varying edge lengths. The small-isletβδgraphs (B,D) show multiple non-random peaks of various edge lengths. The sole non-random peak between 8 and 13 microns is clearly evident in theδδlarge-islet graphs (E, G). However, this is not evident in the small islets (F,H).
(EPS)
S4 Fig. Distributions of measures for all islets, large islets and small islets for neighborhood radius 9 for the control and T2D groups.Cumulative distributions are represented by lines. (EPS)
S5 Fig. Distributions of measures for all islets, large islets and small islets for neighborhood radius 10 for the control and T2D groups.Cumulative distributions are represented by lines. (EPS)
S6 Fig. Distributions of measures for all islets, large islets and small islets for neighborhood radius 11 for the control and T2D groups.Cumulative distributions are represented by lines. (EPS)
S7 Fig. Differences observed in T2D measures cannot be explained by the decrease inβ
cells alone.The slopes of the linear regressions are statistically significantly different (P<0.0001) between the control and T2D groups for the mean degree (A) and number of components (B).
(EPS)
S8 Fig. Measure results for T2D subjects are not dependent on age. (EPS)
S9 Fig. Component-dependent simulation solutions for control large islets.The mean
mea-sure difference (simulation—original measure) for models PP (A-C), PM (D-F), MP (G-I), and MM (J-L) and parameter valuesrlpa= 1,. . .,5 crossed withrlpd= 1,. . .,5. Equilibrium solutions
(when difference is zero) are found for scenarios where vertices are removed from large com-ponents.
(EPS)
S10 Fig. Component-dependent simulation solutions for T2D large islets.The mean
MM (J-L) and parameter valuesrlpa= 1,. . .,5 crossed withrlpd= 1,. . .,5. Equilibrium solutions
(when difference is zero) are found for scenarios where vertices are removed from large com-ponents.
(EPS)
S11 Fig. Degree-dependent simulation solutions for control large islets.The mean measure
difference (simulation—original measure) for models PP (A-C), PM (D-F), MP (G-I), and MM (J-L) and parameter valuesrlpa= 0,. . .,7 crossed withrlpd= 0,. . .,7. Equilibrium solutions
(when difference is zero) are found for scenarios where vertices with large degree are removed. (EPS)
S12 Fig. Degree-dependent simulation solutions for T2D large islets.The mean measure
dif-ference (simulation—original measure) for models PP (A-C), PM (D-F), MP (G-I), and MM (J-L) and parameter valuesrlpa= 0,. . .,7 crossed withrlpd= 0,. . .,7. Measure equilibria (when
difference is zero) are found for scenarios where large-degreed vertices are removed. (EPS)
S13 Fig. Component-dependent simulation solutions for control small islets.The mean
measure difference (simulation—original measure) for models PP (A-C), PM (D-F), MP (G-I), and MM (J-L) and parameter valuesrlpa= 1,. . .,5 crossed withrlpd= 1,. . .,5.
(EPS)
S14 Fig. Component-dependent simulation solutions for T2D small islets.The mean
mea-sure difference (simulation—original measure) for models PP (A-C), PM (D-F), MP (G-I), and MM (J-L) and parameter valuesrlpa= 1,. . .,5 crossed withrlpd= 1,. . .,5.
(EPS)
S15 Fig. Degree-dependent simulation solutions for control small islets.The mean measure
difference (simulation—original measure) for models PP (A-C), PM (D-F), MP (G-I), and MM (J-L) and parameter valuesrlpa= 0,. . .,7 crossed withrlpd= 0,. . .,7.
(EPS)
S16 Fig. Degree-dependent simulation solutions for T2D small islets.The mean measure
difference (simulation—original measure) for models PP (A-C), PM (D-F), MP (G-I), and MM (J-L) and parameter valuesrlpa= 0,. . .,7 crossed withrlpd= 0,. . .,7.
(EPS)
S17 Fig. Convergence measures for component-dependent simulations for control large islets (S9 Fig).Convergence measures were computed as described in Methods.
(EPS)
S18 Fig. Convergence measures for component-dependent simulations for T2D large islets (S10 Fig).
(EPS)
S19 Fig. Convergence measures for degree-dependent simulations for control large islets (S11 Fig).
(EPS)
S20 Fig. Convergence measures for degree-dependent simulations for T2D large islets (S12
S21 Fig. Convergence measures for component-dependent simulations for control small islets (S13 Fig).
(EPS)
S22 Fig. Convergence measures for component-dependent simulations for T2D small islets (S14 Fig).
(EPS)
S23 Fig. Convergence measures for degree-dependent simulations for control small islets (S15 Fig).
(EPS)
S24 Fig. Convergence measures for degree-dependent simulations for T2D small islets (S16
Fig). (EPS)
S25 Fig. Total difference between pair distribution functions of MPX2, MPX3 and T2D
MPX1 with experimental data.A. Difference between MPX2, where X = 0.7, pair distributions
and that of the original for given radii. The total difference between radii 8 and 13 is 3.42. B. Difference between MPX3, where X = 0.7, pair distributions and that of the original for given radii. The total difference between radii 8 and 13 is 3.96. C. Difference between T2D MP01 and the original. (Cumulative total difference is given in parentheses for each parameter set.) (EPS)
S26 Fig. Distribution of measures for MP01, MP02, and PP01. (EPS)
S1 Table. Mean degree for all islets per subject for neighborhood radii 8–13. (DOCX)
S2 Table. Mean degree for large islets per subject for neighborhood radii 8–13. (DOCX)
S3 Table. Mean degree for small islets per subject for neighborhood radii 8–13. (DOCX)
S4 Table. Mean number of components per islet for all islets per subject for neighborhood radii 8–13.denotes p<0.05 between the control and T2D groups,denotes a statistically-significant difference after the Bonferroni correction (usingn= 64).
(DOCX)
S5 Table. Mean number of components per islet for large islets per subject for neighbor-hood radii 8–13.
(DOCX)
S6 Table. Mean number of components per islet for small islets per subject for neighbor-hood radii 8–13.
(DOCX)
S7 Table. Mean number of cells per component for all islets per subject for neighborhood radii 8–13.
(DOCX)
S8 Table. Mean number of cells per component for large islets per subject for neighbor-hood radii 8–13.
S9 Table. Mean number of cells per component for small islets per subject for neighbor-hood radii 8–13.
(DOCX)
S10 Table. Mean number of nonsingular components per islet for all islets per subject for neighborhood radii 8–13.denotes p<0.05 between the control and T2D groups,denotes a statistically-significant difference after the Bonferroni correction (usingn= 64).
(DOCX)
S11 Table. Mean number of nonsingular components per islet for large islets per subject for neighborhood radii 8–13.
(DOCX)
S12 Table. Mean number of nonsingular components per islet for small islets per subject for neighborhood radii 8–13.
(DOCX)
S13 Table. Mean number of cells per nonsingular component for all islets per subject for neighborhood radii 8–13.
(DOCX)
S14 Table. Mean number of cells per nonsingular component for large islets per subject for neighborhood radii 8–13.
(DOCX)
S15 Table. Mean number of cells per nonsingular component for small islets per subject for neighborhood radii 8–13.
(DOCX)
S16 Table. Difference (Diff) of measures between large and small islets for control (C) and T2D datasets.
(DOCX)
S17 Table. Simulation results for randomly chosen addition and deletion processes.For
each islet type, the measures were calculated for the random simulation (Sim) and compared to the experimental (Exp) measure results. The difference (Diff) between the two values is given. (DOCX)
S1 Video. Individual islet component-dependent PP31 model simulation. (GIF)
S2 Video. Individual islet component-dependent PM31 model simulation. (GIF)
S3 Video. Individual islet component-dependent MP31 model simulation. (GIF)
S4 Video. Individual islet component-dependent MM31 model simulation. (GIF)
S1 Dataset. Control and T2D data files containing the islet number, cell number, (x,y) loca-tion, and cell type for each cell in each subject.
Acknowledgments
We thank Arthur Sherman for useful conversations during the course of this work. We would also like to thank Juen Guo for providing some statistical analyses. This study utilized the high-performance computational capabilities of the Biowulf Linux cluster at the National Institutes of Health, Bethesda, Md. (http://biowulf.nih.gov).
Author Contributions
Conceived and designed the experiments: VP DAS. Performed the experiments: DAS. Ana-lyzed the data: DAS VP. Contributed reagents/materials/analysis tools: MH. Wrote the paper: DAS VP.
References
1. Mears D, Sheppard NF, Atwater I, Rojas E. Magnitude and modulation of pancreatic beta-cell gap junc-tion electrical conductance in-situ. J Membr Biol. 1995; 146(2):163–76. PMID:7473686
2. Halban PA, Wollheim CB, Blondel B, Meda P, Niesor EN, Mintz DH. The possible importance of contact between pancreatic-islet cells for the control of insulin release. Endocrinology. 1982; 111(1):86–94. PMID:6123433
3. Jaques F, Jousset H, Tomas A, Prost A-L, Wollheim CB, Irminger J-C, et al. Dual effect of cell-cell con-tact disruption on cytosolic calcium and insulin secretion. Endocrinology. 2008; 149(5):2494–505. doi: 10.1210/en.2007-0974PMID:18218692
4. Perez-Armendariz ME. Connexin 36, a key element in pancreatic beta cell function. Neuropharmacol-ogy. 2013; 75:557–66. doi:10.1016/j.neuropharm.2013.08.015PMID:23973309
5. Henquin JC. Regulation of insulin secretion: a matter of phase control and amplitude modulation (Reprinted). Diabetologia. 2009; 52(5):739–51. doi:10.1007/s00125-009-1314-yPMID:19288076
6. Benninger RKP, Zhang M, Head WS, Satin LS, Piston DW. Gap junction coupling and calcium waves in the pancreatic islet. Biophys J. 2008; 95(11):5048–61. doi:10.1529/biophysj.108.140863PMID: 18805925
7. Smolen P, Rinzel J, Sherman A. Why pancreatic-islets burst but single beta-cells do not—the heteroge-neity hypothesis. Biophys J. 1993; 64(6):1668–80. PMID:8369400
8. Jo J, Kang H, Choi MY, Koh DS. How noise and coupling induce bursting action potentials in pancreatic beta-cells. Biophys J. 2005; 89(3):1534–42. PMID:15994889
9. Bosco D, Orci L, Meda P. Homologous but not heterologous contact increases the insulin-secretion of individual pancreatic B-cells. Exp Cell Res. 1989; 184(1):72–80. PMID:2676573
10. Stozer A, Gosak M, Dolensek J, Perc M, Marhl M, Rupnik MS, et al. Functional connectivity in islets of Langerhans from mouse pancreas tissue slices. PLoS Comput Biol. 2013; 9(2):12.
11. Bosco D, Haefliger J- A, Meda P. Connexins: key mediators of endocrine function. Physiol Rev. 2011; 91(4):1393–445. doi:10.1152/physrev.00027.2010PMID:22013215
12. Ravier MA, Guldenagel M, Charollais A, Gjinovci A, Caille D, Sohl G, et al. Loss of connexin36 chan-nels alters beta-cell coupling, islet synchronization of glucose-induced Ca2+ and insulin oscillations, and basal insulin release. Diabetes. 2005; 54(6):1798–807. PMID:15919802
13. Head WS, Orseth ML, Nunemaker CS, Satin LS, Piston DW, Benninger RKP. Connexin-36 gap junc-tions regulate in vivo first- and second-phase insulin secretion dynamics and glucose tolerance in the conscious mouse. Diabetes. 2012; 61(7):1700–7. doi:10.2337/db11-1312PMID:22511206
14. Carvalho CPF, Oliveira RB, Britan A, Santos-Silva JC, Boschero AC, Meda P, et al. Impaired beta-cell-beta-cell coupling mediated by Cx36 gap junctions in prediabetic mice. Am J Physiol Endocrinol Metab. 2012; 303(1):E144–E51. doi:10.1152/ajpendo.00489.2011PMID:22569071
15. Serre-Beinier V, Bosco D, Zulianello L, Charollais A, Caille D, Charpantier E, et al. Cx36 makes chan-nels coupling human pancreatic beta-cells, and correlates with insulin expression. Hum Mol Genet. 2009; 18(3):428–39. doi:10.1093/hmg/ddn370PMID:19000992
16. Hodson DJ, Mitchell RK, Bellomo EA, Sun G, Vinet L, Meda P, et al. Lipotoxicity disrupts incretin-regulated human beta cell connectivity. J Clin Invest. 2013; 123(10):4182–94. doi:10.1172/JCI68459 PMID:24018562
18. Klee P, Allagnat F, Pontes H, Cederroth M, Charollais A, Caille D, et al. Connexins protect mouse pan-creatic beta cells against apoptosis. J Clin Invest. 2011; 121(12):4870–9. doi:10.1172/JCI40509PMID: 22056383
19. Cabrera O, Berman DM, Kenyon NS, Ricordi C, Berggrern PO, Caicedo A. The unique cytoarchitecture of human pancreatic islets has implications for islet cell function. Proc Natl Acad Sci U S A. 2006; 103(7):2334–9. PMID:16461897
20. Pipeleers D, Intveld P, Maes E, Vandewinkel M. Glucose-induced insulin release depends on functional cooperation between islet cells. Proc Natl Acad Sci U S A. 1982; 79(23):7322–5. PMID:6760195
21. Kilimnik G, Zhao B, Jo J, Periwal V, Witkowski P, Misawa R, et al. Altered islet composition and dispro-portionate loss of large islets in patients with type 2 diabetes. PLoS One. 2011; 6(11).
22. Kilimnik G, Jo J, Periwal V, Zielinski MC, Hara M. Quantification of islet size and architecture. Islets. 2012; 4(2):167–72. doi:10.4161/isl.19256PMID:22653677
23. Bosco D, Armanet M, Morel P, Niclauss N, Sgroi A, Muller YD, et al. Unique arrangement of alpha- and beta-cells in human islets of Langerhans. Diabetes. 2010; 59(5):1202–10. doi:10.2337/db09-1177 PMID:20185817
24. Bonner-Weir S, O'Brien TD. Islets in type 2 diabetes: in honor of Dr. Robert C. Turner. Diabetes. 2008; 57(11):2899–904. doi:10.2337/db07-1842PMID:18971437
25. Orci L. Microanatomy of islets of Langerhans. Metabolism. 1976; 25(11):1303–13. PMID:135911
26. Erlandsen SL, Hegre OD, Parsons JA, McEvoy RC, Elde RP. Pancreatic-islet cell hormones distribu-tion of cell-types in islet and evidence for presence of somatostatin and gastrin with d cell. J Histochem Cytochem. 1976; 24(7):883–97. PMID:60437
27. Grube D, Eckert I, Speck PT, Wagner HJ. Immunohistochemistry and microanatomy of the islets of Langerhans. Biomed Res. 1983; 4:25–36.
28. Rhodes CJ. Type 2 diabetes—A matter of beta-cell life and death? Science. 2005; 307(5708):380–4 PMID:15662003
29. Levitt HE, Cyphert TJ, Pascoe JL, Hollern DA, Abraham N, Lundell RJ, et al. Glucose stimulates human beta cell replication in vivo in islets transplanted into NOD-severe combined immunodeficiency (SCID) mice. Diabetologia. 2011; 54(3):572–82. doi:10.1007/s00125-010-1919-1PMID:20936253
30. Swenne I. The role of glucose in the invitro regulation of cell-cycle kinetics and proliferation of fetal pan-creatic b-cells. Diabetes. 1982; 31(9):754–60. PMID:6761212
31. Saisho Y, Butler AE, Manesso E, Elashoff D, Rizza RA, Butler PC. Beta-cell mass and turnover in humans effects of obesity and aging. Diabetes Care. 2013; 36(1):111–7. doi:10.2337/dc12-0421 PMID:22875233
32. Rahier J, Guiot Y, Goebbels RM, Sempoux C, Henquin JC. Pancreatic beta-cell mass in European sub-jects with type 2 diabetes. Diabetes Obes Metab. 2008; 10:32–42. doi:10.1111/j.1463-1326.2008. 00969.xPMID:18834431
33. Weir GC, Bonner-Weir S. Islet beta cell mass in diabetes and how it relates to function, birth, and death. Ann N Y Acad Sci. 2013; 1281:92–105. doi:10.1111/nyas.12031PMID:23363033
34. Dor Y, Brown J, Martinez OI, Melton DA. Adult pancreatic beta-cells are formed by self-duplication rather than stem-cell differentiation. Nature. 2004; 429(6987):41–6. PMID:15129273
35. Saisho Y, Butler AE, Meier JJ, Monchamp T, Allen-Auerbach M, Rizza RA, et al. Pancreas volumes in humans from birth to age one hundred taking into account sex, obesity, and presence of type-2 diabe-tes. Clinical Anatomy. 2007; 20(8).
36. Butler AE, Janson J, Bonner-Weir S, Ritzel R, Rizza RA, Butler PC. Beta-cell deficit and increased beta-cell apoptosis in humans with type 2 diabetes. Diabetes. 2003; 52(1):102–10. PMID:12502499
37. Zulewski H, Abraham EJ, Gerlach MJ, Daniel PB, Moritz W, Muller B, et al. Multipotential nestin-positive stem cells isolated from adult pancreatic islets differentiate ex vivo into pancreatic endocrine, exocrine, and hepatic phenotypes. Diabetes. 2001; 50(3):521–33. PMID:11246871
38. Street CN, Lakey JRT, Seeberger K, Helms L, Rajotte RV, Shapiro AMJ, et al. Heterogenous expres-sion of nestin in human pancreatic tissue precludes its use as an islet precursor marker. J Endocrinol. 2004; 180(2):213–25. PMID:14765974
39. Donath MY, Schumann DM, Faulenbach M, Ellingsgaard H, Perren A, Ehses JA. Islet inflammation in type 2 diabetes from metabolic stress to therapy. Diabetes Care. 2008; 31:S161–S4. doi:10.2337/ dc08-s243PMID:18227479