FEASIBILITY STUDY OF LANDSAT-8 IMAGERY FOR RETRIEVING SEA SURFACE
TEMPERATURE (CASE STUDY PERSIAN GULF)
F. Bayat a, M. Hasanlou a,*
a School of Surveying and Geospatial Engineering, College of Engineering, University of Tehran, Tehran, Iran (bayat_f, hasanlou)@ut.ac.ir
Commission VIII, WG VIII/9
KEY WORDS: SST, Landsat-8, Split-Window, MODIS, Thermal bands, Non-Linear Model
ABSTRACT:
Sea surface temperature (SST) is one of the critical parameters in marine meteorology and oceanography. The SST datasets are incorporated as conditions for ocean and atmosphere models. The SST needs to be investigated for various scientific phenomenon such as salinity, potential fishing zone, sea level rise, upwelling, eddies, cyclone predictions. On the other hands, high spatial resolution SST maps can illustrate eddies and sea surface currents. Also, near real time producing of SST map is suitable for weather forecasting and fishery applications. Therefore satellite remote sensing with wide coverage of data acquisition capability can use as real time tools for producing SST dataset. Satellite sensor such as AVHRR, MODIS and SeaWIFS are capable of extracting brightness values at different thermal spectral bands. These brightness temperatures are the sole input for the SST retrieval algorithms. Recently, Landsat-8 successfully launched and accessible with two instruments on-board: (1) the Operational Land Imager (OLI) with nine spectral bands in the visual, near infrared, and the shortwave infrared spectral regions; and (2) the Thermal Infrared Sensor (TIRS) with two spectral bands in the long wavelength infrared. The two TIRS bands were selected to enable the atmospheric correction of the thermal data using a split window algorithm (SWA). The TIRS instrument is one of the major payloads aboard this satellite which can observe the sea surface by using the split-window thermal infrared channels (CH10: 10.6 μm to 11.2 μm; CH11: 11.5 μm to 12.5 μm) at a resolution of 30 m. The TIRS sensors have three main advantages comparing with other previous sensors. First, the TIRS has two thermal bands in the atmospheric window that provide a new SST retrieval opportunity using the widely used split-window (SW) algorithm rather than the single channel method. Second, the spectral filters of TIRS two bands present narrower bandwidth than that of the thermal band on board on previous Landsat sensors. Third, TIRS is one of the best space born and high spatial resolution with 30 m. in this regards, Landsat-8 can use the Split-Window (SW) algorithm for retrieving SST dataset. Although several SWs have been developed to use with other sensors, some adaptations are required in order to implement them for the TIRS spectral bands. Therefore, the objective of this paper is to develop a SW, adapted for use with Landsat-8 TIRS data, along with its accuracy assessment. In this research, that has been done for modelling SST using thermal Landsat 8-imagery of the Persian Gulf. Therefore, by incorporating contemporary in situ data and SST map estimated from other sensors like MODIS, we examine our proposed method with coefficient of determination (R2) and root mean square error (RMSE) on check point to model SST retrieval for Landsat-8 imagery. Extracted results for implementing different SW’s clearly shows superiority of utilized method by R2=0.95 and RMSE=0.24.
1. INTRODUCTION
The ocean surface is a point connecting of the Earth’s climate system: the oceans and atmosphere. Heat around the earth planet transferred by oceans and atmosphere and interactions between the two systems makes the Earth’s surface habitable. Heat exchange between the ocean and atmosphere is determined by moisture, gases (such as CO2) and sea surface temperature (SST)[1]. SST is one of the most important parameters in oceanography and marine meteorology. The SST values are used as boundary conditions for modelling of the atmosphere and oceans. Also, the SST values use for confirming these model outputs. The high-resolution maps of SST can show ocean surface currents and eddies. Near-real time (NRT) processing of SST is practical for fisheries and meteorological forecasts[2]. Determination of SST using satellite remote sensing have two main advantages. First, the high-resolution global coverage provided by a single sensor, or suite of sensors on similar satellites, that produces a consistent data set. Second, temperature is a physical variable that can be measured with relative ease. It can also be measured to useful accuracy by instruments on observation satellites[1].
* Corresponding author
When the spatial distribution of surface temperature on a wide areas and at the same time is required, remote sensing technology will show their capabilities.
Research on modeling SST using Landsat-8 imagery is important because of two reasons: first, Landsat-8 imagery has two thermal bands and thus it has a high potential for modeling surface temperature using multiband algorithms. Second, determination of SST is applicable and important that due to the high spatial resolution Landsat-8 satellite images the possibility of studying on the coastal areas is also provided.
In Remote Sensing, to estimate the surface temperature it is required that satellite images have appropriate temporal and spatial resolution. Thermal bands of remotely sensed images use radiative transfer equation that related to surface temperatures. Since the mid-1970s ,the calculation of SST using thermal infrared data sets started and by development of measurement tools increased accuracy of these calculations [3].
In recent decades, estimation of surface temperature through satellite data has improved and different algorithms to determine the temperature is presented by different sensors. The basis of these algorithms are based on assumptions and approximations variety of radiation equation. These algorithms can be divided into three general categories[4]: 1) Single-Channel (SC) The International Archives of the Photogrammetry, Remote Sensing and Spatial Information Sciences, Volume XLI-B8, 2016
XXIII ISPRS Congress, 12–19 July 2016, Prague, Czech Republic
This contribution has been peer-reviewed.
methods, 2) Split Window (SW) methods and 3) Dual Angle (DA) methods.
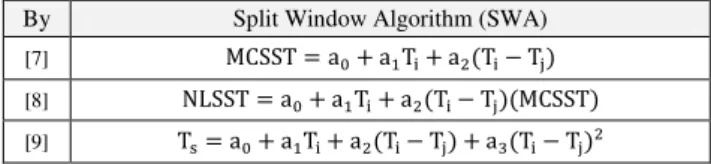
The SW methods have two main advantages comparing with other methods. First, this method does not require accurate atmospheric profiles. Second, this method has high performance for all sensors with at least two thermal bands [5]. In this study, we investigated split window methods for Landsat-8 imagery since it is first satellite of the Landsat series with high resolution which has two thermal bands. The SW methods reduce atmospheric effects by using a combination of thermal bands close in the atmospheric window at 10 and 12 μm [6]. Many researchers are provided numerous algorithms for different sensors to estimate SST and gained various precision. Number of these algorithms are shown in Table 1.
Table 1. Different split window algorithm customized in this study.
By Split Window Algorithm (SWA)
[7] MCSST = a + a T + a T − T
[8] NLSST = a + a T + a T − T MCSST
[9] Ts= a + a T + a T − T + a T − T
2. STUDY AREA
The Persian Gulf, one of the most critical bodies of water, is positioned in the heart of the Middle East. Located in south western Asia, it separates the Arabian Peninsula from Iran (Figure 1). The small freshwater inflow into the Persian Gulf is mostly from the Tigris, Euphrates, and Karun rivers. Surface-water temperatures range from 24 to 32 °C in the Strait of Hormuz from 16 to 32 °C in the extreme northwest. These high temperatures and a low influx of fresh water result in evaporation in excess of freshwater inflow; high salinities result, ranging from 37 to 38 parts per thousand in the entrance to 38 to 41 parts per thousand in the extreme northwest. Even greater salinities and temperatures are found in the waters.
In this paper part of north Persian Gulf region is used as study area. Also, Landsat-8 imagery from this area is incorporated as image data set (Figure 1).
Figure 1. Study area in Persian Gulf region
3. IMAGE DATA SETS
In recent decades, sensors, such as the Moderate-resolution Imaging Spectroradiometer (MODIS) and the Advanced Very High Resolution Radiometer (AVHRR), measure thermal data twice a day using two long-wave infrared (LWIR) bands. Also Landsat-5 Thematic Mapper (TM) and Landsat-7 Enhanced Thematic Mapper Plus (ETM+) measure thermal data using just one long-wave infrared (LWIR) band, with a higher spatial
resolution but with a 16-day temporal resolution. Since satellite remote sensing provides a repetitive synoptic view in short intervals of the Earth’s surface, it is a vital tool for monitoring surface temperature. The relative spectral response of the TIRS bands for some other sensors are presented in Figure 2. As it is clear from Figure 2, most of sensors have same regions wavelength in thermal spectrum mainly near 10 and 12 μm.
Figure 2. TIRS, MODIS and ETM+ relative spectral response functions(the data can be seen in[10])
3.1 Landsat-8 imagery
Landsat-8 was successfully launched on 11 February 2013 and deployed into orbit with two instruments on-board: (1) the Operational Land Imager (OLI) with nine spectral bands in the visual (VIS), near infrared (NIR), and the shortwave infrared (SWIR) spectral regions; and (2) the Thermal Infrared Sensor (TIRS) with two spectral bands in the LWIR. The relative spectral response of the TIRS bands is presented in Figure 3. The two TIRS bands were selected to enable the atmospheric correction of the thermal data using a split window algorithm (SWA) [11],[12]. The use of two separate, relatively narrow, thermal bands has been shown to minimize the error in the retrieval of surface temperature [13]. The spatial resolution of TIRS data is 100 m with a revisit time of 16 days, and as a result, applications are different than those of other sensors with coarser spatial resolutions and shorter revisit times. While Landsat-8 images are already freely distributed through the U.S. Geological Survey (USGS), to the best of our knowledge, no SWA for surface temperature retrieval from TIRS has been published. Although several SWAs have been developed for use with other sensors [14], [15], [16], [17], some adaptations are required in order to implement them for the TIRS spectral bands. Therefore, the objective of this letter is to develop a SWA, adapted for use with Landsat-8 TIRS data, along with its accuracy assessment. Landsat-8 TIRS bands’ relative spectral response functions are shown in figure 3.
Figure 3. Landsat-8 TIRS bands’ relative spectral response functions (the data can be seen in[18]).
The International Archives of the Photogrammetry, Remote Sensing and Spatial Information Sciences, Volume XLI-B8, 2016 XXIII ISPRS Congress, 12–19 July 2016, Prague, Czech Republic
This contribution has been peer-reviewed.
The dataset used in this study included images of December 10, 2014, January 27 and 28 February 2015.
3.2 MODIS Datasets
MODIS is a key instrument aboard the Terra (originally known as EOS AM-1) and Aqua (originally known as EOS PM-1) satellites. Terra's orbit around the Earth is timed so that it passes from north to south across the equator in the morning, while Aqua passes south to north over the equator in the afternoon. Terra MODIS and Aqua MODIS are viewing the entire Earth's surface every 1 to 2 days, acquiring data in 36 spectral bands, or groups of wavelengths (see MODIS Technical Specifications). These data will improve our understanding of global dynamics and processes occurring on the land, in the oceans, and in the lower atmosphere. MODIS is playing a vital role in the development of validated, global, interactive Earth system models able to predict global change accurately enough to assist policy makers in making sound decisions concerning the protection of our environment[19].
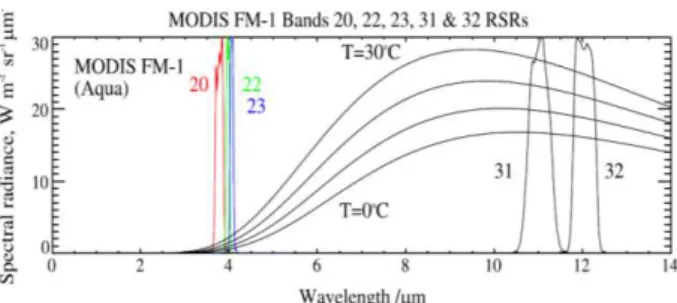
The bands used for SST measurement are in the atmospheric ‘windows’ at wavelengths of 3.5 to 4.2 µm and 10 to 12 µm. There are two spectral bands (numbered 31 and 32) in the longer wavelength window, which correspond closely to the corresponding AVHRR channels (AVHRR channels 4 and 5), but there are three in the mid-infrared window (bands 20, 22 and 23) where AVHRR has just one (AVHRR channel 3). This Level 2 and 3 product provides sea surface temperature at 1-km (Level 2) and 4.6 km, 36 km, and 1° (Level 3) resolutions over the global oceans[20]. This products provide accuracy of sea surface temperature about 0.3-0.5 k[3]. Spectral response functions for some sensors are shown in Figure 4.
Figure 4. Spectral response functions for the Terra MODIS bands used for retrieving SST, with the Planck Function for temperatures 0, 10, 20 and 30oC. The emission at ~4μm is much smaller than at 10-12μm (the data can be seen in[20]).
4. EXPERIMENT AND RESULT
In this study, the MCSST, NLSST and Coll and Caselles algorithm coefficients were retrieved at Persian Gulf using LandsaT-8 imagery. The algorithm coefficients were derived from the regression between the SST MODIS data at Persian Gulf and nearly coincident satellite data. The satellite data used for regression was brightness temperature of channel 10 (T10) and channel 11 (T11) for Landsat-8 image. The SST data was estimated by MCSST, NLSST and Coll and Caselles algorithms with new calibrated algorithm coefficients. Flowchart of the algorithm to be performed during SST estimation using TIRS bands 10 and 11 are shown in Figure 5.
Figure 5. Flowchart of SST retrieval
To evaluate the performance of any regression models, two independent data which includes training data to generate models and testing data for model evaluation are required. On this basis, data were divided random into two groups. The first group includes 30% of data and this group was used for training. The other group includes 70% of the remaining data which was regarded to testing the model. On this basis, we obtained coefficients of different algorithms using training data for the study area and evaluated them with testing data. Estimated coefficients for MCSST, NLSST and Coll and Caselles algorithms are shown in Table 2.
Table 2. Estimated coefficients for MCSST, NLSST and Coll and Caselles algorithms
Coefficients Coll and Caselles MCSST NLSST
a0 8.914 5.1424 8.9542
a1 0.86421 0.95578 0.86254
a2 -6.3454 0.83653 -6.4465
a3 3.3997 - 0.004278
a4 - - 3.4108
The results of evaluation using training data sets (30% of data) and testing data sets (70% of data) are shown in Table 3.
Table 3. Estimated RMSE and R2 values for MCSST, NLSST and Coll and Caselles algorithms for training and testing data sets. Algorithms Data sets RMSE R-Squared(R2)
Coll and Caselles
Training 0.243 0.949
Testing 0.242 0.949
MCSST Training 0.361 0.887
Testing 0.360 0.887
NLSST Training 0.243 0.949
Testing 0.243 0.949
Comparison of the amount of RMSE and R2 for training and testing data sets (are shown in Tables 3) are showing high accuracy of proposed models. Also, the histograms of residuals for the SST calculated by the new calibrated MCSST, NLSST and Coll and Caselles algorithms were shown in Figure 6. This is clear from Figure 6 that, all three related histograms compatible with Gaussian distribution function.
The International Archives of the Photogrammetry, Remote Sensing and Spatial Information Sciences, Volume XLI-B8, 2016 XXIII ISPRS Congress, 12–19 July 2016, Prague, Czech Republic
This contribution has been peer-reviewed.
a) b) c) Figure 6. Histograms of residual temperatures using the
split-window algorithm; a) Coll and Caselles; b) MCSST; c) NLSST
5. CONCLUSION
In this study, Landsat-8 imagery used as the Split-Window (SW) algorithms for retrieving SST data set. Although several SWs (Table 1) have been developed to use with other sensors, some adaptations are required in order to implement them for the TIRS spectral bands. Therefore, the objective of this paper is to develop a SW, adapted for incorporating Landsat-8 TIRS imagery, along with its accuracy assessment. Also in this research, the Persian Gulf region was used as study area and for modeling SST derived from thermal Landsat 8-imagery. Therefore, by incorporating contemporary in situ data and SST map estimated from other sensors like MODIS, we examine our proposed method with coefficient of determination (R2) and root mean square error (RMSE) on check point to model SST. Extracted results for implementing different SW’s clearly shows superiority of utilized method by R2=0.95 and RMSE=0.24 kelvin for NLSST algorithm and Coll and Caselles algorithm. Comparison of RMSE and R-Squared are shown in Figure 7.
Figure 7. Comparison between RMSE and R-Squared
Thus we can use implemented model for the study area by NLSST and Coll and Caselles algorithms as a model with high efficiency for modeling SST using Landsat-8 imagery.
REFERENCES
[1] P. J. Minnett, “Satellite Remote Sensing of Sea Surface Temperatures A2 - Steele, John H.,” in Encyclopedia of Ocean Sciences, Oxford: Academic Press, 2001, pp. 2552–2563.
[2] K. Hosoda, H. Murakami, F. Sakaida, and H. Kawamura, “Algorithm and validation of sea surface temperature observation using MODIS sensors aboard terra and aqua in the western North Pacific,” J. Oceanogr., vol. 63, no. 2, pp. 267–280, Apr. 2007.
[3] Dr. S. K. Alavipanah, Thermal Remote Sensing and its Application in the Earth Sciences, 2nd ed. University of Tehran, 1387.
[4] Z.-L. Li, H. Wu, N. Wang, S. Qiu, J. A. Sobrino, Z. Wan, B.-H. Tang, and G. Yan, “Land surface emissivity retrieval from satellite data,” Int. J. Remote Sens., vol. 34, no. 9–10, pp. 3084–3127, May 2013.
[5] M. Momeni and M. R. Saradjian, “A weighted least squares approach for estimation of land surface
temperature using constraint equations,” Photogramm. Eng. Remote Sens., vol. 74, no. 5, pp. 637–646, 2008. [6] L. M. McMillin, “Estimation of sea surface temperatures
from two infrared window measurements with different absorption,” J. Geophys. Res., vol. 80, no. 36, pp. 5113– 5117, Dec. 1975.
[7] E. P. McClain, W. G. Pichel, and C. C. Walton, “Comparative performance of AVHRR-based multichannel sea surface temperatures,” J. Geophys. Res. Oceans, vol. 90, no. C6, pp. 11587–11601, Nov. 1985. [8] “National Oceanic and Atmospheric Administration.”
[Online]. Available: http://www.noaa.gov/. [Accessed: 05-Apr-2016].
[9] C. Coll and V. Caselles, “A split-window algorithm for land surface temperature from advanced very high resolution radiometer data: Validation and algorithm comparison,” J. Geophys. Res. Atmospheres, vol. 102, no. D14, pp. 16697–16713, Jul. 1997.
[10] J. A. Barsi, J. R. Schott, S. J. Hook, N. G. Raqueno, B. L. Markham, and R. G. Radocinski, “Landsat-8 Thermal Infrared Sensor (TIRS) Vicarious Radiometric Calibration,” Remote Sens., vol. 6, no. 11, pp. 11607– 11626, Nov. 2014.
[11] J. R. Irons, J. L. Dwyer, and J. A. Barsi, “The next Landsat satellite; the Landsat Data Continuity Mission,” Remote Sens. Environ., vol. 122, p. 1121, 2012.
[12] R. H. Cuenca, S. P. Ciotti, and Y. Hagimoto, “Application of Landsat to Evaluate Effects of Irrigation Forbearance,” Remote Sens., vol. 5, no. 8, pp. 3776–3802, Aug. 2013. [13] V. Caselles, E. Rubio, C. Coll, and E. Valor, “Thermal
band selection for the PRISM instrument: 3. Optimal band configurations,” J. Geophys. Res. Atmospheres, vol. 103, no. D14, pp. 17057–17067, Jul. 1998.
[14] J. C. Price, “Land surface temperature measurements from the split window channels of the NOAA 7 Advanced Very High Resolution Radiometer,” J. Geophys. Res.
Atmospheres, vol. 89, no. D5, pp. 7231–7237, Aug. 1984.
[15] K. Mao, Z. Qin, J. Shi, and P. Gong, “A practical split‐ window algorithm for retrieving land‐surface temperature from MODIS data,” Int. J. Remote Sens., vol. 26, no. 15, pp. 3181–3204, Aug. 2005.
[16] J. A. Sobrino and M. Romaguera, “Land surface temperature retrieval from MSG1-SEVIRI data,” Remote Sens. Environ., vol. 92, no. 2, pp. 247–254, Aug. 2004. [17] B. Tang, Y. Bi, Z.-L. Li, and J. Xia, “Generalized
Split-Window Algorithm for Estimate of Land Surface Temperature from Chinese Geostationary FengYun Meteorological Satellite (FY-2C) Data,” Sensors, vol. 8, no. 2, pp. 933–951, Feb. 2008.
[18] “Spectral Response of the Thermal Infrared Sensor « Landsat Science.” [Online]. Available: http://landsat.gsfc.nasa.gov/?p=5698. [Accessed: 28-Feb-2016].
[19] “MODIS Web.” [Online]. Available: http://modis.gsfc.nasa.gov/about/. [Accessed: 29-Feb-2016].
[20] “MODIS Website.” [Online]. Available: http://modis.gsfc.nasa.gov/data/dataprod/dataproducts.ph p?MOD_NUMBER=28. [Accessed: 29-Feb-2016]. The International Archives of the Photogrammetry, Remote Sensing and Spatial Information Sciences, Volume XLI-B8, 2016
XXIII ISPRS Congress, 12–19 July 2016, Prague, Czech Republic
This contribution has been peer-reviewed.