Ecosystem Evapotranspiration as a Response
to Climate and Vegetation Coverage
Changes in Northwest Yunnan, China
Hao Yang1,2,4, Peng Luo1,3*, Jun Wang1,2,4, Chengxiang Mou1,4, Li Mo1,4, Zhiyuan Wang5, Yao Fu6, Honghui Lin2, Yongping Yang6, Laxmi Dutt Bhatta7
1Key Laboratory of Mountain Ecological Restoration and Bioresource Utilization of Chinese Academy of Sciences, Chengdu Institute of Biology, Chinese Academy of Sciences, Chengdu, China,2College of Life Sciences, Sichuan University, Chengdu, China,3Ecological Restoration and Biodiversity Conservation Key Laboratory of Sichuan Province, Chengdu Institute of Biology, Chinese Academy of Sciences, Chengdu, China,4University of Chinese Academy of Sciences, Beijing, China,5Yunnan Academy of Agricultural Sciences, Kunming, China,6Kunming Institute of Botany, Chinese Academy of Sciences, Kunming, China,
7International Centre for Integrated Mountain Development, Kathmandu, Nepal
Abstract
Climate and human-driven changes play an important role in regional droughts. Northwest Yunnan Province is a key region for biodiversity conservation in China, and it has experienced severe droughts since the beginning of this century; however, the extent of the contributions from climate and human-driven changes remains unclear. We calculated the ecosystem evapotranspiration (ET) and water yield (WY) of northwest Yunnan Province, China from 2001 to 2013 using meteorological and remote sensing observation data and a Surface Energy Balance System (SEBS) model. Multivariate regression analyses were used to differ-entiate the contribution of climate and vegetation coverage to ET. The results showed that the annual average vegetation coverage significantly increased over time with a mean of 0.69 in spite of the precipitation fluctuation. Afforestation/reforestation and other management efforts attributed to vegetation coverage increase in NW Yunnan. Both ET and WY considerably fluc-tuated with the climate factors, which ranged from 623.29 mm to 893.8 mm and–51.88 mm to 384.40 mm over the time period. Spatially, ET in the southeast of NW Yunnan (mainly in Lijiang) increased significantly, which was in line with the spatial trend of vegetation coverage. Multivariate linear regression analysis indicated that climatic factors accounted for 85.18% of the ET variation, while vegetation coverage explained 14.82%. On the other hand, precipita-tion accounted for 67.5% of the WY. We conclude that the continuous droughts in northwest Yunnan were primarily climatically driven; however, man-made land cover and vegetation changes also increased the vulnerability of local populations to drought. Because of the high proportion of the water yield consumed for subsistence and poor infrastructure for water man-agement, local populations have been highly vulnerable to climate drought conditions. We suggest that conservation of native vegetation and development of water-conserving agricul-tural practices should be implemented as adaptive strategies to mitigate climate change.
OPEN ACCESS
Citation:Yang H, Luo P, Wang J, Mou C, Mo L, Wang Z, et al. (2015) Ecosystem Evapotranspiration as a Response to Climate and Vegetation Coverage Changes in Northwest Yunnan, China. PLoS ONE 10 (8): e0134795. doi:10.1371/journal.pone.0134795
Editor:Shilong Piao, Peking University, CHINA
Received:April 10, 2015
Accepted:July 14, 2015
Published:August 3, 2015
Copyright:© 2015 Yang et al. This is an open access article distributed under the terms of the
Creative Commons Attribution License, which permits unrestricted use, distribution, and reproduction in any medium, provided the original author and source are credited.
Data Availability Statement:The primary dataset of the manuscript contains two parts: remote sensing image data and meteorological data. Remote sensing image data are available from Goddard Space Flight Center, NASA (http://ladsweb.nascom.nasa.gov/ browse_images) for free downloading. Meteorological data are available from Climatic Data Center, National Meteorological Information Center, China
Introduction
Climate change had influences on biodiversity and socio-economic systems primarily through increasing temperatures and climate-related disasters [1,2]. Improving the capacity of the environment to adapt to continuous climate change is vital for the sustainable development of human society and economic systems [3,4]. Therefore, it is imperative to understand vulnera-bility of systems and employ corresponding adaptive strategies for biodiversity conservation and adaptive management. Yunnan Province, which is located in Southwest China, is a key area for biodiversity because its vast mountains host more than 18, 000 high plant species and 1, 836 vertebrate species, which account for 51.6% of the total plants and 54.8% of the total ver-tebrate species in China [5], respectively. Since the last decade, this area has experienced con-tinuous and intensifying drought conditions, especially in spring, which have led to great social and economic losses [6–8]. These continuous droughts are of significant concern globally and nationally because they are a typical example of the influence of climate change on the sustain-ability of ecological and social systems in a biodiversity hotspot. Understanding the reasons for increased drought conditions is important for developing adaptive strategies for both conserva-tion and development.
In general, drought can be attributed to climate and anthropogenic activities. Global aridity, especially in Africa, Southern Europe, East and South Asia, and Eastern Australia since the late 1970s has been attributed to natural variations in the El Nino-Southern Oscillation (ENSO), tropical Atlantic sea surface temperatures, Asian monsoons, and global warming [9]. Human activities have also triggered or aggravated drought by changing aerosols concentrations [10], altering land use/land cover [11–14], and increasing water demand along with social develop-ment [15]. A tendency of climate warming over the past 50 years was observed in Yunnan [16,
17], and the moisture or precipitation deficiency in combination with increasing temperatures accounted for drought conditions [18]. However, a number of studies have found that deficien-cies during droughts were within the range of variations observed during historical climatic drought events [19,20]. Therefore, the continuous droughts occurring in Yunnan could not be fully explained by climate reasons alone. Although the potential effects of human activities on droughts have been widely discussed [21–23], empirical studies have not been conducted to determine the extent of climate-change or human-activity contributions to the drought.
Drought causes shortages of available water for the ecological and social systems [24] and occurs when the ability of the ecosystem to provision water is lowered, which aggravates drought damage. The water provision function of an ecosystem can be measured by its water yield (WY), which is the sum of runoff and soil undercurrent after plant transpiration, surface evaporation, and vegetation/soil retention [25]. In addition to precipitation, evapotranspiration (ET) is the largest factor influencing WY in water balance equations, which is greatly altered by vegetation dynamics and characteristics [26]. Higher ET results in less water provision to the social system, making it more vulnerable to climatic drought. In recent decades, Yunnan underwent rapid economic development and the most dramatic land-use and land-cover changes in its history [14,27–29]. The natural vegetation of the area has been significantly modified by increased human utilization, and most of its barren hilly lands have been re-vege-tated in massive afforestation and reforestation efforts [14,30–32]. Therefore, determining the relationship between the dynamics of ET and vegetation changes is crucial to understanding the causes of droughts and determining the increasing vulnerability of the social system to cli-matic drought in this hotspot area.
We hypothesized that the vegetation coverage changes induced by afforestation/reforesta-tion and other vegetaafforestation/reforesta-tion management activities over the past 13 years have increased the water consumption (ET) and lowered the ecosystem’s water provision capability, which may
Funding:This research was funded by the National Natural Science Foundation of China (31170432), the Basic Study Project of Science & Technology Ministry (2012FY110300), the International Center for Integrated Mountain Development (HICAP), the CEPF Project of Shan Shui Conservation Center (201204003), and the John D. and Catherine T. MacArthur foundation (104115). The funders had no role in study design, data collection and analysis, decision to publish, or preparation of the manuscript.
eventually reduce the social system’s resilience to manage water shortage caused by climatic drought. Northwest (NW) Yunnan is an internationally recognized key area of biodiversity conservation in China [33], and it was selected as the study area to test this hypothesis. We uti-lized a surface energy balance system (SEBS) model to calculate the regional ET according to relevant meteorological data and remote sensing data from 2001 to 2013. We also analyzed the correlations among ET, climate, and vegetation coverage to 1) measure the ecohydrological effects of climate and vegetation coverage changes and 2) analyze and discuss the impact of cli-mate and vegetation coverage changes on droughts in NW Yunnan. The results of this study may be used as a guide in the planning of adaptive strategies for sustainable development in this globally important area of biodiversity conservation.
Study Area
As a part of the Hengduan Mountains, one of the 17 critical regions for biodiversity conserva-tion and the world’s most diverse temperate mountain forests [34,35], NW Yunnan has expe-rienced significant vegetation changes because of rapid economic development and massive afforestation/reforestation programs (i.e., National Forest Protection Plan) [14,30,36]. NW Yunnan is located in the east of the Himalayas (24°380N–29°150N, 98°050E–101°160E) at ele-vations varying from 648 m to 6,740 m. This area is in the upstream area of four major rivers (Yangtze, Mekong, Salween, and Irrawaddy) in Asia and possesses unique ecological functions [37], especially as the water source area to over 100 million people downstream. Diverse and complicated topography in this area create a variety of microclimates [38]. In general, mon-soons bring moisture in summer, with most of the precipitation falling between June and Sep-tember. The mean annual temperature in this area is 12.3°C and the mean annual rainfall is 1,013 mm.
The land area of NW Yunnan accounts for only 0.4% of the total area in China; however, it hosts 20% of the high plant species and approximately one quarter to one-third of the total animals in China [39]. Evergreen broadleaf forest and mixed forest are the major forest types, alpine grassland is also common [37]. Traditional mountain agriculture is still the major liveli-hood for its rural population. NW Yunnan covers four administrative prefectures: Nujiang, Diqing, Dali, and Lijiang (Fig 1). Dali and Lijiang are relatively more densely populated and developed, with population densities of 118.6 and 59.5 people per km2, respectively. Compared with Dali and Lijiang, Nujiang and Diqing are less populated, with densities of 36.6 and 17.0 people per km2, respectively [40]. Continuous droughts over the last decade in NW Yunnan, especially in Dali and Lijiang, have reduced agricultural production and triggered severe domestic water shortages (Climate Communique of Dali Prefecture:http://dl.xxgk.yn.gov.cn/ z_m_003/Info_More.aspx?Classid=126584).
Data Source
Moderate Resolution Imaging Spectroradiometer (MODIS) L1B time-series data
spatial resolution, which were prepared to calculate the ET of the heterogeneous underlying surface (NW Yunnan) in SEBS.
Meteorological data were downloaded from the China Metrological Data Sharing Service System (http://cdc.nmic.cn/home.do), and data from 21 weather stations in the vicinity of the research area were obtained for 2001 and 2013 (Fig 1).
Methods
ET and WY calculation
WY can be calculated as the difference between precipitation and ET [41–43]. The widely used remote sensing model SEBS was chosen to calculate the ET of heterogeneous land surfaces according to satellite data and meteorological information at proper scales [44,45]. The model is based on traditional energy-balance equations, and it successfully used in different studies worldwide [46–49]. Su et al. proposed the SEBS model [50]. The surface energy balance is com-monly written as follows:
lE¼Rn G0 H ð1Þ
whereλEis the turbulent latent heatflux (λis the latent heat of vaporization andEis the actual Fig 1. Locations of the 21 meteorological stations and vegetation coverage changes over past 13 years.The trend of vegetation coverage changes from 2001 to 2013 is estimated by linear trend analysis. F-test is employed to test significance of the trends. The increase or decrease trends of vegetation coverage are categorized into three levels: very significantly (P<0.01), significantly (P<0.05), and slightly (P>0.05).
ET),Rnis the net radiation,G0is the soil heatflux, andHis the sensible heatflux. Calculation methods of above variables were detailed by Su et al. [50].
Comparing with other energy residual methods, the SEBS model improved the following two aspects. First, based onκB-1models of full canopy and bare soil surface, it produced
reli-able estimates ofκB-1that were partly covered with vegetation, which was used for the scalar
roughness height of heat transfer andHestimation. Second, every pixel was placed under the dry and wet limits to avoid uncertainty of spatial interpolation of meteorological data. SEBS assumed that the latent heat flux (λE) was zero at the dry limit because of the limitation of soil
moisture, but it took place at potential rate in the wet limit. As a result, sensible heat flux reached its maximum and minimum values, respectively, which can be expressed as:
Hdry¼Rn G0 ð2Þ
Hwet¼Rn G0 lEwet ð3Þ
According to Eqs1,2and3, the relative evaporative fraction (EFr) and evaporative fraction (EF) then can be calculated as:
EFr¼
lE
lEwet
¼1 H Hwet
Hdry Hwet
ð4Þ
EF¼ lE
Rn G0
¼EFrlEwet
Rn G0
ð5Þ
By invertingEq 5, the actual latent heatflux can be obtained, then daily ET can be calculated as:
ETdaily¼8:6410
7
EFdaily
Rn G0
lrw ð6Þ
whereETdailyis the actual daily evapotranspiration (mm/d),ρwis the water density. Here,Rn represents daily mean net radiation, and G0is daily mean soil heatflux which is close to zero. EFdailyis the daily mean evaporation fraction.EFdailycan be replaced byEFas the model assumes thatEFremained relatively stable during one day.
We multiplied the reference ET fraction by ET0and completed the extension at the
appro-priate time scale. The Food and Agriculture Organization (FAO) of the United Nations' report FAO-56 defined ET0as the ET rate from a reference surface that does not experience water
shortages [51], and it is calculated as follows:
ET0 ¼
0:408DðR
n G0Þ þg 900
Tþ273v2ðes eaÞ
Dþgð1þ0:34v 2Þ
ð7Þ
This extension method originated with the model mapping ET with internalized calibration (METRIC) [52], which is similar to the KC-ET0approach [51]. Considering the minimal
varia-tion in reference ET fracvaria-tion over several weeks, we can use the following equavaria-tion to deter-mine the total monthly or seasonal ET:
ETperiod ¼
Xn
i¼m
ETrFi
ð ÞðET0iÞ
ð8Þ
calculated by SEBS over the reference ET (ETr),ETrFiis the interpolatedETrFfor dayiand
ET0iis the daily ET0for dayi.
The precipitation value was obtained from the meteorological station in this area and inter-polated to polygon data at the regional scale with the inverse distance weighted method. WY was calculated by determining the precipitation and subtracting the ET.
Estimate precision of the SEBS model
Because of the lack of availability of ET field data, free water surface evaporation data measured by evaporators at meteorological stations were used to validate the precision of the estimated ET. A 20 m2evaporation tank was recommend by the World Meteorological Organization as the standard evaporimeter to measure free water surface evaporation [53]. In China modified GGI-3000, named E601 evaporator (area 0.3 m2), is a common tool used to observe evapora-tion in meteorological staevapora-tions [54]. We used the water surface evaporation of Erhai Lake obtained from the adjacent Dali meteorological station in NW Yunnan to estimate the preci-sion of the SEBS model. The converted coefficient between the 20 m2evaporation tank and E601 was 0.97 in Dali [55]. The root mean square deviation (RMSD) and mean absolute per-cent error (MAPE) were used to compare the differences between the estimated ET and mea-sured value that was converted to the ET of the 20 m2evaporation tank according to the coefficient. These two variables were calculated as follows:
RMSD¼ 1
n
Xn
i¼1
ðPi OiÞ
2
1=2
ð9Þ
MAPE¼100
n
Xn
i¼1
Pi Oi
j j
Oi
ð10Þ
wherenis the number of samples,Piis the evaporation estimated by the SEBS model, andOiis the observed value by the E601 evaporator.
Image processing
All of the obtained images were reprojected and converted to geographic longitude/latitude WGS-1984 projections in geo-tiff format using the MODIS Swath tool. MOD021KM and MOD03 products were used to calculate the surface physical parameters, such as albedo, vege-tation coverage, emissivity, surface temperature, and instantaneous normalized difference veg-etation index (NDVI), via ILWIS 3.8.3 and ArcGIS 10.
Monthly NDVI data were used to estimate the vegetation coverage based on the dimidiate pixel model. In the dimidiate pixel model, a pixel consists of vegetation and non-vegetation. Thus, the ratio of vegetation coverage to the pixel (vegetation fraction) represents the vegeta-tion coverage, and this model is widely used to estimate vegetavegeta-tion coverage [56,57]. This vari-able was calculated as follows [58,59]:
Fc¼ ðNDVI NDVIsoilÞ=ðNDVIveg NDVIsoilÞ ð11Þ
whereNDVIsoilis the NDVI value of bare soil or non-vegetation coverage, andNDVIveg repre-sents the NDVI value of full vegetation coverage at a pixel. Given 5% vote of confidence,NDVI -vegandNDVIsoilwere set as the maximal and minimal NDVI, respectively [59].
SEBS model to calculate the relative evaporation and daily ET as well as in the calculations for the reference ET (ET0) in the ET0calculator.
Statistical analysis
Linear trend estimation was employed to quantify the ET and WY trends in every pixel as fol-lows:
K¼
nX
n
i¼1
iSi ð
Xn
i¼1
iÞðX
n
i¼1 SiÞ
nX
n
i¼1 i2
ðX
n
i¼1 iÞ2
ð12Þ
whereSiis the cumulative ET or WY andiis the sequence number of years (i.e., 1 ton).K>0 andK<0indicate that the ET or WY of this pixel increases or decreases over time,
respectively.
A multivariate linear regression analysis was used to measure the contribution of climatic factors and vegetation changes to ET, and vegetation coverage was considered the fixed variable of the stepwise regression equation. Moreover, the main climatic factors were filtered by the stepwise backwards selection method based on the analysis principle of significance, which could eliminate climate variables with minimal predictive effect. Then, the absolute value of the standardization regression coefficient was used to compare the degree to which vegetation and climate affected ET. Thus, the ratio of the absolute values of specific variables to the sum of the absolute values of all variables was the contribution proportion of this variable. Excel 2010 and SPSS 22 were used for the statistical analyses. All of the figures were drawn in Origin 9.2.
Results
Results of model validation
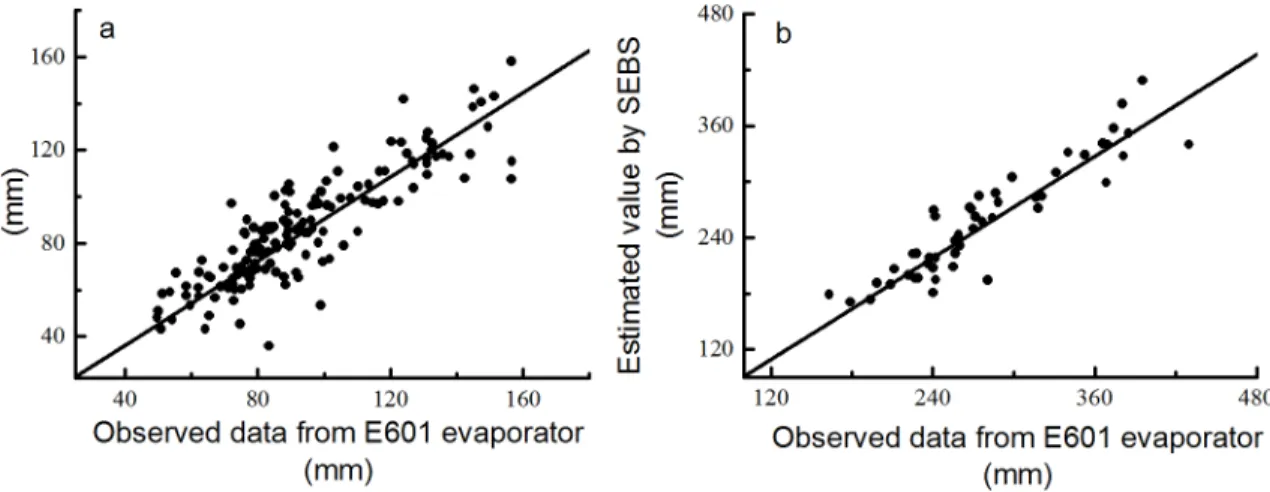
Fig 2shows that the estimated ET was consistent with the value observed by the E601 evapora-tor. Monthly evaporation had an RMSD of 14.24 mm and a MAPE of 11.28%, whereas seasonal evaporation had an RMSD of 32.05 mm and a MAPE of 9.08%. The correlation coefficient between the model-estimated and observed data reached 0.876 and 0.921 at monthly and
Fig 2. Comparison of water surface evaporation between the SEBS model estimation and observed data from E601.Comparison of water surface evaporation over Erhai Lake between the estimated values and actual observed values at different time scales: (a) monthly water surface evaporation, (b) seasonal water surface evaporation.
seasonal time scales, respectively. Therefore, we concluded that the estimated ET by the SEBS model matched the actual situation in NW Yunnan.
Interannual changes in climatic factors and vegetation coverage
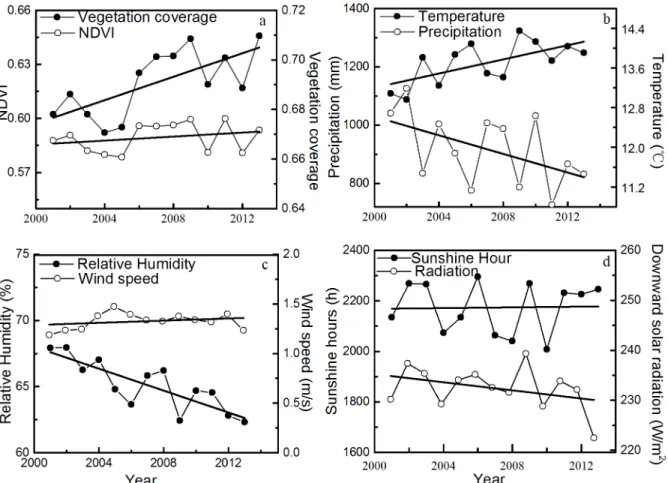
The average annual precipitation and temperature of NW Yunnan varied from 789.41 mm to 1,125.26 mm and from 12.95°C to 14.34°C over the last 13 years, respectively. The linear trend estimation indicated that the temperature significantly increased over time (P<0.05) and the precipitation fluctuated downward but was not statistically significant (Fig 3B). In addition, the average annual relative humidity significantly decreased (R2= 0.683, P<0.01). Other climatic factors (average wind speed at reference height, total sunshine hours, and downward solar radiation) fluctuated over time without clear trends (Fig 3C and 3D). A correlation analysis revealed that the precipitation was positively correlated with relative humidity and negatively correlated with temperature, sunshine hours, and air pressure, whereas air temperature was negatively correlated with relative humidity at the 0.01 significance level (Table 1). The average annual vegetation coverage was 0.69, ranged from 0.67 to 0.72, and showed a significant increasing trend (P<0.01) over time. However, the NDVI fluctuated without an overall trend.
Fig 3. Interannual variations of climate and vegetation coverage.Interannual variations of climate and vegetation coverage: (a) Vegetation coverage and NDVI, (b) temperature and precipitation, (c) relative humidity and wind speed, and (d) sunshine hours and downward solar radiation. Each part of the figure has double Y axes. Each black line represents the linear fit of each variable as a function of the year. Significance tests show that the P-values of (a) vegetation coverage, (b) temperature, and (c) relative humidity were 0.008, 0.017, and 0.000, respectively, whereas the P-values of all other variables were greater than 0.05.
Interannual changes in ET and WY
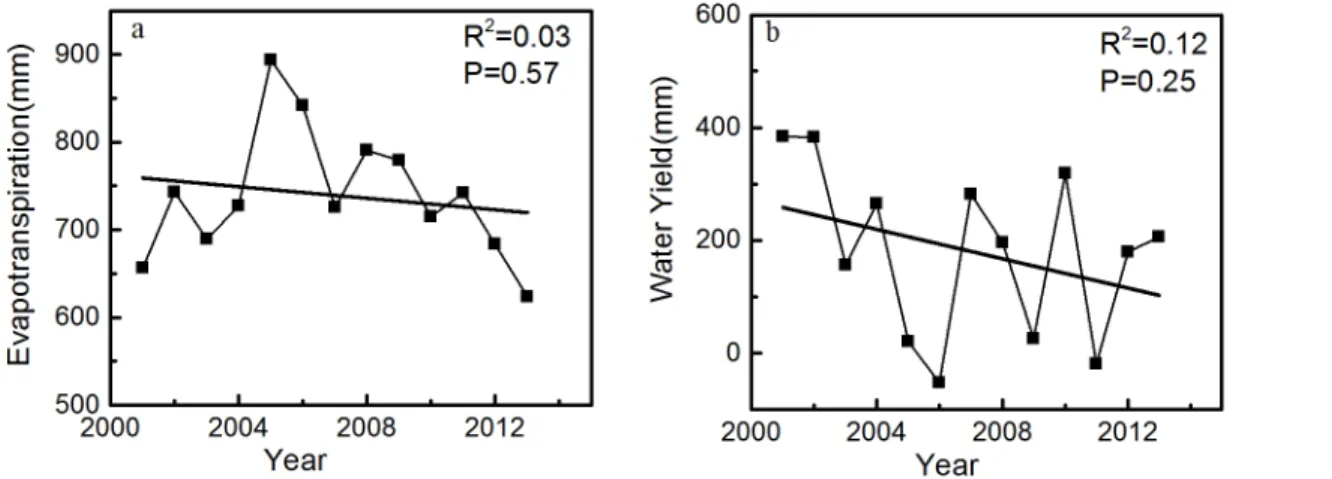
The average annual ET (739.27 mm) was lower than the precipitation (919.74 mm) in this area during the study period. However, the ET reached 841.30 and 742.35 mm and the precipi-tation was only 789.41 and 723.41 mm in 2006 and 2011, respectively, which decreased the WY to below 0 (Fig 4B). The mean ET rate (ratio of ET to precipitation (ET/P)) was 0.80, whereas the WY rate (ratio of WY to precipitation (WY/P)) was only 0.20. Both ET and WY presented considerable fluctuations, with ranging from 623.29 mm to 893.8 mm and−51.88 mm to 384.40 mm, respectively. The ET and WY rates ranged from 0.63 to 1.06 and−0.06 to 0.36, respectively.
Seasonal changes in ET and WY
In general, the highest and lowest ET, precipitation, and WY were recorded in summer and winter, respectively. The mean ET values in spring, summer, autumn, and winter were 219.60,
Table 1. Pearson correlation coefficient matrix of climate variables.
Precipitation Taira RHb Vwindc Paird Hsunshinee Raf
Precipitation 1
Tair -0.713** 1
RH 0.736** -0.890** 1
Vwind -0.291 0.508 -0.434 1
Pair -0.559* 0.660* -0.574* 0.603* 1
Hsunshine -0.590* 0.261 -0.361 -0.16 -0.144 1
Ra -0.15 0.086 0.102 0.248 -0.136 0.405 1
aMean annual air temperature brelative humidity
cwind speed at the reference height dair pressure
etotal annual sunshine hours, and fdownward solar radiation.
Asterisks indicate significant differences for climate variables *indicatesP<0.05
**indicatesP<0.01.
doi:10.1371/journal.pone.0134795.t001
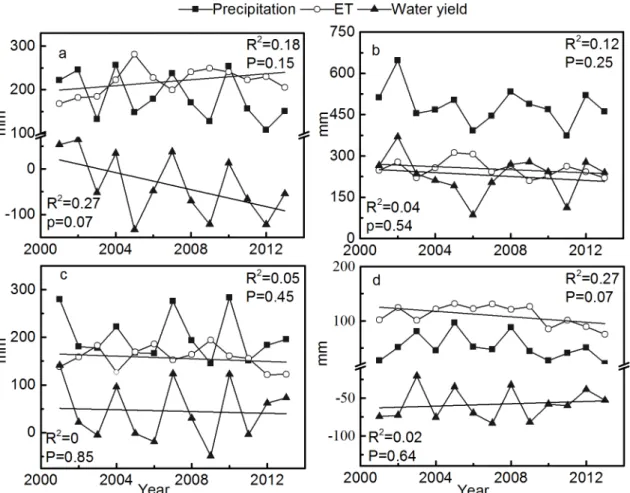
252.95, 156.50, and 110.21 mm, respectively. Furthermore, the mean ET values in spring and winter were higher than the precipitation values, resulting in higher ET rates and lower WY rates. The average ET rates in spring, summer, autumn, and winter were 1.30, 0.53, 0.83, and 2.42, respectively, and significant trends were not observed. The WYs of the four seasons also did not show significant trends during the research period, although the WYs in spring decreased more obviously than in any other season because of increasing ET and decreasing precipitation (Fig 5).
Spatial variation of ET and WY
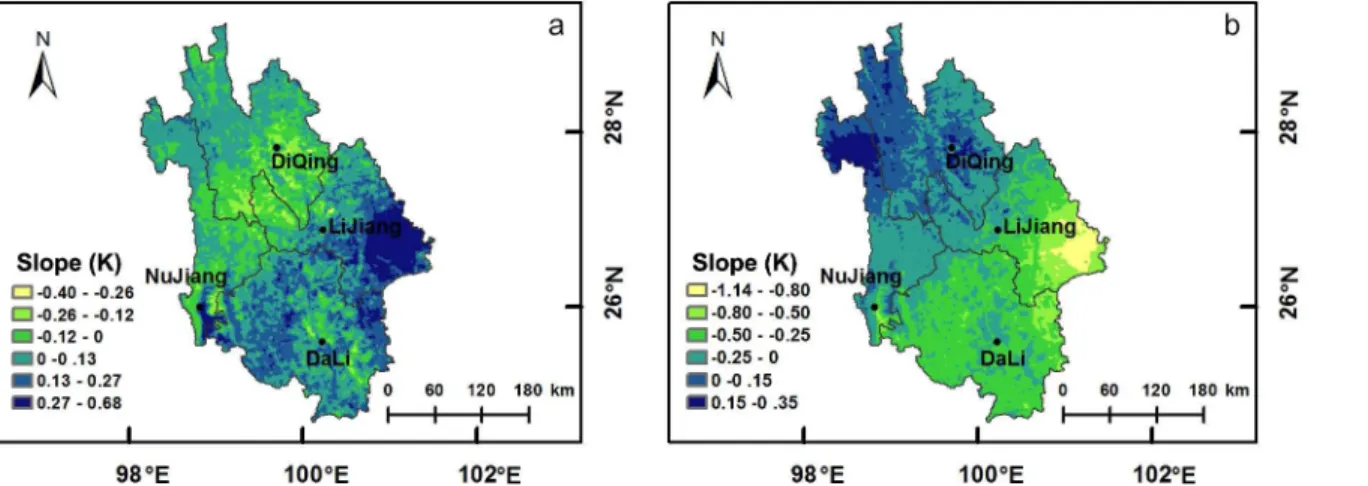
Fig 6illustrates the variations in ET and WY with time in NW Yunnan. The results of the linear least squares method show that the ET slope exceeded 0 in the southeast area of NW Yunnan, which was primarily in the Dali Bai Autonomous Prefecture and Lijiang City. However, this slope was less than 0 in northwest area of NW Yunnan, which was inaccessible and geographi-cally remote (Fig 6A). Thus, the ET in Dali and Lijiang increased with time, whereas it decreased with time in Diqing and Nujiang. Moreover, F-test showed that ET significantly increased in Lijiang (S1a Fig), where the vegetation coverage also had a significant increase trend (Fig 1). On the other hand, the trend of WY was almost the exact opposite to that of ET (Fig 6BandS1b Fig), which suggests that WY decreased with increasing ET.
Fig 5. Seasonal changes of ET and WY.Seasonal changes of ET and WY: (a) spring, (b) summer, (c) autumn, and (d) winter. The unit of ET, WY, and precipitation is mm per three months. The trends of seasonal ET and WY are analyzed by linear trend estimation.
Correlations of ET with climate factors and vegetation coverages
Annual time series data of ET and WY were used for multivariate linear regression analysis. The standardized regression equations are listed inTable 2, and the R2values of the regression equations were 0.76, 0.88, 0.90, and 0.88, and each equation reached a significant level (Table 2). The variance inflation factor (VIF) of all variables in the four regression equations was less than 5, which indicated minimal multicollinearity among independent variables. The absolute values of the independent variables in the ET regression equation were ordered as follows: wind speed>relative humidity>vegetation coverage>sunshine hours. Vegetation coverage accounted for 14.82% of the ET (0.426/2.874), and all climatic factors accounted for 85.18% (2.448/2.874) of the ET, which indicated that climatic factors (wind speed, relative humidity, and sunshine hours) were the main cause of ET and vegetation coverage played an integral, although not decisive, role. ET rates, WY, and WY rates were mainly affected by climatic fac-tors, which accounted for 98.92%, 98.88%, and 98.92% of the values, respectively. Precipitation was the main factor that influenced ET rates, WY, and WY rates, and the ratios of precipitation to the total regression coefficient were 53.1%, 67.5%, and 53.1%, respectively. Moreover, pre-cipitation was positively correlated with the WY and WY rate but negatively correlated with
Fig 6. Spatial variations of ET and WY.Maps displaying the slope of ET and WY by linear trend estimation: (a) ET and (b) WY. K>0 and K<0 in any pixels
indicate increasing and decreasing trends over time, respectively.
doi:10.1371/journal.pone.0134795.g006
Table 2. Regression analysis of ET and WY.
Dependent variable Standardized regression equation R2 F P
ET Y = 0.856RHa+1.199Vwindb+0.393Hsunshinec+0.426Fcd 0.758 6.272 0.014
ET rate Y = -0.686Pe+0.331Vwind+0.260Raf+0.014Fc 0.883 15.09 0.001
WY Y = 0.782P-0.362Vwind+0.013Fc 0.901 27.169 0.000
WY rate Y = 0.686P-0.331Vwind-0.260Ra-0.014Fc 0.883 15.09 0.001
aRelative humidity
bwind speed at the reference height ctotal annual sunshine hours dvegetation fraction eprecipitation, and fdownward solar radiation.
the ET rate. This result indicated that the ET rate increased and WY decreased with decreasing precipitation.
Discussion
Studies have shown that anomalous monsoons induced by ENSO cause weak atmospheric cir-culation, which results in precipitation deficits in Yunnan [16,19,23]. Li et al. (2011) also found that precipitation decreased in the Hengduan Mountains after 2000 [60], which was likely caused by the warm and dry climate [17]. From the perspective of WY, We found that climatic factors (precipitation) greatly influenced the WY (Table 2), and the precipitation defi-ciency could be considered a main reason for the droughts, which is consistent with the find-ings of Lü et al. (2012), who studied the physical causes of the severe droughts in the region and drew the same conclusion [18].
In addition, vegetation coverage also explained the changes in WY or ET (Table 2). We found that the contribution of vegetation coverage was small (14.82%) but could not be ignored. Theoretically, climatic factors and human activities are both responsible for vegetation coverage changes, e.g., temperature affects plant phenology or vegetation seasonal dynamics [61,62], and precipitation positively correlates with vegetation coverage [63,64]. In NW Yun-nan, vegetation coverage markedly increased when precipitation decreased (Table 1), indicat-ing that precipitation was not the major cause of the increased vegetation coverage. We believe that the afforestation/reforestation in recent decades has been the driver of vegetation recovery in Yunnan which has experienced an increase in forest cover from 34% in 1997 to 50% in 2006 with afforestation programs, such as the Natural Forest Protection Program [65]. Plantation forests cover 3.26 million ha, which only account for 17.97% of the total woodland, but the annual growth rate is 17.72% which is greater than that of natural forests (4.08%) [66]. More-over, Greenpeace indicated that most of the primary forests were replaced by secondary forests (71.18%) and artificial forest (approximately 20%) [32]. Thus, the forest quality deteriorated, despite the cover increasing in recent decades [31,67]. Studies have shown that the increased ET caused by afforestation/reforestation could reduce WY or runoff [26,68,69] and the ET of fast-growing plantation forests was much higher than that of natural primary forests [70–73]. Moreover, in NW Yunnan, remarkable encroachment of woody-plants has been observed in alpine meadows from 1950 to 2009, and at least 39% of the alpine meadows have been con-verted to woody shrubs [74]. The encroachment of woody plants could also increase the ET of an ecosystem [69].
Spatio-temporal variability of ET and WY matched the actual drought events in Dali and Lijiang in springs (CCTV:http://english.cntv.cn/program/china24/20120214/110226.shtml). Dali and Lijiang had a large area of secondary forests of Yunnan pine (Pinus yunnanensis), a tree species that is commonly used in afforestation/reforestation [36,75], whereas the primary natural forests mainly occurred in remote areas, such as Nujiang and Diqing. Differences in the location of primary and secondary growth forests might be one of the reasons for differentiated ET among these prefectures. Although the transpiration data for Yunnan pine forests were unavailable, pine artificial forests have been proven to have higher water consumption than natural forests worldwide [70,71]. However, Zhang et al. (2011) found that primary and old-growth dark coniferous forests in Southwest China had a lower annual ET and a higher annual WY than shrub lands, regenerated forests, and spruce plantations [76]. Therefore, attention should be paid to ecohydrological effects of human-driven land-cover changes, because higher ET usually implies less water available for human use [77].
et al. (2014) [80], and we found that the water consumption for primary industry, second industry, tertiary industry and domestic use already accounted for 49.15% of the WY. Primary industry and domestic uses accounted for 75.94% of the total demands and only 9.43% of the total demands was used for industry development. These results indicate that most of the WY was used for subsistence and agricultural production. Because of the poor infrastructure used to extract river water from upstream areas, water provisions from local ecosystems are essential in the mountainous areas of NW Yunnan. Therefore, even a slight ET increase as a result of vegetation changes could significantly increase the system's vulnerability to climate change, especially in rural areas.
Conclusion
Water deficiencies caused by abnormal climate were the primary cause of continuous droughts in NW Yunnan; however, the increased ET resulting from human-driven land-cover and vegetation changes also exacerbated the water shortages. Local human systems are highly vul-nerable to climatic drought in term of the water resources provided by its ecosystems. Human disturbances to natural forests as well as massive afforestation/reforestation with several fast-growing tree species are harmful to native biodiversity and increase the system’s vulnerability to climate change. In addition to developing infrastructure to mitigate the impacts of droughts, such as irrigation systems and reservoirs, we strongly suggest increasing the conservation efforts related to native vegetation and developing water-conserving agricultural techniques as adaptive strategies to climate change.
Supporting Information
S1 Fig. The trend of ET and WY from 2001 to 2013.The trend of ET and WY: (a) the trend of ET, (b) the trend of WY. F-test is used to test significance of the slopes inFig 6. The maps are reclassified into different categories according to different significance levels: very signifi-cantly (P<0.01), significantly (P<0.05), and slightly (P>0.05).
(TIF)
Acknowledgments
We thank the Climatic Data Center, National Meteorological Information Center, China Mete-orological Administration for providing meteMete-orological data and NASA for providing the free-downloaded MODIS data.
Author Contributions
Conceived and designed the experiments: HY PL. Performed the experiments: HY JW CM LM ZW YF. Analyzed the data: HY. Contributed reagents/materials/analysis tools: PL HL YY. Wrote the paper: HY PL LDB.
References
1. Gitay H, Suárez A, Watson RT, Dokken DJ. Climate change and biodiversity. Intergovernmental Panel on Climate Change, Geneva,Switzerland; 2002.
3. Berrang-Ford L, Ford JD, Paterson J. Are we adapting to climate change? Global Environ Chang. 2011; 21: 25–33. doi:10.1016/j.gloenvcha.2010.09.012
4. Chen M, Sun F, Berry P, Tinch R, Ju H, Lin E. Integrated assessment of China’s adaptive capacity to cli-mate change with a capital approach. Climatic Change. 2014; 128: 367–380. doi: 10.1007/s10584-014-1163-7
5. Yang Y, Tian K, Hao J, Pei S, Yang Y. Biodiversity and biodiversity conservation in Yunnan, China. Bio-divers Conserv. 2004; 13: 813–826. doi:10.1023/B:BIOC.0000011728.46362.3c
6. Cai G, Du M, Liu Y. Regional Drought Monitoring and Analyzing Using MODIS Data—A Case Study in Yunnan Province. In: Li DL, Liu Y and Chen YY, editors. Computer and Computing Technologies in Agriculture IV. Berlin, German: Springer Berlin Heidelberg. 2011; pp. 243–251.
7. Qiu J. China drought highlights future climate threats. Nature. 2010; 465: 142–143. doi:10.1038/ 465142aPMID:20463708
8. Su Y, Xu J, Wilkes A, Lu J, Li Q, Fu Y, et al. Coping with climate-induced water stresses through time and space in the mountains of Southwest China. Reg Environ Change. 2012; 12: 855–866. doi:10. 1007/s10113-012-0304-7
9. Dai A. Drought under global warming: a review. Wires Clim Change. 2011; 2: 45–65. doi:10.1002/wcc. 81
10. Delworth TL, Zeng F. Regional rainfall decline in Australia attributed to anthropogenic greenhouse gases and ozone levels. Nat Geosci. 2014; 7: 583–587. doi:10.1038/ngeo2201
11. Cook BI, Miller RL, Seager R. Amplification of the North American "Dust Bowl" drought through human-induced land degradation. P Natl Acad Sci USA. 2009; 106: 4997–5001. doi:10.1073/pnas.
0810200106
12. Fu C. Potential impacts of human-induced land cover change on East Asia monsoon. Global Planet Change. 2003; 37: 219–229. doi:10.1016/s0921-8181(02)00207-2
13. Li S, Xiong LH, Dong LH, Zhang J. Effects of the Three Gorges Reservoir on the hydrological droughts at the downstream Yichang station during 2003–2011. Hydrol Process. 2013; 27: 3981–3993. doi:10. 1002/hyp.9541
14. Zhao C, Deng X, Yuan Y, Yan H, Liang H. Prediction of drought risk based on the wrf model in yunnan province of China. Adv Meteorol. 2013; 2013: 9. doi:10.1155/2013/295856
15. Lyon B, Christie-Blick N, Gluzberg Y. Water shortages, development, and drought in Rockland County, New York. J Am Water Resour As. 2005; 41: 1457–1469. doi:10.1111/j.1752-1688.2005.tb03812.x
16. Du H, Yan J. Climate warming-drying and drought-flood tendency judgment of Sichuan-Yunnan region in recent 51 years. Resources and Environment in the Yangtze Basin. 2014; 23: 715–721.
17. Li Z. Spatial and Temporal Variation of Temperature and Precipitation in Southwestern China. Study on Climate Change in Southwestern China. Berlin, German: Springer Berlin Heidelberg. 2015; pp. 61– 100.
18. Lü J, Ju J, Ren J, Gan W. The influence of the Madden-Julian Oscillation activity anomalies on Yun-nan's extreme drought of 2009–2010. Sci China Earth Sci. 2012; 55: 98–112. doi: 10.1007/s11430-011-4348-1
19. Liu J, Wan J, Tan X, Ma J, Zhang N. Drought in southwest china from autumn 2009 to spring 2010 and its comparative analysis with historical drought events. Journal of disaster prevention and mitigation engineering. 2011; 31: 196–200.
20. Yin H, Li Y. Summary of Advance on Drought Study in Southwest China. J Arid Meteorol. 2013; 31: 182–193.
21. Huang X, Yu F, Li X, Zheng Y, Yuan H, Ma J, et al. Synthesized attributes of water use by regional veg-etation: a key to cognition of "water pump" viewpoint. The Scientific World Journal. 2014; 2014: 10. doi: 10.1155/2014/954849
22. Stone R. Severe Drought Puts Spotlight on Chinese Dams. Science. 2010; 327: 1311–1311. doi:10. 1126/science.327.5971.1311PMID:20223955
23. Zhang W. Did Eucalyptus contribute to environment degradation? Implications from a dispute on causes of severe drought in Yunnan and Guizhou, China. Environmental Skeptics and Critics. 2012; 1: 34–38.
24. Belal AA, El-Ramady HR, Mohamed ES, Saleh AM. Drought risk assessment using remote sensing and GIS techniques. Arab J Geosci. 2012; 7: 35–53. doi:10.1007/s12517-012-0707-2
26. Zhang L, Dawes WR, Walker GR. Response of mean annual evapotranspiration to vegetation changes at catchment scale. Water Resour Res. 2001; 37: 701–708. doi:10.1029/2000wr900325
27. Liu M, Tian H. China's land cover and land use change from 1700 to 2005: Estimations from high-reso-lution satellite data and historical archives. Global Biogeochem Cy. 2010; 24: 18. doi:10.1029/ 2009gb003687
28. Lu Z, Deng X. China's Western Development Strategy: Policies, Effects and Prospects. Munich Per-sonal RePEc Archive. 2011: 1–26.
29. Zhang J, Pham T-T-H, Kalacska M, Turner S. Using Landsat Thematic Mapper records to map land cover change and the impacts of reforestation programmes in the borderlands of southeast Yunnan, China: 1990–2010. Int J Appl Earth Obs. 2014; 31: 25–36. doi:10.1016/j.jag.2014.01.006
30. Brandt JS, Kuemmerle T, Li H, Ren G, Zhu J, Radeloff VC. Using Landsat imagery to map forest change in southwest China in response to the national logging ban and ecotourism development. Remote Sens Environ. 2012; 121: 358–369. doi:10.1016/j.rse.2012.02.010
31. Houghton RA, Hackler JL. Sources and sinks of carbon from land-use change in China. Global Biogeo-chem Cy. 2003; 17: 19. doi:10.1029/2002gb001970
32. Wu H, Yi L, Chen S, Liu B. Natural forest in danger-research report of natural forest in Yunnan [Trans-lated from Chinese]. Greenpeace. 2013; 1: 56. Available:http://www.greenpeace.org/china/Global/ china/publications/campaigns/forests/yn-natural-forest-study.pdf.
33. Melick D, Yang X, Yang Y, Xu J. Establishing long-term biodiversity assessment and monitoring in northwest Yunnan, China: A growing need for baseline information. Mt Res Dev. 2006; 26: 292–294. doi:10.1659/0276-4741(2006)26[292:elbaam]2.0.co;2
34. Morell V. Letting 1000 forests bloom. Science. 2008; 320: 1442–1443. doi:10.1126/science.320.5882. 1442PMID:18556545
35. Tang Z, Wang Z, Zheng C, Fang J. Biodiversity in China's mountains. Front Ecol Environ. 2006; 4: 347–352. doi:10.1890/1540-9295(2006)004[0347:BICM]2.0.CO;2
36. Weyerhaeuser H, Wilkes A, Kahrl F. Local impacts and responses to regional forest conservation and rehabilitation programs in China's northwest Yunnan province. Agr Syst. 2005; 85: 234–253. doi:10. 1016/j.agsy.2005.06.008
37. Xu J, Wilkes A. Biodiversity impact analysis in northwest Yunnan, southwest China. Biodivers Conserv. 2004; 13: 959–983. doi:10.1023/b:bioc.0000014464.80847.02
38. Yang X, Wilkes A, Yang Y, Xu J, Geslani CS, Yang X, et al. Common and privatized: conditions for wise management of matsutake mushrooms in Northwest Yunnan province, China. Ecol Soc. 2009; 14: 30.
39. Yang J. Status and solutions of biodiversity protection in Northwest Yunnan. For Resour Manag. 2002; 3: 61–65.
40. Statistic Bureau of Yunnan Province. Yunnan statistical yearbook. Yunnan, China: Statistic Bureau of Yunnan Province; 2001–2013.
41. Liu Y, Zhou Y, Ju W, Chen J, Wang S, He H, et al. Evapotranspiration and water yield over China's land-mass from 2000 to 2010. Hydrol Earth Syst Sc. 2013; 17: 4957–4980. doi: 10.5194/hess-17-4957-2013
42. Polasky S, Nelson E, Pennington D, Johnson K. The impact of Land-Use Change on ecosystem ser-vices, biodiversity and returns to landowners: A case study in the state of Mnnesota. Environ Resource Econ. 2011; 48: 219–242. doi:10.1007/s10640-010-9407-0
43. Sun G, McNulty SG, Lu J, Amatya DM, Liang Y, Kolka RK. Regional annual water yield from forest lands and its response to potential deforestation across the southeastern United States. J Hydrol. 2005; 308: 258–268. doi:10.1016/j.jhydrol.2004.11.021
44. Su Z, Li X, Zhou Y, Wan L, Wen J, Sintonen K. Estimating areal evaporation from remote sensing. Geo-science and Remote Sensing Symposium, 2003 IGARSS '03 Proceedings 2003 IEEE International New York. 2003; 1.2: 1166–1168. doi:10.1109/IGARSS.2003.1294046
45. Su Z. A Surface Energy Balance System (SEBS) for estimation of turbulent heat fluxes from point to continental scale. In: Su Z and Jacobs CMJ, editors. Advanced Earth Observation, Land Surface Cli-mate. Netherlands: Publications of the National Remote Sensing Board (BCRS), USP-2. 2001; pp. 91–108.
46. Alkhaier F, Su Z, Flerchinger GN. Reconnoitering the effect of shallow groundwater on land surface temperature and surface energy balance using MODIS and SEBS. Hydrol Earth Syst Sc. 2012; 16: 1833–1844. doi:10.5194/hess-16-1833-2012
48. Elhag M, Psilovikos A, Manakos I, Perakis K. Application of the Sebs Water Balance Model in Estimat-ing Daily Evapotranspiration and Evaporative Fraction from Remote SensEstimat-ing Data Over the Nile Delta. Water Resour Manag. 2011; 25: 2731–2742. doi:10.1007/s11269-011-9835-9
49. Ma W, Ma Y, Hu Z, Su Z, Wang J, Ishikawa H. Estimating surface fluxes over middle and upper streams of the Heihe River Basin with ASTER imagery. Hydrol Earth Syst Sc. 2011; 15: 1403–1413. doi:10. 5194/hess-15-1403-2011
50. Su Z. The Surface Energy Balance System (SEBS) for estimation of turbulent heat fluxes. Hydrol Earth Syst Sc. 2002; 6: 85–99. doi:10.5194/hess-6-85-2002
51. Allen RG, Pereira LS, Raes D, Smith M. Crop evapotranspiration—Guidelines for computing crop water requirements. FAO Irrigation and drainage paper 1998: 56.
52. Allen RG, Tasumi M, Trezza R. Satellite-based energy balance for mapping evapotranspiration with internalized calibration (METRIC)—Model. J Irrig Drain E-Asce. 2007; 133: 380–394. doi:10.1061/ (asce)0733-9437(2007)133:4(380)
53. World Meteorological Organization (1976) The CIMO international evaporimeter comparisons. Final Report No 449. Geneva. pp. 6.
54. Fu G, Charles SP, Yu J. A critical overview of pan evaporation trends over the last 50 years. Climatic Change. 2009; 97: 193–214. doi:10.1007/s10584-009-9579-1
55. Wang Y, Huang H. The calculation and features of evaporation in Erhai lake [Translated from Chinese]. Science and Technology of Dali. 2007; 2: 9–13.
56. Jing X, Yao W, Wang J, Song X. A study on the relationship between dynamic change of vegetation coverage and precipitation in Beijing’s mountainous areas during the last 20 years. Math Comput Model. 2011; 54: 1079–1085. doi:10.1016/j.mcm.2010.11.038
57. Liu L, Jing X, Wang J, Zhao C. Analysis of the changes of vegetation coverage of western Beijing mountainous areas using remote sensing and GIS. Environ Monit Assess. 2009; 153: 339–349. doi: 10.1007/s10661-008-0360-0PMID:18516693
58. Gutman G, Ignatov A. The derivation of the green vegetation fraction from NOAA/AVHRR data for use in numerical weather prediction models. Int J Remote Sens. 1998; 19: 1533–1543. doi:10.1080/ 014311698215333
59. Wu B, Li M, Yan C, Zhou W. Developing method of vegetation fraction estimation by remote sensing for soil loss equation: a case in the upper basin of Miyun Reservoir. IEEE International Geoscience and Remote Sensing Symposium Proceedings, Anchorage, AK. 2004; 6: 4352–4355. doi:10.1109/ IGARSS.2004.1370101
60. Li Z, He Y, Wang C, Wang X, Xin H, Zhang W, et al. Spatial and temporal trends of temperature and precipitation during 1960–2008 at the Hengduan Mountains, China. Quatern Int. 2011; 236: 127–142. doi:10.1016/j.quaint.2010.05.017
61. Chen F, Weber KT. Assessing the impact of seasonal precipitation and temperature on vegetation in a grass-dominated rangeland. Rangeland J. 2014; 36: 185–190. doi:10.1071/RJ13098
62. Yu H, Luedeling E, Xu J. Winter and spring warming result in delayed spring phenology on the Tibetan Plateau. P Natl Acad Sci USA. 2010; 107: 22151–22156. doi:10.1073/pnas.1012490107
63. Xu X, Yang D, Sivapalan M. Assessing the impact of climate variability on catchment water balance and vegetation cover. Hydrol Earth Syst Sc. 2012; 16: 43–58. doi:10.5194/hess-16-43-2012
64. Yang D, Shao W, Yeh PJF, Yang H, Kanae S, Oki T. Impact of vegetation coverage on regional water balance in the nonhumid regions of China. Water Resour Res. 2009; 45. doi:10.1029/2008WR006948
65. Frayer J, Sun Z, Müller D, Munroe DK, Xu J. Analyzing the drivers of tree planting in Yunnan, China, with Bayesian networks. Land Use Policy. 2014; 36: 248–258. doi:10.1016/j.landusepol.2013.08.005
66. State Forestry Administration of the People's Republic of China. Seventh National Forest Resource Inventory Report (2004–2008). Beijing, china: State Forestry Administration of the People's Republic of China; 2009.
67. Frayer J, Müller D, Sun Z, Munroe D, Xu J. Processes Underlying 50 Years of Local Forest-Cover Change in Yunnan, China. Forests. 2014; 5: 3257–3273. doi:10.3390/f5123257
68. Brown AE, Zhang L, McMahon TA, Western AW, Vertessy RA. A review of paired catchment studies for determining changes in water yield resulting from alterations in vegetation. J Hydrol. 2005; 310: 28– 61. doi:10.1016/j.jhydrol.2004.12.010
69. Scoot DF, Prinsloo FW, Moses G. A re-analysis of the South African afforestation experimental data. South Africa: Water Research Commission; 2000.
71. Licata JA, Gyenge JE, Fernandez ME, Schlichter TA, Bond BJ. Increased water use by ponderosa pine plantations in northwestern Patagonia, Argentina compared with native forest vegetation. Forest Ecol Manag. 2008; 255: 753–764. doi:10.1016/j.foreco.2007.09.061
72. Macfarlane C, Bond C, White DA, Grigg AH, Ogden GN, Silberstein R. Transpiration and hydraulic traits of old and regrowth eucalypt forest in southwestern Australia. Forest Ecol Manag. 2010; 260: 96–105. doi:10.1016/j.foreco.2010.04.005
73. Tan ZH, Zhang YP, Song QH, Liu WJ, Deng XB, Tang JW, et al. Rubber plantations act as water pumps in tropical China. Geophys Res Lett. 2011; 38: L24406. doi:10.1029/2011gl050006
74. Brandt JS, Haynes MA, Kuemmerle T, Waller DM, Radeloff VC. Regime shift on the roof of the world: Alpine meadows converting to shrublands in the southern Himalayas. Biol Conserv. 2013; 158: 116– 127. doi:10.1016/j.biocon.2012.07.026
75. Wang Z, Lu Y. Compensation for the Conversion of Sloping Farmland to Forest in China: A Feasibility Study of Payment Based on Carbon Sink. The Journal of Environment & Development. 2010; 19: 28– 41. doi:10.1177/1070496509338838
76. Zhang Y, Liu S, Gu F. The impact of forest vegetation change on water yield in the subalpine region of southwestern China. Acta Ecol Sin. 2011; 31: 7601–7609.
77. Weiß M, Schaldach R, Alcamo J, Flörke M. Quantifying the human appropriation of fresh water by Afri-can agriculture. Ecol Soc. 2009; 14: 25.
78. Water Resources Department of Yunnan Province. Yunnan Province water resource bulletin. Yunnan, China: Water Resources Department of Yunnan Province; 2001–2013.
79. Quality and Technical Supervision Bureau of Yunnan Province. Provincial standard of Yunnan–water quota (DB53/T 186–2013). Yunnan, China: Quality and Technical Supervision Bureau of Yunnan Prov-ince; 2013.