Validation and Recalibration of Two
Multivariable Prognostic Models for Survival
and Independence in Acute Stroke
Julius Sim1*, Lucy Teece1, Martin S. Dennis2, Christine Roffe3,4, SO2S Study Team¶
1Institute for Primary Care and Health Sciences, Keele University, Keele, United Kingdom,2Centre for Clinical Brain Sciences, University of Edinburgh, Edinburgh, United Kingdom,3Stroke Research in Stoke, University Hospitals of North Midlands NHS Trust, Stoke-on-Trent, United Kingdom,4Institute for Science and Technology in Medicine, Keele University, Keele, United Kingdom
¶ Membership of the SO2S Study Team is listed in the Acknowledgments.
Abstract
Introduction
Various prognostic models have been developed for acute stroke, including one based on age and five binary variables (‘six simple variables’model; SSVMod) and one based on age plus scores on the National Institutes of Health Stroke Scale (NIHSSMod). The aims of this study were to externally validate and recalibrate these models, and to compare their predic-tive ability in relation to both survival and independence.
Methods
Data from a large clinical trial of oxygen therapy (n= 8003) were used to determine the dis-crimination and calibration of the models, using C-statistics, calibration plots, and Hosmer-Lemeshow statistics. Methods of recalibration in the large and logistic recalibration were used to update the models.
Results
For discrimination, both models functioned better for survival (C-statistics between .802 and .837) than for independence (C-statistics between .725 and .735). Both models showed slight shortcomings with regard to calibration, over-predicting survival and under-predicting independence; the NIHSSMod performed slightly better than the SSVMod. For the most part, there were only minor differences between ischaemic and haemorrhagic strokes. Logistic recalibration successfully updated the models for a clinical trial population.
Conclusions
Both prognostic models performed well overall in a clinical trial population. The choice between them is probably better based on clinical and practical considerations than on sta-tistical considerations.
a11111
OPEN ACCESS
Citation:Sim J, Teece L, Dennis MS, Roffe C, SO2S Study Team (2016) Validation and Recalibration of Two Multivariable Prognostic Models for Survival and Independence in Acute Stroke. PLoS ONE 11(5): e0153527. doi:10.1371/journal.pone.0153527
Editor:Gianpaolo Reboldi, University of Perugia, ITALY
Received:August 11, 2015
Accepted:March 30, 2016
Published:May 26, 2016
Copyright:© 2016 Sim et al. This is an open access article distributed under the terms of theCreative Commons Attribution License, which permits unrestricted use, distribution, and reproduction in any medium, provided the original author and source are credited.
Data Availability Statement:All relevant data are within the paper and its Supporting Information files.
Funding:This work was supported by the National Institute for Health Research (NIHR) Health Technology Assessment (HTA) programme (project number 09/104/21). The funders had no role in study design, data collection and analysis, decision to publish, or preparation of the manuscript.
Introduction
There is current interest in the development and testing of prognostic models in acute stroke. Such models provide estimates of outcome for individual patients based on a number of pre-dictors [1]. They may also be useful in audit and resource allocation at the service level. In research, prognostic models may provide important epidemiological data, and may be used to determine case-mix and/or subgrouping in intervention studies [2].
Prognostic models in stroke are characteristically based upon information on the individu-al’s health and functional capacity at the time of–or immediately preceding–the stroke and clinimetric measures indicating stroke severity [3,4]. A well-performing prognostic model should exhibit discrimination, calibration, parsimony and practicality (seeBox 1for definitions).
Teale et al [8] reviewed 17 externally validated prognostic models in acute stroke. Methodo-logical weaknesses were identified in a number of these models, and some lacked appropriate validation in independent samples. Two models that were found to perform well are the six simple variables model (SSVMod) [9] and the NIHSS + age model (NIHSSMod) [10].
The prognostic models
The SSVMod was developed in data from the Oxford Community Stroke Project, a commu-nity-based incidence study of first-ever stroke [9], and is based upon six variables: age, as a con-tinuous variable, and five binary variables, coded yes/no (living alone; independent pre-stroke; normal Glasgow Coma Scale verbal score [4]; able to lift both arms against gravity; able to walk unaided). Patients on whom the SSVMod was developed were assessed at a median of 4 days post stroke. Predictions can be derived for 30-day survival and for independence at 6 months.
The more recent NIHSSMod was developed from a database in the Stiftung Deutsche Schla-ganfall-Hilfe, a data bank representing a hospital-based cohort [10], and is based on two vari-ables: age and the National Institutes of Health Stroke Scale (NIHSS) [3], which provides a single score for stroke severity based on 13 items. Patients were assessed on the NIHSS within 6 hours of the stroke. This model allows probabilities to be calculated for both death and depen-dence (operationalized in the model as‘incomplete recovery’) at 100 days post stroke.Table 1 gives details of the models.
Both these models have been individually validated in several studies [11–16]; seeTable 2. However, their relative performance has received little attention. A recent study [16] compared
Box 1. Desirable properties of prognostic models
Discrimination(accuracy of classification): The model should correctly classify individu-als in terms of a positive (e.g. functional recovery) or negative (e.g. death) future state, and thereby exhibit high levels of sensitivity and specificity [5].
Calibration(accurate estimates of risk): The model should correctly predict, for a given risk, the proportion of patients who will achieve a specified future state. This is achieved by determining how well the probabilities derived from the model agree with observed outcomes [5].
Parsimony: The model should achieve good discrimination and calibration on the basis of a manageable quantity of information derived from data likely to be available for most, or preferably all, patients [6].
the NIHSSMod with the SSVMod and an adaptation of the SSVMod in which one variable (the score for living alone) was omitted, in relation to independence at 3 and 12 months. The NIHSSMod produced measures of calibration slightly superior to those of the SSVMod (though not significantly). The models performed comparably in patients with haemorrhagic versus ischaemic strokes [16]. No attempt to recalibrate the models (i.e. to adjust their coeffi-cients) appears to have been made hitherto.
Aims
The current study therefore sought to evaluate further the discrimination and calibration of the SSVMod and the NIHSSMod in a cohort of stroke patients from a randomized controlled trial. Specific aims were to:
Table 1. Details of the original predictive models [9,11].
Model Coefficients
Constant NIHSS Age Living
alone: yes Independent pre-stroke: yes Normal GCS verbal score; yes
Able to life both arms against
gravity; yes
Able to walk unaided; yes
SSVMod–survival* –‡ –
multiply by 0.034
–0.406 + 0.501 + 0.766 + 0.851 + 0.489
SSVMod—
independence† 12.340
– multiply by
–0.051
+ 0.661 –2.744 –2.160 –2.106 –1.311
NIHSSMod—
mortality†
–7.040 multiply by 0.155 multiply by 0.049 – – – – – NIHSSMod— independence†
–5.782 multiply by 0.272
multiply by 0.049
– – – – –
*Cox survival model
†
Logistic regression model
‡
Baseline survival at 30 days = 0.631 doi:10.1371/journal.pone.0153527.t001
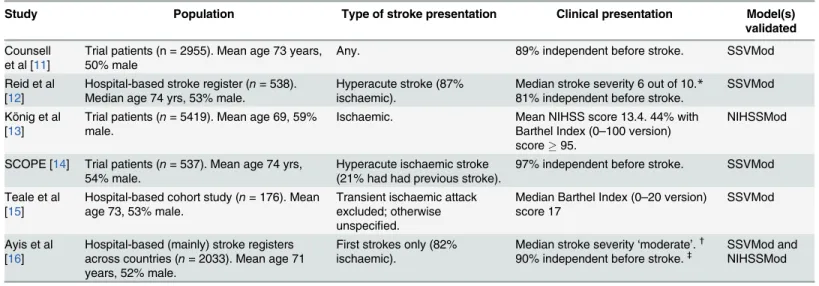
Table 2. Characteristics of previous validation studies.
Study Population Type of stroke presentation Clinical presentation Model(s)
validated
Counsell et al [11]
Trial patients (n = 2955). Mean age 73 years, 50% male
Any. 89% independent before stroke. SSVMod
Reid et al [12]
Hospital-based stroke register (n= 538). Median age 74 yrs, 53% male.
Hyperacute stroke (87% ischaemic).
Median stroke severity 6 out of 10.* 81% independent before stroke.
SSVMod König et al
[13]
Trial patients (n= 5419). Mean age 69, 59% male.
Ischaemic. Mean NIHSS score 13.4. 44% with Barthel Index (0–100 version) score95.
NIHSSMod
SCOPE [14] Trial patients (n= 537). Mean age 74 yrs, 54% male.
Hyperacute ischaemic stroke (21% had had previous stroke).
97% independent before stroke. SSVMod Teale et al
[15]
Hospital-based cohort study (n= 176). Mean age 73, 53% male.
Transient ischaemic attack excluded; otherwise unspecified.
Median Barthel Index (0–20 version) score 17
SSVMod
Ayis et al [16]
Hospital-based (mainly) stroke registers across countries (n= 2033). Mean age 71 years, 52% male.
First strokes only (82% ischaemic).
Median stroke severity‘moderate’.†
90% independent before stroke.‡ SSVMod and
NIHSSMod
*High scores indicate greater severity
†
Based on NIHSS score between 5 and 14
‡
• determine the external validity of the models by comparing their performance in an external data set different from those of the original derivation studies.
• compare their performance in subgroups of patients with either ischaemic or haemorrhagic strokes.
• compare the predictive ability of the models and their generalizability to timepoints other than those on which they were developed.
• recalibrate the models in a clinical trial population.
Methods
Data
The models were validated in a cohort of patients from the Stroke Oxygen Study [17], a large (n= 8003) randomized trial of oxygen therapy in hospitalized patients with acute stroke, recruited in 136 collaborating centres in the UK between 2008 and 2013. The inclusion criteria for the trial were that patients must have had a stroke within the preceding 24 hours and have no definite indications for, or definite contraindications against, oxygen therapy. Exclusion cri-teria were patients with other serious life-threatening conditions likely to lead to death within the following few months (who would, therefore, be unlikely to benefit from oxygen treat-ment), or patients in whom stroke was not the main clinical problem. Patients were treated in the first 72 hours with either continuous oxygen, nocturnal oxygen, or no oxygen. We analysed the 8003 patients who had reached at least the three-month outcome point–with no missing values in respect of the predictor variables in the models–at the time of the present study. Sub-groups of patients with either ischaemic (n= 6369) or haemorrhagic (n= 559) strokes were identified (these do not comprise the total study sample, as the nature of 1075 patients’stroke was undetermined).
The outcomes of independence and incomplete recovery were defined in relation to a score
<3 on the Oxford Handicap Scale (OHS) [18] and a score>95 on the Barthel Index (0–100
version)[19], respectively–as per the original studies [9,10]. To make the models comparable, probabilities for death and incomplete recovery were converted to those for survival and com-plete recovery, respectively. The modified Rankin Scale (mRS) was used in the validation sam-ple as a proxy for the OHS, as the relevant cutoffs are equivalent [18]. Follow-up data on the mRS were collected by post, or by telephone in the case of non-responders.
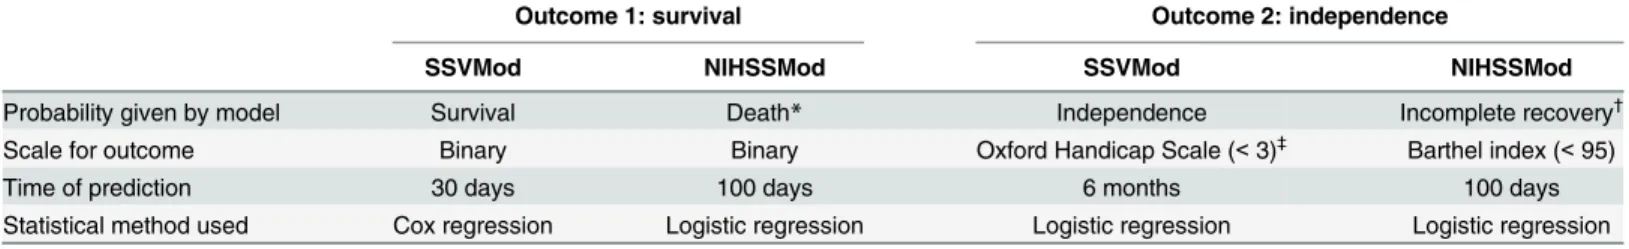
Table 3defines the outcomes against which the models were tested. The timepoints at which outcomes were assessed differed in one respect from those for which the models were
Table 3. Characteristics of the prognostic models.
Outcome 1: survival Outcome 2: independence
SSVMod NIHSSMod SSVMod NIHSSMod
Probability given by model Survival Death* Independence Incomplete recovery†
Scale for outcome Binary Binary Oxford Handicap Scale (<3)‡
Barthel index (<95)
Time of prediction 30 days 100 days 6 months 100 days
Statistical method used Cox regression Logistic regression Logistic regression Logistic regression *converted to survival for analysis
†
converted to complete recovery for analysis
‡
developed–the NIHSSMod was assessed at 100 days rather than 6 months. The data used for the testing of the models is inS1 Data.
Validation methods
The prognostic characteristics of the models to be tested werediscrimination(the ability of the model to distinguish participants with the outcome from those without) andcalibration(the extent to which outcomes predicted by the model in specified risk-defined subgroups are similar to those observed in the validation dataset) [5]. Statistical analysis was performed in Stata 13.
The discrimination of the models was assessed using the concordance (C) statistic; for binary outcomes this is equivalent to the area under the receiver operating characteristic (ROC) curve [20], which plots sensitivity against 1 minus specificity. The C-statistic normally ranges from .5 to 1, with a value of 1 representing perfect discrimination and a value of .5 representing discrimi-nation no better than chance. C-statistics were determined in relation to the observed binary out-comes (survived/died; independent/dependent) at the relevant timepoints. The difference between the C-statistics estimated for the models was tested statistically for each outcome [21].
The calibration of the models was displayed using calibration plots, which plot the model predictions against grouped observations in the data. For a well-calibrated model, the plotted markers should lie on or near the diagonal reference line. Calibration in the large (mean cali-bration) of the models was tested by comparing the observed and predicted outcomes of the model in a logistic regression model, with the risk score as an offset variable; a non-significant difference between predicted and observed outcomes indicates good calibration. Calibration was further tested by using a Hosmer-Lemeshow (HL) goodness of fit statistic, which compares observed and predicted outcomes in groups of patients. More than one method of grouping is recommended [20], and the HL statistic was therefore calculated in relation to deciles of risk, deciles of patient numbers, and the maximum number of groups (up to 100, with group size5). A non-significant HL test indicates good calibration. The magnitude of miscalibra-tion was calculated as the calibramiscalibra-tion slope. This is the regression slope of the linear predictor, and the closer the slope coefficient is to 1, the better the calibration [22]. A slope below 1 may indicate unduly extreme predictions (i.e. low predictions were too low and high predictions were too high) whereas a slope greater than 1 may indicate that predictions do not vary suffi-ciently (i.e. predicted risks are too low)[23,24].
Model recalibration
The models were updated by a process of recalibration. First, the models were updated using recalibration in the large, which adjusts the average predicted probability so that it equals the observed event rate. This method can be applied when a difference in the outcome incidence is suspected [25]. Second, the models were updated by logistic recalibration [26], which corrects the mean calibration and adjusts the regression coefficients of the predictor by a single adjust-ment factor. This method can be applied when the coefficients of the original model may have been over-fitted; it assumes the relative effects of the predictors are similar but allows the pre-dictors to have a larger or smaller effect. SeeAppendixfor details of these methods.
Ethics
it. These patients were not excluded from the trial as a considerable proportion of acute stroke patients will have receptive and/or expressive problems and it was considered important for the trial results to be generalizable to these patients. The Ethics Committee approved this con-sent procedure.
Results
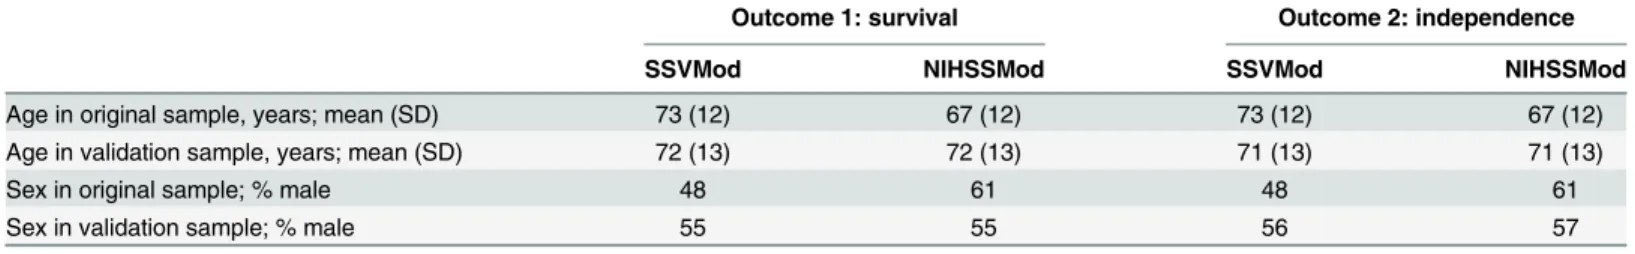
Demographic characteristics of the original and the validation samples are shown inTable 4. The age of patients in the validation sample was similar to that of patients in the SSVMod development sample, but somewhat higher than that of patients in the NIHSSMod develop-ment sample. Sex distribution also differs, with a higher proportion of males in the validation sample than in the SSVMod development sample but a smaller proportion than in the NIHSS-Mod development sample. The median (interquartile range [IQR]) SSVNIHSS-Mod risk scores for independence and survival in the validation sample were .427 (.120, .712) and .921 (.859, .955), respectively. The median (interquartile range) NIHSSMod risk scores in the validation sample for incomplete recovery and death were .316 (.174, .603) and .071 (.040, .135), respectively. Ninety-two percent of patients in the validation sample were independent prior to their stroke. Twenty-six percent were able to walk unaided at the time of randomization.
Discrimination
Fig 1shows the ROC curves for survival and independence for the SSVMod (plotsaandc) and the NIHSSMod (plotsbandd), for the whole sample.Table 5shows the corresponding C-statistics and tests for difference for the total sample, andTable 6shows the corresponding infor-mation for the subgroups. Overall, C-statistics for survival exceed those for independence, indi-cating better discrimination. In the subgroups, other than for 30-day survival, discrimination appears slightly worse for haemorrhagic than for ischaemic strokes. For 6-month independence, C-statistics from the NIHSSMod are larger than those from the SSVMod, except among haemor-rhagic strokes, whereas for 3-month independence C-statistics from the SSVMod exceed those from the NIHSSMod; the C-statistic for the NIHSSMod among haemorrhagic strokes is particu-larly low at .684. Each model therefore discriminates somewhat better with respect to its‘own’
outcome, though it should be noted that a number of the differences in C-statistics were non-sig-nificant. Discrimination also tends to be better for earlier than for later outcomes.
Calibration
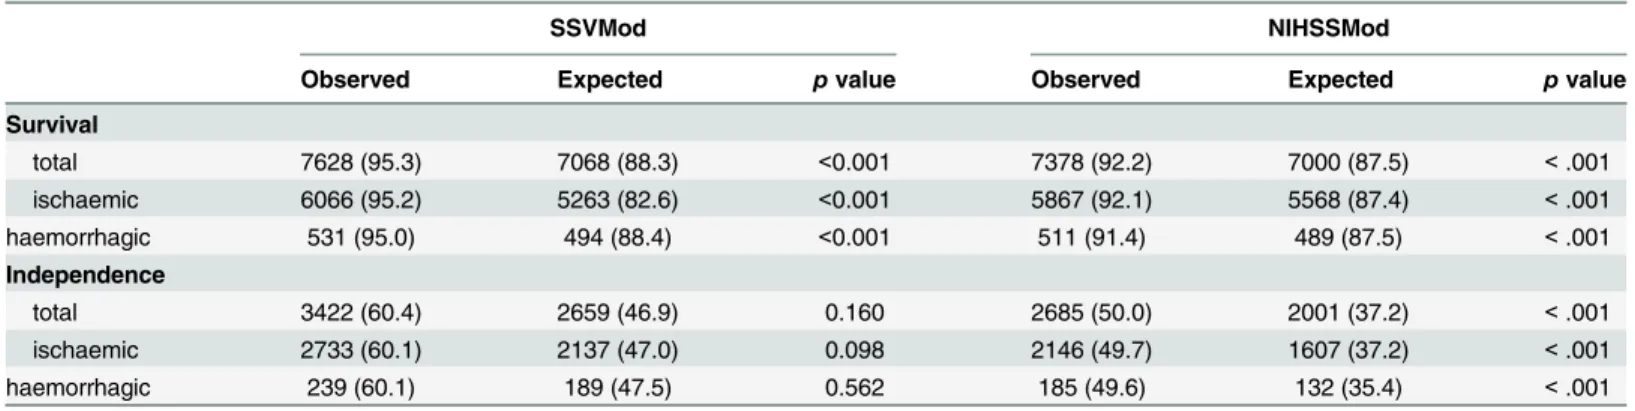
Calibration in the large for the two outcomes is shown for each model inTable 7. Both models under-predicted the number of patients surviving at 30 and 100 days and over-predicted the number independent at 3 (NIHSSMod) and 6 months (SSVMod); thepvalues from the logistic regression test indicate that the discrepancy was not, however, significant in respect of
Table 4. Demographic characteristics of the original and validation samples.
Outcome 1: survival Outcome 2: independence
SSVMod NIHSSMod SSVMod NIHSSMod
Age in original sample, years; mean (SD) 73 (12) 67 (12) 73 (12) 67 (12)
Age in validation sample, years; mean (SD) 72 (13) 72 (13) 71 (13) 71 (13)
Sex in original sample; % male 48 61 48 61
Sex in validation sample; % male 55 55 56 57
independence in relation to the SSVMod. The figures inTable 7for ischaemic and haemorrha-gic stroke are similar.
In relation to both survival and independence, the HL test was significant, for each method of grouping, in relation to both the SSVMod and the NIHSSMod model (data not shown). The calibration slope for survival was 1.308 for the SSVMod and 0.975 for the NIHSSMod. For independence, the calibration slope was 0.470 for the SSVMod and 0.629 for the NIHSSMod. The slopes are closer to 1 for survival than for independence, suggesting superior calibration. Calibration plots are shown inFig 2; as the methods of grouping produced similar results in the HL test, plots are shown just for deciles of patient numbers. Judged by the approximation of the plotted markers to the diagonal, the NIHSSMod (plotsbandd) appears to show better calibration than the SSVMod (plotsaandc), for both outcomes.
Model recalibration
Table 8shows the results for the recalibration of the two models, using both recalibration in the large (updating the intercept) and logistic recalibration (updating the intercept and the
Fig 1. Receiver operating characteristics (ROC) curves for survival and independence, for the total sample.Optimally, the curve should lie towards the upper left corner of the plot. Survival: assessed at 30 days for the SSVMod and at 100 days for the NIHSSMod. Independence: assessed at 6 months for the SSVMod and at 3 months for the NIHSSMod.
slope; seeAppendix). Logistic recalibration produced models with good calibration, confirmed by a non-significant HL test. However, recalibration in the large only gave a non-significant HL test for the NIHSSMod for 100-day survival.
Discussion
This study sought to perform a comparative validation of the SSVMod and the NIHSSMod by examining their discrimination and calibration in an external dataset derived from a large ran-domized trial; these characteristics of the models were also tested in subgroups of patients with either ischaemic or haemorrhagic strokes. Additionally, the two models were updated in the context of a clinical trial population.
In this study, discrimination was somewhat better for survival than for independence for both models; however, higher discrimination may be anticipated for outcomes such as death
Table 5. C-statistics for survival and independence.
SSVMod NIHSSMod Test for equality
C-statistic 95% CI n C-statistic 95% CI n pvalue
30-day survival
total .816 .794, .838 8003 .837 .815, .858 8003 .001
100-day survival
total .802 .784, .820 8003 .823 .806, .840 8003 <.001
3-month-independence
total (1) — — — .728 .714, .741 5373 —
total (2) .735 .722, .748 5373 .728 .714, .741 5373 .160
6-month independence
total (1) .725 .712, .739 5667 — — — —
total (2) .725 .712, .739 5667 .731 .718, .745 5667 .242
(1) Estimate using all available data
(2) Estimate using pairwise deletion. CI = confidence interval. doi:10.1371/journal.pone.0153527.t005
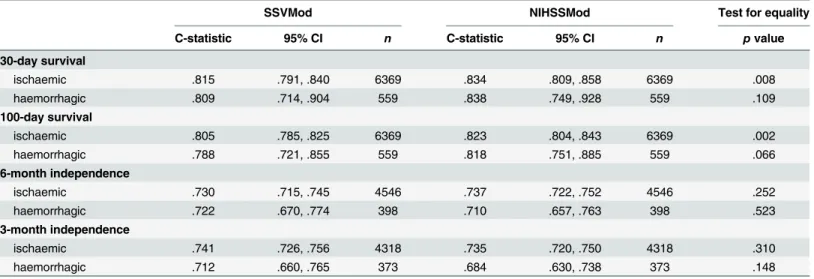
Table 6. C-statistics for survival and independence in subgroups defined by type of stroke (ischaemic and haemorrhagic). Thepvalues from the tests for equality of the C-statistics should be interpreted with regard to the differing denominators of ischaemic and haemorrhagic strokes.
SSVMod NIHSSMod Test for equality
C-statistic 95% CI n C-statistic 95% CI n pvalue
30-day survival
ischaemic .815 .791, .840 6369 .834 .809, .858 6369 .008
haemorrhagic .809 .714, .904 559 .838 .749, .928 559 .109
100-day survival
ischaemic .805 .785, .825 6369 .823 .804, .843 6369 .002
haemorrhagic .788 .721, .855 559 .818 .751, .885 559 .066
6-month independence
ischaemic .730 .715, .745 4546 .737 .722, .752 4546 .252
haemorrhagic .722 .670, .774 398 .710 .657, .763 398 .523
3-month independence
ischaemic .741 .726, .756 4318 .735 .720, .750 4318 .310
haemorrhagic .712 .660, .765 373 .684 .630, .738 373 .148
that are measured without error and for which predictors are often easier to identify. Addition-ally, discrimination tended to be better for earlier than for later outcomes, probably because there is less likelihood of intervening events that may influence outcome. There are some dif-ferences between ischaemic and haemorrhagic strokes. Haemorrhagic strokes are often fatal, largely irrespective of the patient’s age. Patients with ischaemic strokes, even severe ones, are more likely to die of complications than as a result of the stroke, and such complications may be more likely in older patients. Both of these considerations suggest that prognostic models incorporating age may perform better in ischaemic than in haemorrhage strokes. The NIHSS-Mod shows noticeably lower discrimination than the SSVNIHSS-Mod for haemorrhagic strokes in relation to 3-month independence. However,pvalues for the mean calibrations and the com-parisons between C-statistics must be interpreted with caution, owing to the different denomi-nators in these comparisons.
Both the prognostic models showed shortcomings with regard to calibration, tending to over-predict survival and under-predict independence. This may partly reflect the eligibility criteria of the RCT sample–in which, for example, moribund patients were not included–and improvements in care (e.g. due to thrombolysis and care in specialized stroke units) since the models were first developed. Also relevant is that the development cohort for the NIHSSMod [10] excluded patients with pre-existing disability (mRS score3), and the cohort for the SSVMod [9] is likely to have excluded early deaths by virtue of collecting data for the model at a median of 5 days after stroke, in contrast to within 24 hours of stroke onset in the validation cohort. Accordingly, both models might be expected to give different predictions of survival (and of independence in the case of the NIHSSMod) in our validation cohort. However, well-calibrated models will fail a statistical test if the sample is large, owing to increased statistical power. As was observed for discrimination, calibration, as judged by the calibration slopes, was better for survival than for independence, and similar factors to those suggested in the case of discrimination are likely to explain this. Reflecting the relative magnitudes of the calibration slopes, the calibration plots indicate that the NIHSSMod performs slightly better than the SSVMod. There is, however, little difference in the calibration of the models between ischaemic and haemorrhagic strokes, reflecting earlier findings [16].
In comparison with other studies, the C-statistics calculated as a measure of discrimination for 100-day survival were lower than those reported by Ayis et al [16] for 3-month survival (.80
Table 7. Calibration in the large of the models.Data are counts (%);pvalues are derived from a logistic regression model. Figures are given for all patients and separately for those with ischaemic and haemorrhagic strokes.
SSVMod NIHSSMod
Observed Expected pvalue Observed Expected pvalue
Survival
total 7628 (95.3) 7068 (88.3) <0.001 7378 (92.2) 7000 (87.5) <.001
ischaemic 6066 (95.2) 5263 (82.6) <0.001 5867 (92.1) 5568 (87.4) <.001
haemorrhagic 531 (95.0) 494 (88.4) <0.001 511 (91.4) 489 (87.5) <.001
Independence
total 3422 (60.4) 2659 (46.9) 0.160 2685 (50.0) 2001 (37.2) <.001
ischaemic 2733 (60.1) 2137 (47.0) 0.098 2146 (49.7) 1607 (37.2) <.001
haemorrhagic 239 (60.1) 189 (47.5) 0.562 185 (49.6) 132 (35.4) <.001
Survival: assessed at 30 days for the SSVMod and at 100 days for the NIHSSMod. Independence: assessed at 6 months for the SSVMod and at 3 months for the NIHSSMod. Denominators for survival: 8003 for both models (6369 for ischaemic, 559 for haemorrhagic). Denominators for independence: 5667 for SSVMod (4546 for ischaemic, 398 for haemorrhagic); 5373 for NIHSSMod (4318 for ischaemic, 373 for haemorrhagic).
vs .90 for the SSVMod, .82 vs .88 for the NIHSSMod). This might appear to reflect the longer prediction time in our study, except that the C-statistics for 30-day survival were also lower than Ayis et al’s figures for 3-month survival. A more plausible explanation is that participants
Fig 2. Calibration plots for survival and independence, for the total sample and based on deciles of patient numbers.Survival: assessed at 30 days for the SSVMod and at 100 days for the NIHSSMod. Independence: assessed at 6 months for the SSVMod and at 3 months for the NIHSSMod. For illustrative clarity, the origins for the axes vary between plots.
doi:10.1371/journal.pone.0153527.g002
Table 8. Recalibration of the SSVMod and the NIHSSMod.
Model and outcome Recalibrated parameter estimates Hosmer-Lemeshow test (pvalues)
Recalibration in the large
Logistic recalibration
Original Recalibration in the large
Logistic recalibration
SSVMod: 30-day survival 0.813e(LP) 0.813e(1.308 x LP) <.001 <.001 .509
NIHSSMod: 100-day survival –0.655 + LP –0.688 + (0.975 x LP) <.001 .346 .307
SSVMod: 6-month independence 0.869 + LP 0.628 + (0.470 x LP) <.001 <.001 .239 NIHSSMod: 100-day
independence
0.735 + LP 0.425 + (0.629 x LP) <.001 <.001 .155
from a clinical trial are likely to be more homogeneous than patients in a community or general clinical population, making discrimination more difficult. Furthermore, independence was defined by Ayis et al as a score12 on the Barthel Index (0–20 version), rather than in terms of the mRS, as in our validation study. In relation to the NIHSSMod, the C-statistic for 100-day survival was higher in our study than in König et al’s study [13] (.82 vs .71) but that for 3-month independence as lower (.73 vs .81). This may reflect differences in the two cohorts–
König et al’s patients were somewhat younger than those in our cohort (69 vs 72), but with a higher mean NIHSS score (13 vs 7). For the SSVMod, the C-statistic for 30-day survival was higher than that reported by SCOPE [14] (.82 vs .73). In contrast, the C-statistic for 6-month independence (.73) was lower than those reported by SCOPE (.82) [14] and Reid et al (.79) [12]. The calibration plot for 30-day survival appears to be worse than that reported by SCOPE [14], but the plots for 90-day independence are similar. Differences vis-à-vis the SCOPE study may again reflect differences in the patient population–the SCOPE study included almost exclusively patients who were independent before stroke. In addition, we used the mRS as a proxy for the OHS, which was utilized in the SCOPE study. Whilst the meaning of the relevant cutoff (<3) is equivalent in the two scales, the cutoff is described using somewhat different
wording [18], which may account for some of the difference in findings.
Although there is some indication that the NIHSSMod performs better than the SSVMod in terms of calibration and, for survival, in terms of discrimination, differences between the mod-els are generally small and the smallpvalues reflect the large sample size; it is therefore hard to reach a conclusive judgment regarding the relative predictive power of the two models. It is likely that judgments as to the relative utility of the two models should instead be related to clinical and practical considerations. The SSVMod requires information on a small number of variables, whereas the NIHSS is a multi-item scale requiring a degree of training [27]–though the NIHSS is becoming a standard method of clinical assessment in acute stroke and nomo-grams and computer pronomo-grams exist for both the SSVMod and the NIHSSMod. The NIHSS scores a person’s current performance and has to be undertaken as part of a clinical examina-tion. In contrast, the SSVMod is a combination of aspects of physical performance and the his-tory readily collected from clinical records or by interview. Information for the SSVMod may therefore be quicker and easier to collect. Notwithstanding this, in the UK, the NIHSS is col-lected as a matter of standard practice as part of the Sentinel Stroke National Audit Programme (SSNAP;https://www.rcplondon.ac.uk/projects/sentinel-stroke-national-audit-programme). The NIHSSMod, unlike the SSVMod, does not reflect pre-stroke status; this may not be prob-lematic in trial populations, as patients who are dependent pre-stroke are excluded in most tri-als, but it may be less appropriate for everyday clinical populations, where pre-stroke
dependence may be a more important predictive factor.
Appendix
Details of the methods of model updating
Recalibration in the large. This method is used in cases where a difference in the outcome inci-dence is suspected [26]. For the logistic regression models this was achieved by fitting a model with only one free parameter, and with an offset variable equal to the linear predictor of the original model. The models were updated by adding the coefficient of the free parameter to the linear predictor; the individual risks were then recalculated:
recalibrated linear predictor¼updated interceptþoriginal linear predictor
For the survival analysis model recalibration in the large was accomplished by fitting a Cox proportional hazards model with the linear predictor as the only parameter and estimating the baseline survival at 30 days, setting the linear predictor equal to 0. The individual risks were recal-culated by replacing the current baseline survival in the prognostic model with the updated value:
recalibrated linear predictor¼updated baseline survivaleðoriginal linear predictorÞ
Logistic recalibration. This method is used in cases where the coefficients of the original model may have been over-fitted; it assumes similarrelativeeffects of the predictors but allows for a larger or smallerabsoluteeffect of the predictors [26]. For the logistic regression models this was achieved by fitting a model with the linear predictor of the original model as a single predictor. The models were then updated by multiplying the linear predictor by the coefficient and adding the estimated intercept; the individual risks were then recalculated:
recalibrated linear predictor¼updated interceptþ ðcoefficient x original linear predictorÞ
For the survival analysis model this was accomplished by fitting a Cox proportional hazards model with the linear predictor as the only parameter and estimating the baseline survival at 30 days with the linear predictor equal to 0. The model was then updated by replacing the current baseline survival value for the updated one and multiplying the linear predictor by the coeffi-cient in the model; the individual risks were then recalculated:
recalibrated linear predictor¼updated baseline survivaleðcoefficient x original linear predictorÞ
Supporting Information
S1 Data. Data for the testing of the prognostic models.
(DTA)
Acknowledgments
The authors thank Peter Croft from the MRC PROGRESS Partnership for advice on the study.
Membership of the SO
2S Study Team
Trial Management Group: Professor Christine Roffe (Chair), Dr Tracy Nevatte, Professor Julius Sim, Professor Richard Gray, Natalie Ives, Dr Jon Bishop, Dr Sarah Pountain, Peter and Linda Handy.
Trial Steering Committee: Professor Martin Dennis (Chair), Professor Lalit Kalra, Professor Sian Maslin‐Prothero, Dr Jane Daniels, Peta Bell, Professor Richard Lindley.
Gething, Joy Dale, Wendy Lawton, Chris Buckley, Eddie Skelson, Nicola Mellor, Kathryn McCarron, Jean Leverett, Emily Linehan, Stephanie Edwards, Terri Oliver, Loretto Thompson, Sian Edwards, Clare Lees and Jackie Richards.
Study Team at Birmingham Clinical Trials Unit: Andy Howman, Robert Hills, Nick Hilken and Chakanaka Sidile.
Participating centres and SO2S collaborative group members (indicates principal investi-gator(s) at that centre):Royal Stoke University Hospital,Stoke‐on‐TrentK Finney, S Gomm, J Lucas, H Maguire, C Roffe(478);St George’s Hospital,LondonI Jones, L Montague, B
Moynihan, J O’Reilly, C Watchurst (288);The Royal Liverpool University Hospital,LiverpoolP
Cox, G Fletcher, A Ledger, S Loharuka, P Lopez, A Manoj(257);Royal Bournemouth General Hospital,BournemouthO David, D Jenkinson, J Kwan, E Rogers, E Wood (240);Kings College
Hospital,LondonA Davis, L Kalra, E Khoromana, R Lewis, H Trainer (231);Leeds General Infirmary,LeedsM Kambafwile, L Makawa, E Veraque, P Wanklyn, D Waugh (204);Salford
Royal Hospital,SalfordE Campbell, J Hardicre, V O’Loughlin, C Smith, T Whittle (192);
Southend Hospital,SouthendP Guyler, P Harman, A Kumar Kundu, D Sinha, S Tysoe (188);
Countess of Chester Hospital,ChesterS Booth, K Chatterjee, H Eccleson, C Kelly, S Leason (176);The Royal Victoria Infirmary,Newcastle upon TyneA Barkat, J Davis, A Dixit, M
Faw-cett, V Hogg (168);Royal Sussex County Hospital,BrightonK Ali, J Breeds, J Gaylard, J Knight, G Spurling (164);Musgrove Park Hospital,TauntonS Brown, L Caudwell, L Dunning-ham, J Foot, M Hussain(156);Bristol Royal Infirmary,BristolJ Chambers, P Murphy, M Osborn, A Steele (151);Royal Preston Hospital,PrestonS Duberley, C Gilmour, B Gregary, S Punekar, S Raj (148);University Hospital Aintree,LiverpoolJ Atherton, R Durairaj, T Flus-key, Z Mellor, V Sutton (148);Birmingham Heartlands Hospital,BirminghamP Carr, J McCor-mack, D Sandler, C Stretton, K Warren (143);Pennine Acute Hospital,RochdaleL Harrison, L Johnson, R Namushi, N Saravanan, N Thomas (133);Queen’s Hospital,BurtonJ Birch, R
Damant, B Mukherjee(131);University Hospital Coventry,WalsgraveL Aldridge, P Kanti Ray, S Nyabadza, C Randall, H Wright (129);Wansbeck Hospital,NorthumberlandC
Ash-brook‐Raby, A Barkat, R Lakey, C Price, G Storey (124);Royal Devon and Exeter Hospital,
WonfordL Barron, A Bowring, H Eastwood, M James, S Keenan (113);Royal United Hospital,
BathJ Avis, D Button, D Hope, B Madigan, L Shaw(113);Royal Cornwall Hospital,TreliskeK Adie, G Courtauld, F Harrington, C Schofield (112);Queen Elizabeth the Queen Mother Hospi-tal,MargateG Gunathilagan, S Jones, G Thomas (105);York Hospital,YorkJ Coyle, N Dyer, S Howard, M Keeling, S Williamson (105);University Hospital of North Durham,DurhamE Brown, S Bruce, B Esisi, R Hayman, E Roberts (99);Derriford Hospital,PlymouthC Bailey, B Hyams, A Mohd Nor, N Persad (96);Selly Oak Hospital (Acute),BirminghamJ Hurley, E
Linehan, J McCormack, J Savanhu, D Sims(92);Whiston Hospital,PrescotR Browne, S Deal-ing, V Gowda(89);Torbay District General Hospital,TorbayC Bailey, P Fitzell, C Hilaire, D
Kelly, S Szabo (88);Charing Cross Hospital,LondonE Beranova, J Pushpa‐Rajah, T Sachs, P Sharma, V Tilley (87);Leighton Hospital,CreweN Gautam, C Maity, R Miller, C Mustill, M
Salehin, A Walker (87);Kent & Canterbury Hospital,CanterburyH Baht, I Burger, L Cowie, T Irani, A Thomson (84);New Cross Hospital,WolverhamptonP Bourke, K Fotherby, D
Mor-gan, K Preece (84);Northwick Park Hospital,HarrowL Burgess, D Cohen, M Mpelembue (83);Barnsley District General Hospital,BarnsleyM Albazzaz, R Bassi, C Dennis, K Hawley, S
Johnson‐Holland (82);Blackpool Victoria Hospital,BlackpoolH Goddard, J Howard, C Jeffs, J Mcilmoyle, A Strain (82);North Tyneside General Hospital,North ShieldsJ Dickson, K
Mitch-elson, C Price, V Riddell, A Smith (79);Eastbourne District General Hospital,EastbourneC Athulathmudali, E Barbon (76);Warrington Hospital,WarringtonK Bunworth, L Connell, G
Gulliver, R Lakey, N Majmudar, S Rutter (69);William Harvey Hospital,AshfordL Cowie, D
Hargroves, T Webb (69);Stepping Hill Hospital,StockportA Brown, H Cochrane, S
Krishnamoorthy, J McConniffe (66);The James Cook University Hospital,MiddlesboroughD
Broughton, K Chapman, L Dixon, A Surendran (66);Northampton General Hospital (Acute),
NorthamptonM Blake, F Faola, A Kannan, P Lai, B Vincent (59);Leicester General Hospital,
LeicesterM Dickens, D Eveson, S Khan, R Marsh, A Mistri,(57);Rotherham District General Hospital,RotherhamJ Harris, J Howe, K McNulty, J Okwera(56);St Peter’s Hospital,Chertsey
R Nari, E Young (56);Macclesfield District General Hospital,MacclesfieldA Barry, B Menezes, M Sein, H Rooney, L Wilkinson (55);Manor Hospital,WalsallS Hurdowar, K Javaid, K
Pre-ece (54);Bradford Royal Infirmary,BradfordR Bellfield, B Hairsine, L Johnston, C Patterson, S Williamson (53);Luton & Dunstable Hospital,LutonF Justin, S Sethuraman, L Tate (50);
Royal Blackburn Hospital,BlackburnA Bell, M Goorah, N Goorah, A Sangster (50);University College Hospital,LondonN Bhupathiraju, L Latter, P Rayson, R Simister, R Uday Erande (50);
Addenbrooke’s Hospital,CambridgeN Butler, D Day, E Jumilla, J Mitchell, E Warburton(48);
Queen Alexandra Hospital,PortsmouthT Dobson, C Edwards, J Hewitt, L Hyatt, D Jarret
(47);North Devon District Hospital,BarnstapleG Belcher, M Dent, F Hammonds, J Hunt, C Vernon (45);Solihull Hospital,SolihullA Carter, K Elfandi, S Stafford (45);Pilgrim Hospital,
BostonA Hardwick, D Mangion, S Marvova(44);Norfolk & Norwich University Hospital,
NorwichJ Jagger, P Myint, G Ravenhill, N Shinh, E Thomas, N Wyatt (41);Gloucestershire
Royal Hospital,GloucesterP Brown, F Davis, D Dutta, J Turfrey, D Ward (40);Royal Surrey County Hospital,GuildfordO Balazikova, A Blight, C Lawlor, K Pasco (39);Southport &
For-mby District General Hospital,SouthportM Marshall, P McDonald, H Terrett (39);Bishop Auckland General Hospital,Bishop AucklandE Brown, A Mehrzad(35);Airedale General
Hospital,KeighleyR Bellfield, P Garnett, B Hairsine, S Mawer, M Smith, S Williamson (34);
Calderdale Royal Hospital,HalifaxC Button, J Greig, B Hairsine, A Nair, P Rana, I Shakir
(34);Doncaster Royal Infirmary,DoncasterP Anderton, D Chadha, L Holford, D Walstow (34);East Surrey Hospital,RedhillY Abousleiman, S Collins, A Jolly, B Mearns(34);Medway
Maritime Hospital,GillinghamP Akhurst, B Bourne, S Burrows, S Sanmuganathan, S Thomp-son (34);Royal Derby Hospital,DerbyT England, A Hedstrom, M Mangoyana, M Memon, L
Mills, K Muhiddin, I Wynter (33);Wycombe General Hospital,High WycombeA Benford, M Burn, A Misra, S Pascall (33);The Princess Royal Hospital,TelfordR Campbell, N Motherwell
(32);Harrogate District Hospital,HarrogateS Appleby, S Brotheridge, J Strover (30); Peterbor-ough City Hospital,PeterboroughS D’Souza, P Owusu‐Agyei, S Subramonian, N Temple (30);
West Cumberland Hospital,WhitehavenR Jolly, O Orugun(30);Colchester General Hospital,
ColchesterM Keating, R Saksena, A Wright (29);Royal Hampshire County Hospital,
Winches-terD Ardern, C Eglinton, R Honney, N Smyth, J Wilson (29);Dorset County Hospital, Dor-chesterS Breakspear, L O’Shea, H Prosche, S Sharpe (27);Frimley Park Hospital,FrimleyS
Atkinson, B Clarke, L Moore (27);Royal Hallamshire Hospital,SheffieldS Duty, K Harkness, M Randall, E Richards, K Stocks (27);Yeovil District Hospital,YeovilS Board, C Buckley, D
Hayward, K Rashed, R Rowland‐Axe (25);Poole General Hospital,PooleC Dickson, L Gleave, S Ragab(24);Frenchay Hospital,BristolN Baldwin, S Hierons, H Skuse, L Whelan (22);
Prin-cess Alexandra Hospital,HarlowL Brown, M Burton, A Daniel, S Hameed, S Mansoor(22);
West Suffolk Hospital,Bury St EdmundsA Azim, M Krasinska, J White (22);The Ulster
Hospi-tal,DundonaldM Power, B Wroath (21);Watford General Hospital,WatfordD Collas, S Sundayi, E Walker (21);Southampton General Hospital,SouthamptonM Brown, G Durward,
V Pressly, B Watkins, N Weir, D Whittaker (20);Craigavon Area Hospital,PortadownC Douglas, M McCormick, M McParland (19);Royal Lancaster Infirmary,LancasterC Culmsee,
Kausar(17);City Hospital,NottinghamP Cox, A Ferguson, D Havard, F Shelton, A Shetty
(16);Antrim Area Hospital,AntrimC Edwards, C McGoldrick, A Thompson, D Vahidassr (15);Pinderfields General Hospital,WakefieldG Bateman, P Datta, A Needle (15);Royal
Albert Edward Infirmary,WiganP Farren, S Herath(15);Good Hope Hospital,Sutton Cold-fieldI Memon, S Montgomery (13);Hereford County Hospital,HerefordS Black, S Holloman,
C Jenkins, F Price (13);South Tyneside District General Hospital,South ShieldsM Duffy, J Graham, J Scott (13);Broomfield Hospital,ChelmsfordA Lyle, F Mcneela, K Swan, J Topliffe, V Umachandran(12);Wythenshawe Hospital,WythenshaweB Charles, E Gamble, S Mawn (11);Warwick Hospital,WarwickM Dean, B Thanvi(10);Ipswich Hospital,IpswichM
Chowdhury, J Ngeh, S Stoddart (9);Kettering General Hospital,KetteringK Ayes, J Kessell (9);Nevill Hall Hospital,AbergavennyB Richard, E Scott (9);Princess Royal University
Hospi-tal,OrpingtonL Ajayo, E Khoromana, E Parvathaneni, B Piechowski‐Jozwiak, L Sztriha(9);
Scarborough General Hospital,ScarboroughL Brown, K Deighton, E Elnour, J Paterson, E
Temlett (9);Hull Royal Infirmary,HullA Abdul‐Hamid, J Cook, K Mitchelson (8);King’s Mill Hospital,Sutton‐in‐AshfieldM Cooper, I Wynter (8);The Royal London Hospital,LondonP
Gompertz, O Redjep, J Richards, R Uday Erande (8);Trafford General Hospital,ManchesterS Anwar, A Ingram, S McGovern, S Musgrave, L Tew (8);Altnagelvin Area Hospital,
London-derryJ Corrigan, C Diver‐Hall, M Doherty, M McCarron(7);Darent Valley Hosptial, Dart-fordP Aghoram, T Daniel, S Hussein, S Lord (7);Royal Berkshire Hospital,ReadingN
Mannava, A van Wyk(6);Arrowe Park Hospital,WirralJ Barrett, R Davies, A Dodd, D Lowe, P Weir (5);Basingstoke and North Hampshire Hospital,BasingstokeD Dellafera, E
Giallombardo(5);Lincoln County Hospital,LincolnS Arif, R Brown, S Leach(5);Hexham General Hospital,HexhamC Price, V Riddell (4);Manchester Royal Infirmary,ManchesterJ
Akyea‐Mensah, J Simpson(4);Salisbury District Hospital,SalisburyT Black, C Clarke, M Skelton (4);Croydon University Hospital,CroydonJ Coleman, E Lawrence(3);Russells Hall
Hospital,DudleyA Banerjee, A Boyal, A Gregory (3);Worthing Hospital,WorthingS Ivatts, M Metiu (3);Bedford Hospital,BedfordA Elmarimi,S Hunter (2);James Paget Hospital,Great
YarmouthH Benton, M Girling, P Harrison, H Nutt, S Mazhar Zaidi, C Whitehouse (2);St Richard’s Hospital,ChichesterG Blackman, S Ivatts(2);Erne Hospital,FermanaghM Doherty,
J Kelly(1);University Hospital Lewisham,LewishamM Patel(1);Bronglais General Hospital,
AberystwythP Jones(0);Hillingdon Hospital,HillingdonA Parry(0);Kingston Hospital,
Kingston upon ThamesL Choy(0);Morriston Hospital,Morriston(0);North Middlesex Hospi-tal,EnfieldT Adesina, A David, R Luder(0);Staffordshire District General Hospital,Stafford
A Oke(0);St Helier Hospital,CarshaltonV Jones, P O’Mahony, C Orefo (0);Whipps Cross University Hospital,LondonR Simister(0).
Author Contributions
Conceived and designed the experiments: JS LT MSD CR. Analyzed the data: JS LT. Wrote the paper: JS LT MSD CR.
References
1. Steyerberg EW, Moons KGM, van der Windt DA, Hayden JA, Perel P, Schroter S et al. Prognosis research strategy (PROGRESS) 3: prognostic model research. Plos Med. 2013; 10(2):e1001381.
2. Hemingway H, Croft P, Perel P, Hayden JA, Abrams K, Timmis A et al. Prognosis research strategy (PROGRESS) 1: A framework for researching clinical outcomes. BMJ. 2013; 345:e55953.
3. Brott T, Adams HP Jr, Olinger CP, Marler JR, Barsan WG, Biller J et al. Measurements of acute cerebral infarction: a clinical examination scale. Stroke. 1989; 20:964–970.
5. Altman DG, Vergouwe Y, Royston, Moons KGM. Prognosis and prognostic research: validating a prog-nostic model. BMJ. 2009; 338:b605. doi:10.1136/bmj.b605PMID:19477892
6. Wyatt JC, Altman DG. Commentary: Prognostic models: clinically useful or quickly forgotten? BMJ. 1995; 311:1359
7. Moons KGM, Altman DG, Vergouwe Y, Royston P. Prognosis and prognostic research: application and impact of prognostic models in clinical practice. BMJ. 2009; 338:b606. doi:10.1136/bmj.b606PMID: 19502216
8. Teale EA, Forster A, Munyombwe T, Young JB. A systematic review of case-mix adjustment models for stroke. Clin Rehabil. 2012; 26:771–786. doi:10.1177/0269215511433068PMID:22257504
9. Counsell C, Dennis M, McDowall M, Warlow C. Predicting outcome after acute and subacute stroke: development and validation of new prognostic models. Stroke 2002; 33: 1041–1047. PMID:11935058
10. Weimar C, König IR, Kraywinkel K, Ziegler A, Diener HC. Age and the National Institutes of Health Stroke Scale within 6 h after onset are accurate predictors of outcome after cerebral ischemia: develop-ment and external validation of prognostic models. Stroke. 2004; 35:158–162. PMID:14684776
11. Counsell C, Dennis MS, Lewis S, Warlow C, FOOD Trial collaboration. Performance of a statistical model to predict stroke outcome in the context of a large, simple, randomized, controlled trial of feeding. Stroke. 2003; 34:127–133. PMID:12511763
12. Reid JM, Gubitz GJ, Dai D, Reidy Y, Christian C, Counsell C et al. External validation of a six simple variable model of stroke outcome and verification in hyper-acute stroke. J Neurol Neurosurg Psychiatry. 2007; 78:1390–1391. PMID:18024695
13. König IR, Ziegler A, Bluhmki E, Hacke W, Bath PM, Sacco RL et al. Predicting outcome after acute ischaemic stroke: a simple index works in patients from controlled clinical trials. Stroke. 2008; 39:1821–
1826. doi:10.1161/STROKEAHA.107.505867PMID:18403738
14. SCOPE (Stroke Complications and Outcomes Prediction Engine) Collaborations; Lewis S, Dennis M, Sandercock P. Predicting outcome in hyper-acute stroke: validation of a prognostic model in the Third International Stroke Trial (IST3). J Neurol Neurosurg Psychiatry. 2008; 79(4):397–400. PMID: 17766429
15. Teale E, Young J, Dennis M, Sheldon T. Predicting patient-reported stroke outcomes: a validation of the six simple variable prognostic model. Cerebrovasc Dis Extra. 2013; 3:97–102. doi:10.1159/ 000351142PMID:23898344
16. Ayis SA, Coker B, Rudd AG, Dennis MS, Wolfe CD. Predicting independent survival after stroke: a European study for the development and validation of standardised stroke scales and prediction mod-els of outcome. J Neurol Neurosurg Psychiatry. 2013; 84:288–296. doi:10.1136/jnnp-2012-303657 PMID:23117498
17. Roffe C, Nevatte T, Crome P, Gray R, Sim J, Pountain S et al. The Stroke Oxygen Study (SO2S)–A multi-center, prospective, randomized, open, blinded-endpoint study to assess whether routine oxygen treatment in the first 72 hours after a stroke improves long-term outcome: protocol for a randomized controlled trial. Trials. 2014; 15:99 doi:10.1186/1745-6215-15-99PMID:24684940
18. New PW, Buchbinder R. Critical appraisal and review of the Rankin scale and its derivatives. Neuroepi-demiology. 2006; 26:4–15. PMID:16272826
19. Collin C, Wade DT, Davies S, Horne V. The Barthel ADL Index: a reliability study. Int Disabil Stud. 1988; 10:61–63. PMID:3403500
20. Steyerberg EW.Clinical prediction models:a practical approach to development,validation,and updating. New York: Springer; 2009.
21. DeLong ER, DeLong DM, Clarke-Pearson DL. Comparing the areas under two or more correlated receiver operating characteristic curves: a nonparametric approach. Biometrics. 1988; 44: 837–845. PMID:3203132
22. Steyerberg EW, Vickers AJ, Cook NR, Gerds T, Gonen M, Obuchowski N, Pencina MJ, Kattan MW. Assessing the performance of prediction models: a framework for traditional and novel measures. Epi-demiology. 2010; 21:128–138. doi:10.1097/EDE.0b013e3181c30fb2PMID:20010215
23. Steyerberg EW, Vergouwe Y. Towards better clinical prediction models: seven steps for development and an ABCD for validation. Eur Heart J. 2014; 35:1925–1931. doi:10.1093/eurheartj/ehu207PMID: 24898551
24. Debray TPA, Vergouwe Y, Koffijberg H, Nieboer D, Steyerberg EW, Moons KGM. A new framework to enhance the interpretation of external validation studies of clinical prediction models. J Clin Epidemiol. 2015; 68:279–289. doi:10.1016/j.jclinepi.2014.06.018PMID:25179855
26. Steyerberg E, Borsboom G, Houwelingen H, Eijkemans M, Habbema J. Validation and updating of pre-dictive logistic regression models: a study on sample size and shrinkage. Stat Med. 2004; 23:2567–
2586. PMID:15287085
27. Dennis M. Predictions models in acute stroke: potential uses and limitations. Stroke. 2008; 39:1665–
1666. doi:10.1161/STROKEAHA.107.510271PMID:18403744