Article
J. Braz. Chem. Soc., Vol. 24, No. 8, 1351-1356, 2013. Printed in Brazil - ©2013 Sociedade Brasileira de Química 0103 - 5053 $6.00+0.00
A
*e-mail: [email protected]
Prediction of Parameters (Soluble Solid and pH) in Intact Plum using
NIR Spectroscopy and Wavelength Selection
Rosangela C. Costa and Kássio M. G. de Lima*
Grupo de Pesquisa em Quimiometria Aplicada, Instituto de Química, Universidade Federal do Rio Grande do Norte, 59072-970 Natal-RN, Brazil
O objetivo deste estudo foi avaliar a potencialidade da espectroscopia no infravermelho próximo (NIRS) como um método rápido e não destrutivo para determinação do teor de sólidos solúveis (SSC) e pH em ameixas intactas. Amostras de ameixa com teores de sólidos solúveis variando de 5,7 a 15% e pH entre 2,72 e 3,84 foram adquiridas em supermercados em Natal (Rio Grande do Norte, Brasil) e espectros NIR foram coletados no intervalo de 714-2500 nm. Uma comparação de algumas técnicas de calibração multivariada com relação ao preprocessamento dos dados e algoritmos de seleção de variáveis, tais como mínimos quadrados parciais por intervalos (iPLS), algoritmo genético (GA), algoritmo das projeções sucessivas (APS) e seleção de preditores ordenados (OPS), foi realizada. Modelos de validação para SSC e pH tiveram um coeficiente de correlação (R2) de 0,95 e 0,90, com erro quadrático médio de previsão (RMSEP) de 0,45 e 0,07,
respectivamente. A partir desses resultados, conclui-se que a espectroscopia NIR pode ser usada como uma técnica não destrutiva para determinação de SSC e pH em ameixas.
The aim of this study was to evaluate the potential of near-infrared reflectance spectroscopy (NIRS) as a rapid and nondestructive method to determine the soluble solid content (SSC) and pH of intact plums. Samples of plum with total solid contents ranging from 5.7 to 15% and pH from 2.72 to 3.84 were collected from supermarkets in Natal (Rio Grande do Norte, Brazil) and NIR spectra were acquired in the 714-2500 nm range. A comparison of some multivariate calibration techniques with respect to several pre-processing data and variable selection algorithms, such as interval partial least squares (iPLS), genetic algorithm (GA), successive projection algorithm (SPA) and ordered predictor selection (OPS), was performed. Validation models for SSC and pH had a coefficient of correlation (R2) of 0.95 and 0.90, as well as a root mean square error of
prediction (RMSEP) of 0.45 and 0.07, respectively. From these results, it can be concluded that NIR spectroscopy can be used as a nondestructive technique for determining SSC and pH in plums.
Keywords: NIRS, plum, multivariate calibration, variable selection
Introduction
The fresh-fruit market is becoming increasingly demanding with regard to product quality. This, in turn, governs fruit prices. In fact, one of the main goals of the fruit industry is to provide the consumer with products meeting high internal quality standards rather than fruit that looks mouthwatering but actually tastes insipid or has
an undesirable texture.1
Parameters such as total soluble solid content (SSC), titratable acidity, pH, tartaric acid, malic acid and anthocyanin contents are among the major quality attributes of plums
(Prunus salicina, L. and Prunus domestic). In Brazil, approximately 50,000 t of plums are consumed annually, constituting 30% of the total imported predominantly from Chile and Argentina. However, traditional analytical methods applied to the measurement of these parameters for plums are slow, tedious and destructive.
Near-infrared spectroscopy (NIRS) is becoming an increasingly attractive analytical technique for measuring quality parameters in fruits. The fruit sector benefits greatly from a nondestructive, rapid, precise, low-cost and non-contaminant method that enables the simultaneous determination of several parameters using a single measurement. A number of authors have reported on the performance and use of NIRS for measurement: SSC in
mulberry,3 fruit weight and diameter in nectarines,4 SSC
in pears,5 and SSC and firmness in apples.6
Saranwong et al.2 employed a portable NIR instrument
for measuring fruit quality in mangoes. Partial least squares (PLS) regression was used to generate the calibration
equations for SSC. The authors found 0.40 oBx for the
PLS models. Sánchez et al.7 studied the external and
internal quality parameters of strawberries (Fragaria
x ananassa Duch) at harvest and during postharvest refrigerated storage using NIR spectra. In this work, calibration models were developed using linear and non-linear regression algorithms for modeling parameters such as color values, firmness, SSC, pH value and titratable
acidity. In another work, Huang et al.8 studied electronic
absorption spectroscopy and NIRS for their ability to assess the internal quality SSC and pH, in mulberries. PLS, least-squares support vector machines (LS-SVM) and multiple linear regression (MLR) approaches were used for the model calibration, and the successive projection algorithm (SPA) was used for informative variable selection. Sánchez
et al.9 studied changes in physicochemical properties of
nectarines (Prunus persica (L.) Batsch cv. Sweet Lady)
using NIRS. Spectra and analytical data were used to develop a modified partial least squares (MPLS) model to quantify changes in SSC, flesh firmness, fruit weight and
diameter. Xudong et al.10 developed a nondestructive
SSC technique to assess orange fruit via Vis-NIRS with PLS and a principal component analysis-back propagation neural network (PCA-BPNN). The authors reported the correlation coefficient, root mean square error of prediction (RMSEP) and average difference between the predicted and measured values (bias) as 0.90, 0.68 and
0.16 oBx, respectively. Sun et al.11 studied the effect of
fruit moving speed on predicting SSC of “Cuiguan” pears (Pomaceae pyrifolia Nakai cv. Cuigan) using PLS and
LS-SVM regression with NIR spectra. At 0.5 m s-1, the best
model for SSC was PLS regression coupled with original
spectra; its coefficient of correlation (R2) and RMSEP were
0.916 and 0.530, respectively. Guoqiang et al.6 examined
the performance of SSC and firmness in apples by Vis-NIR spectroscopy. The validation models for SSC and firmness
showed an R2 value of 0.9532 and 0.8136, respectively, and
RMSEP values of 0.3838 oBx and 0.5344 kg cm-2,
respectively.
However, several complicating factors remain. The application of NIRS technology to the analysis of fruits has been limited due to the high moisture content, their large size and highly irregular shape, and the fact that some fruits have a hard peel that is not easily penetrable. To overcome these difficulties, various chemometric algorithms have been applied to NIR fruit data. PLS regression is a mathematical
approach that is typically employed in a large number of applications for the qualitative and quantitative analyses of fruit. Additionally, the methods used for variable selection,
such as iPLS (interval partial least squares),12 GA (genetic
algorithm),13 SPA (successive projection algorithm)14 and
ordered predictor selection (OPS)15 allow for improved
multivariate models using a spectrum of variables with more-relevant information. These algorithms eliminate variables that do not directly correlate with the property of interest, such as those that add only noise, nonlinearities, or irrelevant information. They also eliminate potential interferences and variables that generate a lower signal/noise ratio, which is indicative of low sensitivity.
Another tool used to improve NIR results is outlier detection, which selects samples that deviate from the bulk of the data due to instrumental errors, the presence of another population, laboratory errors, and so on. The calibration and prediction sets in this work were optimized based on data with extreme leverage, unmodeled residuals in spectral
data, and unmodeled residuals in the dependent variables.16
The objective of this study was to evaluate the potential of NIRS to simultaneously determine SSC and pH values of intact plums. In addition, a comparison of several multivariate calibration techniques, including PLS, iPLS, SPA, GA, OPS and outlier detection, was performed to determine the best models for this purpose. Additionally, several data pre-processing methods were compared to determine which method was best suited to this type of data analysis.
Experimental
Sample preparation
A total of 48 plums (Prunus salicina, L. and
Prunus domestic) was purchased at supermarkets from the metropolitan area in Natal, Rio Grande do Norte State, Brazil. The sorted plums were stored under ambient room conditions (26-30 °C, RH 60-80%) before performing NIR diffuse reflectance spectral measurements. All measurements, including spectral collection and parameter determination (SSC and pH) were carried out on the same day or the next day. The morphological properties (average values) of the plum samples, including mass mean (72.58 g) and diameter mean (19.77 cm), were measured before spectrum acquisition.
Reference methods for SSC and pH
fresh juice was centrifuged, and the supernatant was taken to be used for SSC determination with a portable refractometer (RTA-50 model, Brix 0.0-40.0%), which determined the measuring accuracy as ± 0.1% and the measurement temperature as 10-30 °C (automatic temperature compensation). The reference pH measurements were made using a digital pH meter (HI221 model, microprocessor pH meter, HANNA instruments) calibrated with pH 4.0 and 7.0 buffers. All measurements were performed immediately after NIRS measurements.
Instrumentation
Spectral measurements were performed using a MB 160 Bomem FT-NIR spectrophotometer (ABB Bomem, Quebec, Canada) equipped with a diffuse reflectance cell. The NIR
spectra were obtained over a range of 14,000-400 cm−1, or
714-2500 nm, and were recorded five times with a spectral
resolution of 8 cm−1, with 50 scans co-added. The average
value from five different locations of each fruit was properly stored, and the mean spectrum was then calculated for each sample. The spectrum of a polytetrafluoroethylene (PTFE) sample was used as background.
Data analysis
Data analysis was performed using MATLAB version 6.5 (the Math-Works, Natick, Massachusetts, USA), specifically the PLS-toolbox (Eigenvector Research, Inc., Wenatchee, WA, USA, version 6.01). Different pre-treatment methods were applied to the original data matrix in this study, including the derivative and smoothing Savitzky-Golay methods, by varying the number of window points (3, 5, 7, 11, 21, 51, 71 and 91 points) and multiplicative scattering correction (MSC). Savitzky-Golay smoothing is an averaging algorithm that fits a polynomial to data points. MSC is a transformation method used to compensate for additive and/or multiplicative effects in spectral data. Derivative attempts were made to correct for the baseline effects in the spectra. Performances of these pre-treatment algorithms were compared based on PLS calibration for SSC and pH parameters. The samples were divided into calibration (32 samples) and prediction (16 samples) sets by applying
the classic Kennard-Stone (KS) selection algorithm17 to the
NIR spectra. The lowest RMSEP is obtained when using the optimum number of PLS factors, which is found using the variance of the matrix of the instrumental responses. The prediction set was used to test the predictive ability of the PLS models. The predicted results for the calibration models developed by PLS using the spectral regions selected by iPLS, GA, SPA and OPS were compared to those found by
PLS using the whole region. Finally, the best model results for each parameter were compared before and after applying outlier detection.
According to the IUPAC definition bias is the difference between the population mean and the true value. The
occurrence of systematic errors was investigated by a t-test
described in the ASTM E1655-00.18
First, an average bias is calculated for the validation set:
(1)
where Iv is the number of samples in the validation set.
Then, the standard deviation of validation (SDV) is obtained by:
(2)
Finally, the t-value is given by:
(3)
If the t calculated is higher than the critical t-value at
the 95% confidence level, there is evidence that the bias included in the multivariate model is significant.
Results and Discussion
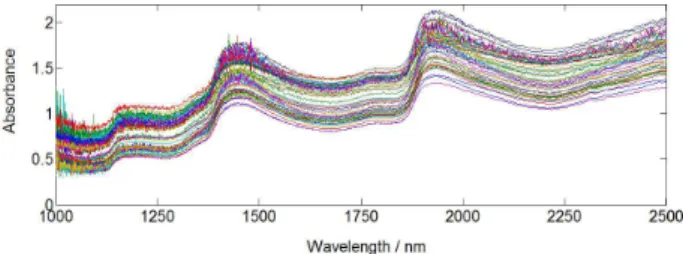
Figure 1 shows the raw plum average diffuse reflectance spectra collected for 48 samples. There are many cross-over points among these samples, as well as a large amount of overlap. The shape of the original spectra was quite homogeneous, and no outliers were distinguished a priori by visual inspection. Consistent baseline offsets and bias were present. These are quite common features in NIR spectra acquired by diffuse reflectance techniques.
higher its spectral offset. However, it is possible to assign some overtones and combination bands evidenced in the spectrum, including the following: water peaks were recorded at approximately 1400 and 1940 nm; a weak band at approximately 1160 nm was influenced by absorption exerted by the third sugar-related overtone; absorption peaks were recorded at approximately 1780 nm, associated with the first sugar-related overtone; and the regions from 2110 to 2205 nm and from 2250 to 2260 nm were assigned to N–H and O–H (water) modes, respectively, and were related to a combination of vibrations.
Initially, the PLS method was performed on all of the original spectra to develop the NIR model and thereby predict SSC and pH of the plums nondestructively. Noise and systematic behavior are undesirable features in the spectra. To resolve this issue, the original spectra were transformed by a smoothing (first-order), multiplicative scattering correction (MSC) and first- and second-order derivatives (Savitzky-Golay). The best window for average-smoothing was determined as that consisting of 71 points as it gave models with better predictive abilities than those built using other windows. In all cases, MSC was applied effectively to reduce the offset originally present in the spectra.
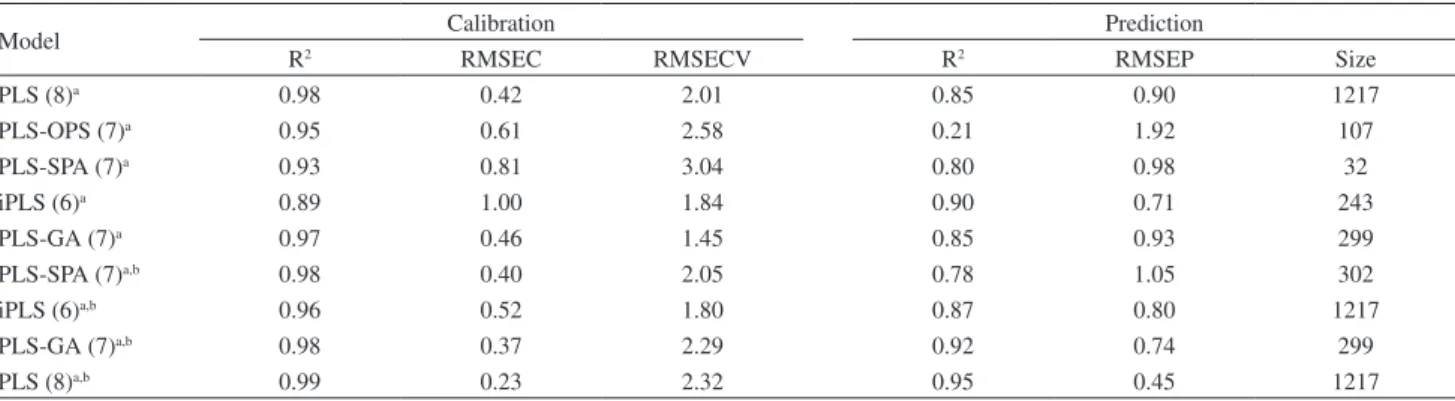
The results obtained for the calibration models in the NIR region for the SSC of plum are shown in Table 1. In addition to the PLS models, the results of the PLS-SPA, PLS-GA, PLS-OPS and iPLS models are shown. Only the best results from the tested pre-processing techniques are presented. The performance of the PLS model is better than that of the iPLS, GA, OPS and SPA models. The correlation coefficients for the prediction set ranged from 0.78 to 0.95 for all models, except for the PLS-OPS model (0.21). In this study, it was observed that in the NIR spectral region, models with derivative data showed higher RMSEP values than models with raw or smoothed data. The number of
latent variables used for the PLS, iPLS, SPA, OPS and GA models using NIR spectra was 6, 7 or 8. The strategy of using GA models had the advantage of requiring few variables (299) to build the PLS models.
The calibration set was optimized by the elimination of the samples that presented leverage, unmodeled residuals in the parameter (SSC) or spectral data. Five outliers were excluded from the calibration set, and the best PLS model for SSC was developed by applying a smoothing with 71 points, first derivative with 15 points and MSC. For this model, the lowest root mean square error of cross validation (RMSECV) and RMSEP were 0.23 and 0.45, respectively. The correlation coefficient for the validation set was 0.95 and was obtained using 8 latent variables. This model was not significantly different when compared
with the reference values according to a paired t-test (95%
confidence level). Figure 2 shows the goodness of the fit, presented by plotting the measured and predicted values for SSC in plums.
Table 1. Results for calibration and the external validation set for SSC: root mean square error of cross validation (RMSECV) and prediction (RMSEP), coefficient of correlation (R2) and the number of spectral variables used (size). The number of factors in PLS, iPLS, PLS-SPA, PLS-GA and OPS models are shown in parentheses
Model Calibration Prediction
R2 RMSEC RMSECV R2 RMSEP Size
PLS (8)a 0.98 0.42 2.01 0.85 0.90 1217
PLS-OPS (7)a 0.95 0.61 2.58 0.21 1.92 107
PLS-SPA (7)a 0.93 0.81 3.04 0.80 0.98 32
iPLS (6)a 0.89 1.00 1.84 0.90 0.71 243
PLS-GA (7)a 0.97 0.46 1.45 0.85 0.93 299
PLS-SPA (7)a,b 0.98 0.40 2.05 0.78 1.05 302
iPLS (6)a,b 0.96 0.52 1.80 0.87 0.80 1217
PLS-GA (7)a,b 0.98 0.37 2.29 0.92 0.74 299
PLS (8)a,b 0.99 0.23 2.32 0.95 0.45 1217
aSmoothing 71 points and MSC; bone application of outlier detection.
Table 2 shows the results for the analysis of the pH of the plums. In all the models, better values were obtained for the RMSEP with smoothed data (91 points) compared with the models obtained with original raw or pre-processed data. For this parameter, the variable selection using the iPLS, the OPS and SPA algorithms produced better results than those of PLS principally for OPS. The best algorithm found for the variable selection of this parameter was the GA algorithm. When 295 spectral variables were used to build the PLS-GA (6) model, a correlation coefficient of 0.85 for the prediction set was found.
Outlier detection was applied to the best model, but the number of samples excluded was so large with respect to the total number of samples that they were not considered. The best model was developed using the variable selection GA, Figure 3 shows the correlation between the measured pH values of intact plum and those predicted by the best
model, PLS-GA (6) smoothing (91 pts) and MSC, based
on NIR spectroscopy. A t-test showed no significant
difference (95% confidence level) between this model and the reference method.
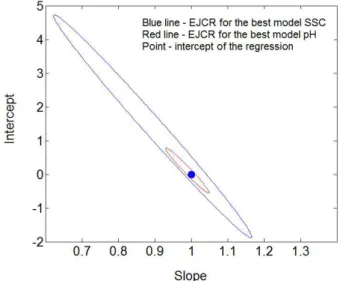
An elliptic joint confidence region (EJCR) was drawn for both the slope and the intercept when plotting the
predicted vs. actual parameter values, as shown in Figure 4.
EJCR calculations are a convenient way to determine if bias is present in the determination of both parameters when using PLS models. Figure 4 shows the EJCR for the slope and intercept of the predicted SSC and pH, respectively, for an external validation set and reference value regression at a 95% confidence interval. As observed in this figure, the ellipse contains the expected theoretical value of (1.0) when built for both parameters (SSC and pH).
The presence of relevant bias was tested with the
prediction results for the validation samples by the t-test
Table 2. Results for calibration and the external validation set for pH: root mean square error of cross validation (RMSECV) and prediction (RMSEP), coefficient of correlation (R2) and the number of spectral variables used (Size). The number of factors in PLS, iPLS, PLS-SPA, PLS-GA and OPS models are shown in parentheses
Model Calibration Prediction
R2 RMSEC RMSECV R2 RMSEP Size
PLS (8)a 0.99 0.02 0.15 0.84 0.18 1209
PLS-OPS (6)a 0.98 0.05 0.32 0.34 0.17 302
PLS-SPA (7)a 0.98 0.04 0.33 0.34 0.17 302
PLS-OPS (8)a 0.99 0.03 0.33 0.33 0.17 302
iPLS (8)a 0.97 0.04 0.25 0.68 0.21 121
PLS-SPA (8)a 0.97 0.04 0.29 0.72 0.19 32
PLS-GA (8)a 0.98 0.02 0.08 0.85 0.17 295
PLS-GA (7)a,b 0.99 0.02 0.071 0.90 0.07 295
aSmoothing 91 pts. MSC; bone application of outlier detection.
Figure 3. Predicted concentration vs. reference measured concentration of calibration and validation samples for pH in plums using PLS-GA model after outlier test, () calibration set and () validation set.
suggested by ASTM E1655-00.18 Results showed that
the bias included in the model was not significant since
the t-values obtained 2.07 and 2.17 for BRIX and pH,
respectively, and were lower that the critical value of 2.576 with 99% of confidence.
Conclusion
In this work, a rapid and nondestructive method to determine the SSC and pH of intact plums using NIR spectroscopy and multivariate calibration was presented. It can be concluded that NIR is a very promising technique for the nondestructive quantification of important parameters in plums. It must be highlighted that the results here obtained from the analysis of intact plums, without any preliminary sample preparation, should be considered a first step in the modification of NIR technology for on-site and on-line control purposes.
Acknowledgement
The authors wish to thank the Programa de Pós-Graduação em Química (PPGQ) da UFRN.
References
1. Paz, P.; Sánchez, M.-T.; Pérez-Marín, D.; Guerrero, J.-E.; Garrido-Varo, A.; Comput. Eletron. Agric.2009, 69, 24. 2. Saranwong, S.; Sornsrivichai, J.; Kawano, S.; J. Near Infrared
Spectrosc.2003, 11, 175.
3. Lingxia, H.; Di, W.; Hangfeng, J.; Jiukai, Z.; Yong, H.; Chengfu, L.; Biosystems Eng.2011, 109, 377.
4. Pérez-Marín, D.; Sánchez, M.-T.; Paz, P.; Soriano, M.-A.; Guerrero, J.-E.; Garrido-Varo, A.; Postharvest Biol. Technol.
2009, 52, 180.
5. Tong, S.; Hongjian, L.; Huirong, X.; Yibin, Y.; Postharvest Biol. Technol. 2009, 51, 86.
6. Guoqiang, F.; Jianwen, Z.; Ran, D.; Lin, G.; J. Food Eng.2009, 93, 416.
7. Sánchez, M.-T.; De La Haba, M. J.; Benítez-López, M.; Fernández-Novales, J.; Garrido-Varo, A.; Pérez-Marín, D.; J. Food Eng.2012, 110, 102.
8. Huang, L.; Wu, D.; Jin, H.; Zhang, J.; He, Y.; Lou, C.; Biosystems Eng.2011, 109, 377.
9. Sánchez, M.-T.; De La Haba, M. J.; Guerrero, J. E.; Garrido-Varo, A.; Pérez-Marín, D.; Postharvest Biol. Technol.
2011, 60, 130.
10. Xudong, S.; Hailiang, Z.; Yande, L.; Int. J. Agric. Biol. Eng.
2009, 2, 65.
11. Sun, T.; Lin, H.; Xu, H.; Ying, Y.; Postharvest Biol. Technol.
2009, 51, 86.
12. Nørgaard, L.; Saudland, A.; Wagner, J.; Nielsen, J. P.; Munck, L.; Engelsen, S. B.; Appl. Spectrosc.2000, 54, 413. 13. Ferrand, M.; Huquet, B.; Barbey, S.; Barillet, F.; Faucon, F.;
Larroque, H.; Leray, O.; Trommenschlager, J. M.; Brochard, M.; Chemom. Intell. Lab. Syst.2011, 106, 183.
14. Araújo, M. C. U.; Saldanha, T. C. B.; Galvão, R. K. H.; Yoneyama, T.; Chame, H. C.; Visani, V.; Chemom. Intell. Lab. Syst.2001, 57, 65.
15. Teófilo, R. F.; Martins, J. P. A.; Ferreira, M. M. C.; J. Chemometr.
2009, 23, 32.
16. Valderrama, P.; Braga, J. W. B.; Poppi, R. J.; J. Agr. Food Chem.
2007, 55, 8331.
17. Kennard, R. W.; Stone, L. A.; Technometrics1969, 111, 137. 18. ASTM-E1655-00: Standard Practices for Infrared
Multivariate Quantitative Analysis,ASTMInternational: West Conshohocken, Pennsylvania, USA, 2000.
Submitted: January 11, 2013