PANOECONOMICUS, 2014, 3, pp. 349-367
Received: 07 February 2012; Accepted: 17 October 2013.
UDC 336.71:330.13 DOI: 10.2298/PAN1403349B Original scientific paper
Willem Karel M. Brauers Faculty of Applied Economics; Institute for Development Policy and Management,
University of Antwerpen, Belgium
Romualdas Ginevičius
Department of Enterprise Economics and Business Management, Gediminas Technical University, Lithuania
Askoldas Podviezko
Department of Enterprise Economics and Business Management, Gediminas Technical University, Lithuania
Development of a Methodology
of Evaluation of Financial Stability
of Commercial Banks
Summary: The field of evaluation of financial stability of commercial banks, which emanates from persistent existence of financial crisis, induces interest of researchers for over a century. The span of prevailing methodologies stretches from over-simplified risk-return approaches to ones comprising large number of economic variables on the micro- and/or macro-economic level. Methodologies of rating agencies and current methodologies reviewed and applied by the ECB are not intended for reducing information asymmetry in the market of commer-cial banks. In the paper it is shown that the Lithuanian financommer-cial system is bank-based with deposits of households being its primary sources, and its stability is primarily depending on behavior of depositors. A methodology of evaluation of commercial banks with features of decreasing information asymmetry in the market of commercial banks is being developed by comparing different MCDA methods.
Key words:MOORA, MULTIMOORA, Bank evaluation, Financial stability, CAMEL.
JEL: C44, C61, G21, O22.
350 Willem Karel M. Brauers, Romualdas Ginevičius and Askoldas Podviezko
The ECB tools for financial stability analysis comprise three branches. Name-ly, identification of important sources of system-wide vulnerabilities; assessment of the potential costs to the real economy in the case of a financial distress; fragilities of the financial institutions network and contagion (Vítor Constâncio 2012). In Irving Fisher Committee bulletin issued by the BIS a comprehensive review of attempts of central banks in creating a single aggregate measure for assessing financial stability is provided (Blaise Gadanecz and Kaushik Jayaram 2008). The reviewed methodolo-gies concentrate on a wide variety of indexes, which are grouped to six categories by the sectors of the economy characteristics of which they describe: the real sector, the corporate sector’s riskiness, the household sector’s health, the external sector, the financial sector, and financial markets. The composite indicator of systemic stress developed by the ECB comprises five segments: money, bond, equity and foreign exchange markets, and financial intermediaries. Four categories of models of macro-prudential supervision are described: early warning models, macro stress-testing models, contagion and spillover models, and the models indicating the current state of systemic instability are described (ECB 2010).
On the other hand, the information asymmetry is invariably listed among the causes of financial crisis, especially in the bank-based financial systems (Joseph R. Mason 2009; Houssem Rachdi 2010), which is also the case for Lithuania, which financial system is bank-based. In fact, based on data from Thorsten Beck, Asli Demirgüç-Kunt, and Ross Levine (2010) this conclusion can be made. To mention two the most important criteria, in 2009 the ratio of assets of the banking sector to the GDP in Lithuania was 0.735, and capitalisation of stock market of this country being 0.188 the same year. Proportion between the two criteria is considerably higher than in the historically known bank-based country, such as Germany, where the ratio of assets of the banking sector to the GDP in 2009 was 1.151, and stock market capi-talisation was 0.747 the same year. Consequently, stability of the financial system of Lithuania depends primarily on stability of commercial banks. By the other hand, stability of commercial banks depends primarily on behavior of depositors as the major part of its assets is financed with household deposits.
As of January 2013 households and non-financial corporations’ deposits in Li-thuania account 90.92% of total deposits in this country. Consequently, it is the ma-jor part of the total of deposits. In the same period the structure of the deposits was short-term, as 90.47% of all households’ and non-financial corporations’ deposits in Lithuania were of up to one-year maturity (Lietuvos Bankas 2013). From the latter fact it becomes obvious that depositor’s behavior primarily depends on the short-term considerations. In order to be successful evaluation methodology must promptly deliver results in understandable formats to depositors. Methodologies of rating agencies, which are known in developing rather clear rating scale, have serious shortcomings, which will be described in Section 3.
351 Development of a Methodology of Evaluation of Financial Stability of Commercial Banks
perspective of financial intermediation (Robert C. Merton 1995) suggests that in-crease of competitiveness among financial institutions and inin-crease of their efficien-cy consequently increase financial stability, which is to be understood in the way of stable and efficient performance of core functions of financial system. These major goals for achieving financial stability are in line with the goals outlined in Franklin Allen and Douglas Gale (2000), which attempt to offset deviations of the state of financial system from the model of the general equilibrium by Kenneth J. Arrow and Gerard Debreu (1954), aiming to attain the state of highest efficiency of financial system. Currently such a state is far from being reached because of the following: high information asymmetry, moral hazard, and the lack of competition. On the other hand, systemic risk is closely related to human behavior. Failure of a financial insti-tution can lead to more significant failures causing distress or failure to perform functions of the financial system. Its prevention is seen in increase of transparency and increase of financial supervision.
We strive to influence confidence of depositors in financial intermediaries by reducing information asymmetry in the market. This requires methodologies of prompt evaluation of financial state of financial institutions, which deliver results in understandable formats to depositors. MCDA (multiple criteria decision aid) methods serve as a perfect tool for evaluation of the state of financial stability of commercial banks, which are major financial institutions in Lithuania. A methodology of evalua-tion of commercial banks with features of decreasing informaevalua-tion asymmetry in the market of commercial banks is being developed by comparing different MCDA me-thods.
This paper is organized as follows. Section 1 carries the concept of evaluation of commercial banks registered in Lithuania. Section 2 describes variables used in the evaluation. Section 3 describes robustness of MOORA method and two possible ways of gathering objectives into a single super-objective. Section 4 describes MOORA method. Section 5 describes MULTIMOORA method, the theory of do-minance, and the results of the evaluation. Section 6 concludes.
1. Concept of Evaluation of Commercial Banks
In this paper Lithuanian banks are evaluated using multiple criteria decision aid me-thods. The authors use several MCDA methods for the purpose of increasing reliabil-ity of the evaluation and for comparison of different methods.
The topic of evaluation of financial stability of commercial banks is rather popular. In Lithuania a MCDA research on client-based variables has been attempted by Romualdas Ginevičius and Valentinas Podvezko (2008), Askoldas Podviezko and Ginevičius (2010), Ginevičius and Podviezko (2011, 2013), Willem Karel M. Brauers, Ginevičius, and Podviezko (2012), Podviezko (2012) etc.
asym-352 Willem Karel M. Brauers, Romualdas Ginevičius and Askoldas Podviezko
metry level in the market of commercial banks and depositors by providing results of evaluation in different forms in order to suit the level of comprehension of every de-positor thus enabling him as a decision-maker to obtain adequate perception of bank financial stability in accordance with his level of comprehension. The list of criteria could be extended to comprise both micro- and macro-economic criteria; stress-testing could be performed using deviated values of criteria for calculations.
Our paper is based on a categorization of banks comprising major types of ob-jectives. A selection is proposed on basis of a classification which is very popular by the researchers on bank activities, namely CAMEL. CAMEL represents the abbrevia-tion of Capital adequacy, Asset quality, Management quality, Earnings and Liquidity. This categorization is used by the American Federal Reserve, FDIC (deposit insur-ance) and the OCC (Office of the Comptroller of the Currency), (Podviezko and Ginevičius 2010). It comprises major types of objectives representing stability of banks. The well known international rating agency, Moody’s Investors Service uses CAMEL-based objectives (David Fanger 2007).
Brenda González-Hermosillo (1999) cites as macro-economic factors of fi-nancial instability: “cyclical output downturns, adverse terms of trade shocks, de-clines in asset prices, rising real interest rates, boom-bust cycles in inflation, credit expansion, losses of foreign exchange reserves and capital inflows”. With the bank-ing crisis in Asian countries of 1996-1997 Demirgüç-Kunt and Enrica Detragiache (1998) and Daniel C. Hardy and Ceyla Pazarbasioglu (1998) argue that these models missed these crisis. Nevertheless, we have not to consider the macro-economic ap-proach as the banks we investigate are registered in Lithuania and therefore are oper-ating in the same macro-economic environment, governed by the same Law on Banks (Lietuvos Respublikos Seimas 2011) and deposits made with these banks are insured by the same State Enterprise “Deposit and Investment Insurance”. The year 2007 is taken as basis as the later years were seriously biased. The years 2008 and 2009 were characterized by a serious recession largely due to the sub-prime and bank crisis problems. The year 2008 was in the middle of the serious recession in the high-income countries from the end of 2007 until the end of 2009 (Symposium Macroeco-nomics after the Financial Crisis 2010 with the following articles: Alan J. Auerbach, William G. Gale, and Benjamin H. Harris 2010; Richard Baldwin 2010; Robert E. Hall 2010; Lee E. Ohanian 2010).
2. The List of Objectives Based on the CAMEL
353 Development of a Methodology of Evaluation of Financial Stability of Commercial Banks
2.1 Capital Adequacy
In 1988 the introduction of Basel I capital adequacy framework has set capital ade-quacy requirements on banks and is considered to be a major regulatory measure, which reduces credit risk in activities of banks. While in Basel I capital adequacy framework credit risk is only considered, in addition a new capital adequacy frame-work, referred to as Basel II, accounts operational and market risk. Capital adequacy ratio is calculated by dividing capital by risk-weighted assets accounted separately for credit, market and operational risks (BIS 2004). Calculation of capital adequacy ratio in banks is required to hold total capital equivalent to at least 8% of their risk-weighted assets (Board of the Bank of Lithuania 2006).
The Central Bank of Lithuania adds up the two. We also add both Tier 1 and Tier 2 capital ratios, but since Tier 2 capital is more risky than Tier 1 capital (Ray Barrell et al. 2011), we rather assume that Tier 1 is two times more important than Tier 2. This difference in appreciation reveals the difference of risk for the two types of capital.
The resulting single CAPITAL objective is clearly a maximising one, since the larger the capital, the more it can absorb losses, including ones arising from bad loans, low cost and earning efficiency as from interest rate and trading.
2.2 Assets
Assets category is represented by four ratios:
(i) The first ratio requires the maximization of net interest income as a per-centage of RWA (risk-weighted assets). We have undertaken a conserva-tive view as we believe that this objecconserva-tive, as well as two other following objectives in Earnings category, more adequately accounts profitability of assets in terms of riskiness than in the case if interest income was di-vided by total assets. This view corresponds to risk-adjusted return on capital measurement model and is also employed by Moody’s Investors Service (Fanger 2007);
(ii) The second is the ratio between loans as the most risky assets and total assets. This ratio requires minimization;
(iii) The third ratio is delinquent loans to total assets. In Lithuania, loans are considered to be delinquent if they are overdue for 60 days or longer. This ratio requires minimization;
(iv) The fourth ratio within the category is the decrease of value of assets over the reported year divided by total assets. This ratio requires minimi-zation.
2.3 Management
Management category is represented by a single ratio, expressing cost-efficiency of a
354 Willem Karel M. Brauers, Romualdas Ginevičius and Askoldas Podviezko
2.4 Earnings
The category of earnings is represented by two ratios, which both have to be max-imized:
(a) Pre-provision profits compared to risk-weighted assets. This ratio reveals the capability of a bank to generate cash, which could then serve as a remedy for various losses;
(b) Net income compared to risk-weighted assets. This second ratio expresses profitability of a bank by revealing remaining profits after all deductions have been made;
(c) The chosen above described ratios form the set of criteria for our multiple criteria evaluation. Some of the criteria are maximising, some are minimis-ing as their effect on bank stability is different. The higher the earnminimis-ings, the larger the capital ratios, the more efficient expenditure management and the better loan portfolio, then the likelihood of failure is smaller (David C. Wheelock and Paul W. Wilson2000), and as values of all criteria cannot be simultaneously improved in the real economic environment without making trade-offs between them, multiple criteria evaluation is designed to expose the general level of stability of each bank.
2.5 Liquidity
Finally, the last liquidity category is represented by two ratios:
(1)The part of deposits in total loans. We chose the deposits represented only by customer deposits and excluded more volatile inter-bank deposits. This ratio requires maximization, thus setting the goal for a bank of the most stable loan-financing from the customer-deposit source;
(2)The regulatory liquidity ratio imposed by the Central bank, i.e. the Bank of Lithuania. This ratio indicates the short-term liquidity position of a bank within a month.
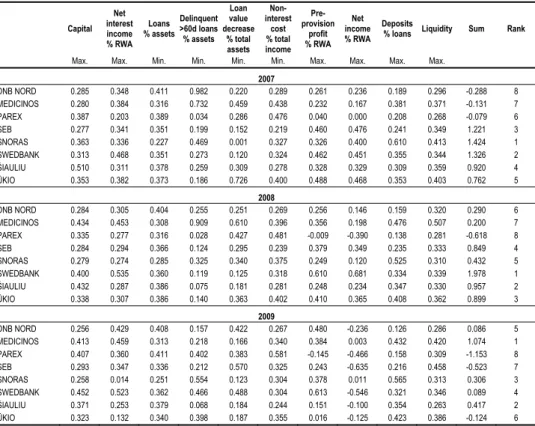
Table 1 shows values of the chosen criteria representing performance of Li-thuanian banks on the defined objectives. Data is taken from annual audited financial statements of Lithuanian commercial banks as such approach is reliable and popular among researchers (Sami Mensi 2010).
3. Evaluation Methodology
Upon investigation of popular available methods of evaluation of bank stability, namely methodologies applied by rating agencies and statistical methods, the authors made a choice in favour of the MCDM methods (Ginevičius and Podviezko 2012).
355 Development of a Methodology of Evaluation of Financial Stability of Commercial Banks
Table 1 Objectives for Lithuanian Banks
Capital % of RWA
Net interest income % RWA
Loans % assets
Delinquent >60d loans % assets
Loan value decrease % assets
Non-interest
cost % total income
Pre- provision
profit % RWA
Net income % RWA
Deposits % loans Liquidity
Max. Max. Min. Min. Min. Min. Max. Max. Max. Max.
2007
DNB NORD 5.61 2.64 83.42 0.26 0.19 30.61 1.71 1.23 48.08 36.24
MEDICINOS 5.50 2.91 64.21 1.15 0.39 46.41 1.52 0.87 97.04 45.51
PAREX 7.62 1.54 78.93 0.05 0.24 50.38 0.26 0.00 52.95 32.79
SEB 5.45 2.59 71.35 0.31 0.13 23.23 3.02 2.47 61.42 42.78
SNORAS 7.15 2.55 46.03 0.74 -0.20 34.64 2.14 2.08 155.43 50.63
SWEDBANK 6.17 3.55 71.21 0.43 0.10 34.28 3.03 2.34 90.48 42.20
ŠIAULIU 10.04 2.36 76.79 0.41 0.26 29.46 2.15 1.71 78.72 44.03
ŪKIO 6.95 2.90 75.71 0.29 0.61 42.34 3.20 2.43 89.85 49.43
2008
DNB NORD 6.59 2.60 85.95 1.06 0.50 24.62 1.58 0.62 34.27 37.47
MEDICINOS 10.08 3.86 65.53 8.39 1.21 36.27 2.20 0.85 102.62 59.43
PAREX 7.78 2.36 67.14 0.26 0.84 43.99 -0.05 -1.67 29.86 32.93
SEB 6.59 2.50 77.92 1.14 0.59 21.87 2.35 1.49 50.72 38.99
SNORAS 6.47 2.33 60.60 3.00 0.67 34.33 1.54 0.51 113.17 36.37
SWEDBANK 9.28 4.56 76.57 1.10 0.25 29.14 3.78 2.92 72.06 39.76
ŠIAULIU 10.04 2.44 82.06 0.69 0.36 25.73 1.54 1.00 74.90 38.75
ŪKIO 7.85 2.61 82.19 1.29 0.72 36.77 2.53 1.57 87.93 42.45
2009
DNB NORD 6.39 2.58 86.36 3.36 4.77 24.33 2.47 -3.93 33.10 37.61
MEDICINOS 10.29 2.77 66.17 3.02 1.88 30.95 1.98 0.05 113.31 55.31
PAREX 10.14 2.17 87.00 5.56 4.33 52.82 -0.75 -7.77 41.55 40.74
SEB 7.31 2.09 71.10 2.94 6.45 29.61 1.25 -10.60 56.57 60.31
SNORAS 6.43 0.08 53.18 7.66 1.39 27.66 1.95 0.18 148.07 41.26
SWEDBANK 11.29 3.15 76.60 6.45 5.52 27.61 3.16 -9.11 84.11 45.50
ŠIAULIU 9.26 1.52 80.05 0.95 2.08 22.15 0.78 -1.67 92.74 34.61
ŪKIO 8.05 0.80 71.82 5.51 2.12 32.25 0.08 -2.08 110.93 50.86
Source: AB Bankas SNORAS (2008, 2009), AB DnB NORD Bankas (2008, 2009), AB Parexbankas (2008, 2009), AB SEB Bankas (2008, 2009), AB Swedbank (2008, 2009), AB Šiauliu Bankas (2008, 2009), AB Ūkio Bankas (2008, 2009), UAB Medicinos Bankas (2008, 2009); compiled by authors.
attractive for the purpose of reducing information asymmetry in the market of com-mercial banks are: informal relationship with bank management; the fact that rating agencies are paid by financial institutions; formed oligopoly of rating agencies. Also, ratings of financial intermediaries are bounded by ceilings of sovereign ratings, while they do not relate to financial statements of the evaluated intermediaries (Ginevičius and Podviezko 2011). The above contrasts with the feature of the quantitative evalua-tion to produce objective evaluaevalua-tion based on quantitative data, chosen by the au-thors.
356 Willem Karel M. Brauers, Romualdas Ginevičius and Askoldas Podviezko
years. This means that the uniform standard is being applied for the relatively short period of time. Financial crisis introduce distortions to the data, which cannot be considered as sufficiently stable to apply statistical methods. The number of com-mercial banks existing in Lithuania even decreased after bankruptcy of AB Bankas SNORAS in 2011, and AB Ūkio Bankas in 2012 to seven, which precludes from considering the set of banks as being sufficiently large.
In cases, when the sample and data are scarce and exact information cannot be obtained, operational research methods are the best option. Fast-gained popularity of the methods after their introduction to finance proved advantages over already hav-ing been used statistical methods and the methods used by credit agencies. Evalua-tion of a financial firm or a bank encompasses more complex consideraEvalua-tions and goals and is not narrowing to solely the risk-return modelling (Ginevičius and Podviezko 2011). The MCDA methods have been created to deal with complex ob-jectives (Jaap Spronk, Ralph E. Steuer, and Constantin Zopounidis 2005).
The methodology of evaluation of financial stability of commercial banks comprises several stages. Results of evaluation are provided in several formats: in the form of ranking, in graphical format exposing performance of commercial banks in terms of CAMEL categories, in analytical format by all chosen criteria of financial performance of banks (Podviezko 2012). Recently an additional useful tool com-menced to be developed: the evaluation of economic objects and processes using MCDA methods by comparison of alternatives with hypothetic objects (Ginevičius, Podvezko, and Podviezko 2012; Podvezko and Podviezko 2013), which is also de-signed to be used in the methodology of evaluation of financial stability of commer-cial banks.
The whole variety of MCDA methods are being used by researchers. For the researcher in multi-objective decision support systems the choice between many me-thods is not very easy. Indeed numerous theories were developed since the forerun-ners: Nicolas de Condorcet (1785), Hermann H. Gossen (1853), Hermann Minkowsky (1896, 1911), Vilfredo Pareto (1906) and pioneers like Maurice G. Kendall (1948), Bernard Roy, Raphaël Benayoun, and Bernard Sussman (1966), David W. Miller and Martin K. Starr (1969), Ching-Lai Hwang and Kwangsun Yoon (1981), Thomas L. Saaty (1988), Brauers (2004a, b), Serafim Opricovic and Gwo-Hshiung Tzeng (2004), Jean-Pierre Brans and Bertrand Mareschal (2005), see also Podvezko and Podviezko (2010a, b).
357 Development of a Methodology of Evaluation of Financial Stability of Commercial Banks
4. Multi-Objective Optimization by Ratio Analysis (MOORA)
4.1 The Two Parts of MOORA
The method starts with a matrix of responses of different alternatives on different objectives (xij),with xij as the response of alternative j on objective i:
i=1, 2,…, n as the objectives
j=1, 2,…, m as the alternatives.
MOORA goes for a ratio system in which each response of an alternative on an objective is compared to a denominator, which is representative for all alternatives concerning that objective. For this denominator the square root of the sum of squares of each alternative per objective is chosen. Brauers and Edmundas K. Zavadskas (2006) proved that this is the most robust choice:
∑
= =
m 1
j xij2
ij x *
ij
x (1)
with:
xij = response of alternative j on objective i,
j = 1, 2,..., m; m the number of alternatives,
i = 1, 2,…, n; n the number of objectives,
xij* = a dimensionless number representing the normalized response of
alter-native j on objective i.
Dimensionless numbers, having no specific unit of measurement, are obtained for instance by deduction, multiplication or division. The normalized responses of the alternatives on the objectives belong to the interval [0; 1]. However, sometimes the interval could be [-1; 1]. Indeed, for instance in the case of productivity growth some sectors, regions or countries may show a decrease instead of an increase in productivity i.e. a negative dimensionless number.
For optimization these responses are added in case of maximization and sub-tracted in case of minimization:
∑
=
+ =
∑
=
= =
n i
1 g
i ij*
x g
i
1
i ij*
x * j
y (2)
with:
i = 1, 2,…, g as the objectives to be maximized,
i = g+1, g+2,…, n as the objectives to be minimized,
yj* = the normalized assessment of alternative j with respect to all objectives.
An ordinal ranking of the yj shows the final preference.
For the second part of MOORA the Reference Point Theory is chosen with the
Min-Max Metric of Tchebycheff as given by the following formula (Samuel Karlin
358 Willem Karel M. Brauers, Romualdas Ginevičius and Askoldas Podviezko
(3)
with | ri – xij*| the absolute value if xij* is larger than ri for instance by minimization.
This reference point theory starts from the already normalized ratios as de-fined in the MOORA method, namely Equation (1). Preference is given to a refer-ence point possessing as co-ordinates the dominating co-ordinates per attribute of the candidate alternatives and which is designated as the Maximal Criterion Reference Point. This approach is called realistic and non-subjective as the co-ordinates, which are selected for the reference point, are realized in one of the candidate alternatives. The alternatives A(10; 100), B(100; 20) and C(50; 50) will result in the maximal cri-terion reference point Rm(100; 100).
4.2 The Full Multiplicative Form of Multiple Objectives
Mathematical economics is familiar with the multiplicative models like in production functions (e.g. Cobb-Douglas and Input-Output formulas) and demand functions (Rudolf Teekens and Johan Koerts 1972), but the multiplicative form for multi-objectives was introduced in 1969 by Miller and Starr (1969) and further developed by Brauers (2004a).
The following n-power form for multi-objectives is called from now on a
full-multiplicative form in order to distinguish it from the mixed forms:
∏ = =
n
1
i ij
x j
U (4)
with:
j = 1, 2, ..., m; m the number of alternatives,
i = 1, 2,…, n; n being the number of objectives,
xij= response of alternative j on objective i,
Uj = overall utility of alternative j.
The overall utilities (Uj), obtained by multiplication of different units of
mea-surement, become dimensionless. Stressing the importance of an objective can be done by adding an α-term or by allocating an exponent (a Significance Coefficient) on condition that this is done with unanimity or at least with a strong convergence in opinion of all the stakeholders concerned. Once again it is assumed that no signific-ance coefficients have to given in this study on the Lithuanian banks for the reasons given above.
How is it possible to combine a minimization problem with the maximization of the other objectives? Therefore, the objectives to be minimized are denominators in the formula:
j j
j B
A
U' = (5)
359 Development of a Methodology of Evaluation of Financial Stability of Commercial Banks
∏
= =
i
1
g gi
x j
A (6)
where:
j = 1, 2,..., m; m the number of alternatives,
i = the number of objectives to be maximized.
n
i k kj j x
B
1
, (7)
where:
n-i = the number of objectives to be minimized,
Uj' = the utility of alternative j with objectives to be maximized and objectives
to be minimized.
The Full Multiplicative Form is read horizontally in the Response Matrix of Table 5 presented in the Appendix. Nevertheless with the full-multiplicative form, the overall utilities, obtained by multiplication of different units of measurement, become dimensionless measures. This situation would not bias the outcomes amidst the several alternatives as the last ones are represented by dimensionally homogene-ous equations, being: “formally independent of the choice of units” (Fritz J. de Jong 1967).
5. MULTIMOORA as Applied for the Banks Registered in
Lithuania
Appendix gives details in Tables 3-6 for MOORA and the Multiplicative Form (Equ-ations 1-6) concerning commercial banks registered in Lithuania. Following Tables 2a, b and c, gives the reaction of the projects on the objectives after the MULTI-MOORA approach,a summary of the three methods in accordance with the theory of dominance (Brauers, Alvydas Balezentis, and Tomas Balezentis 2011; Brauers and Zavadskas 2011).
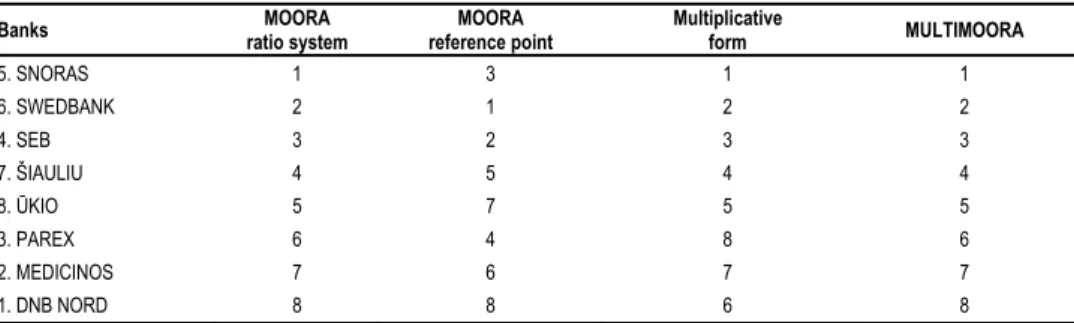
Table 2a The Reaction of the Banks on the Objectives after the MULTIMOORA Approach for 2007
Banks MOORA
ratio system
MOORA reference point
Multiplicative
form MULTIMOORA
5. SNORAS 1 3 1 1
6. SWEDBANK 2 1 2 2
4. SEB 3 2 3 3
7. ŠIAULIU 4 5 4 4
8. ŪKIO 5 7 5 5
3. PAREX 6 4 8 6
2. MEDICINOS 7 6 7 7
1. DNB NORD 8 8 6 8
360 Willem Karel M. Brauers, Romualdas Ginevičius and Askoldas Podviezko
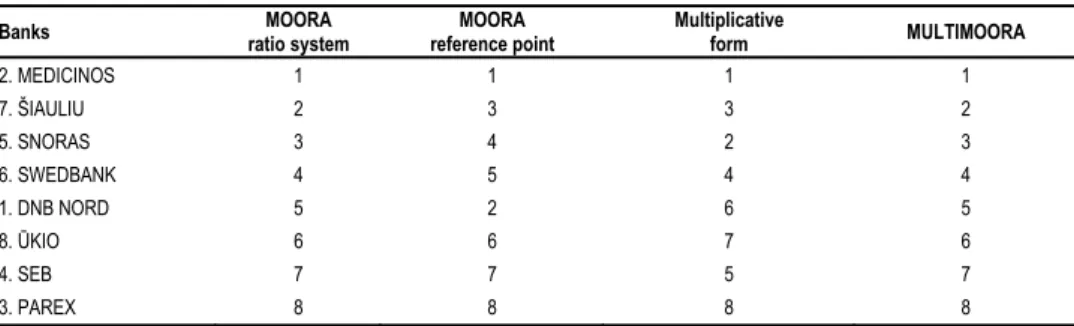
Table 2b The Reaction of the Banks on the Objectives after the MULTIMOORA Approach for 2008
Banks MOORA
ratio system
MOORA reference point
Multiplicative
form MULTIMOORA
6. SWEDBANK 1 1 1 1
7. ŠIAULIU 2 4 2 2
8. ŪKIO 3 2 3 3
4. SEB 4 3 4 4
1. DNB NORD 6 5 6 5
5. SNORAS 5 6 8 6
2. MEDICINOS 7 7 7 7
3. PAREX 8 8 5 8
Source: Authors’ calculations.
Table 2c The Reaction of the Banks on the Objectives after the MULTIMOORA Approach for 2009
Banks MOORA
ratio system
MOORA reference point
Multiplicative
form MULTIMOORA
2. MEDICINOS 1 1 1 1
7. ŠIAULIU 2 3 3 2
5. SNORAS 3 4 2 3
6. SWEDBANK 4 5 4 4
1. DNB NORD 5 2 6 5
8. ŪKIO 6 6 7 6
4. SEB 7 7 5 7
3. PAREX 8 8 8 8
Source: Authors’ calculations.
Results are showing satisfactory correspondence with the previously obtained results using four MCDA methods SAW, TOPSIS, COPRAS, and PROMETHEE II (Ginevičius and Podviezko 2013). Rankings of banks in 2007 deviate by no more than two positions in 2007-2008, and are identical in 2009 with few exceptions, namely AB Šiaulių Bankas in 2007 was assigned with the 4-th position, while in the previous research it was assigned the 1-st position; UAB Medicinos Bankas in 2008 reached the 7-th position, while in Ginevičius and Podviezko (2013) it attained a higher 3-rd position. The deviations could be decreased in case levels of importance were assigned to each criterion.
6. Conclusion
361 Development of a Methodology of Evaluation of Financial Stability of Commercial Banks
References
Allen, Franklin, and Douglas Gale. 2000. Comparing Financial Systems. Cambridge: MIT
Press.
Apergis, Nicholas, and Effrosyni Alevizopoulou. 2010. “Bank Efficiency: Evidence from
Panel of European Banks.” Panoeconomicus, 58(3): 329-341.
Arrow, Kenneth J., and Gerard Debreu. 1954. “Existence of an Equilibrium for a
Competitive Economy.” Econometrica, 22(3): 265-290.
Auerbach, Alan J., William G. Gale, and Benjamin H. Harris. 2010. “Activist Fiscal
Policy.” Journal of Economic Perspective, 24(4): 141-164.
Baldwin, Richard. 2010. The Great Trade Collapse, Causes, Consequences and Prospects.
London: Centre for Economic Policy Research.
Bank for International Settlements - BIS. 2004. International Convergence of Capital
Measurement and Capital Standards: A Revised Framework. Basel: BIS.
Barniv, Ran, and James B. McDonald. 1999. “Review of Categorical Models for
Classification Issues in Accounting and Finance.” Review of Quantitative Finance and
Accounting, 13(1): 39-62.
Barrell, Ray, Philip E. Davis, Tatiana Fic, and Dilruba Karim. 2011. “Tier 2 Capital and
Bank Behaviour.” National Institute of Economic and Social Research Discussion Paper 375.
Beck, Thorsten, Asli Demirgüç-Kunt, and Ross Levine. 2010.“Financial Institutions and
Markets across Countries and over Time: The Updated Financial Development and Structure Database.” World Bank Economic Review, 24(1): 77-92.
Board of the Bank of Lithuania. 2006. “On the General Regulations for the Calculation of
Capital Adequacy.” Board of the Bank of Lithuania Resolution 138.
Brans, Jean-Pierre, and Bertrand Mareschal. 2005. “PROMETHEE Methods.” In Multiple
Criteria Decision Analysis: State of the Art Surveys, ed. Jose Figueira, Salvatore
Greco, and Matthias Ehrgott, 163-195. Boston: Springer.
Brauers, Willem Karel M. 2004a. Optimization Methods for a Stakeholder Society, a
Revolution in Economic Thinking by Multi-Objective Optimization. Boston: Kluwer.
Brauers, Willem Karel M. 2004b. “Multi-Objective Optimization for Facilities
Management.” Journal of Business Economics and Management, 5(4): 173-182.
Brauers, Willem Karel M., and Edmundas K.Zavadskas. 2006. “The MOORA Method
and Its Application to Privatization in a Transition Economy.” Control and
Cybernetics,35(2): 443-468.
Brauers, Willem Karel M., Alvydas Balezentis, and Tomas Balezentis. 2011.
“MULTIMOORA for the EU Member States Updated with Fussy Number Theory.”
Technological and Economic Development of Economy, 17(2): 259-290.
Brauers, Willem Karel M., and Edmundas K. Zavadskas. 2011. “MULTIMOORA
Optimization Used to Decide on a Bank Loan to Buy Property.” Technological and
Economic Development of Economy, 17(1): 174-188.
Brauers, Willem Karel M., Romualdas Ginevičius, and Askoldas Podviezko. 2012.
“Evaluation of Performance of Lithuanian Commercial Banks by Multi-Objective Optimization.” In The 7th International Scientific Conference “Business and
Management 2012”, ed. Romualdas Ginevičius, Aleksandras V. Rutkauskas, and
362 Willem Karel M. Brauers, Romualdas Ginevičius and Askoldas Podviezko
Cantor, Richard. 2001. “Moody’s Investors Service Response to the Consultative Paper
Issued by the Basel Committee on Bank Supervision ‘A New Capital Adequacy Framework’.” Journal of Banking and Finance, 25(1): 171-185.
Constâncio, Vítor. 2012. “Financial Stability - Measurement and Policy.”
http://www.bis.org/review/r120619a.pdf.
De Condorcet, Nicolas. 1785. Essai sur l’application de l’analyse à la probabilité des
décisions rendues à la pluralité des voix. Paris: L’Imprimerie Royale.
De Jong, Fritz J. 1967. Dimensional Analysis for Economists. Amsterdam: North-Holland.
Demirgüç-Kunt, Asli, and Enrica Detragiache. 1998. “Financial Liberalization and
Financial Fragility.”International Monetary Fund Working Paper 98/83.
Ergungor, Emre O., and James B. Thomson. 2005. “Systemic Banking Crisis.” Federal
Reserve Bank of Cleveland Policy Discussion Paper 9.
European Central Bank - ECB. 2010.Financial Stability Review June. Frankfurt am Main:
ECB.
Fanger, David. 2007. “Bank Financial Strength Ratings: Global Methodology.”
https://www.moodys.com/researchdocumentcontentpage.aspx?docid=PBC_102151.
Gadanecz, Blaise, and Kaushik Jayaram. 2008.“Measures of Financial Stability - A
Review.” Irving Fisher Committee Bulletin 31.
Ginevičius, Romualdas, and Valentinas Podvezko. 2008. “Multicriteria Evaluation of
Lithuanian Banks from the Perspective of Their Reliability for Clients.” Journal of
Business Economics and Management,9(4): 257-267.
Ginevičius, Romualdas, and Askoldas Podviezko. 2011. “A Framework of Evaluation of
Commercial Banks.” Intellectual Economics, 1(9): 37-53.
Ginevičius, Romualdas, Valentinas Podvezko, and Askoldas Podviezko. 2012.
“Evaluation of Isolated Socio-Economical Processes by a Multi-Criteria Decision Aid Method ESP.” In The 7th International Scientific Conference “Business and
Management 2012”, ed. Romualdas Ginevičius, Aleksandras V. Rutkauskas, and
Jelena Stankeviciene, 1083-1089. Vilnius: Technika.
Ginevičius, Romualdas, and Askoldas Podviezko. 2012. “Sprendimų paramos metodų
taikymo ypatumai komercinių bankų finansinio stabilumo vertinime.” Business:
Theory and Practice, 13(4): 314-323.
Ginevičius, Romualdas, and Askoldas Podviezko. 2013. “The Evaluation of Financial
Stability and Soundness of Lithuanian Banks.” Ekonomska istraživanja: znanstveno
stručni časopis, 26(2): 191-208.
González-Hermosillo, Brenda. 1999. “Determinants of Ex-Ante Banking System Distress: A
Macro-Micro Empirical Exploration of some Recent Episodes.” International Monetary Fund Working Paper 99/33.
Gossen, Hermann H. 1853. Entwicklung der gesetze des Menschlichen Verkehrs und der
daraus Flieszenden Regeln für Menschliches Handeln, 3 Auflage. Berlin: Prager.
Hall, Robert E. 2010. “Why Does an Economy Fall to Pieces after a Financial Crisis?”
Journal of Economic Perspectives, 24(4): 3-20.
Hardy, Daniel C., and Ceyla Pazarbasioglu. 1998. “Leading Indicators of Banking Crisis:
Was Asia Different?” International Monetary Fund Staff Papers, 46(3): 247-258.
Houben, Aerdt, Jan Kakes, and Garry Schinasi. 2004. “Toward a Framework for
363 Development of a Methodology of Evaluation of Financial Stability of Commercial Banks
Hwang, Ching-Lai, and Kwangsun Yoon. 1981. Multiple Attribute Decision Making,
Methods and Applications: A State-of-the-Art Survey. Berlin: Springer.
Karlin, Samuel, and William J. Studden. 1966. Tchebycheff Systems: With Applications in
Analysis and Statistics. New York: Interscience Publishers.
Kendall, Maurice G. 1948. Rank Correlation Methods. London: Charles Griffin.
Langohr, Herwig, and Patricia Langohr. 2008. The Rating Agencies and Their Credit
Ratings: What They Are, How They Work and Why They Are Relevant. Chichester:
Wiley.
Lietuvos Bankas. 2013. Monthly Bulletin 2013. Vilnius: Lietuvos Bankas.
Lietuvos Respublikos Seimas. 2011. Valstybės Žinios.
http://www3.lrs.lt/pls/inter3/dokpaieska.showdoc_l?p_id=230458&p_query=&p_tr2= (accessed June 25, 2011).
Mason, Joseph R. 2009. “Regulating for Financial System Development, Financial
Institutions Stability, and Financial Innovation.”
http://papers.ssrn.com/sol3/papers.cfm?abstract_id=1393409.
Mensi, Sami. 2010. “Measurement of Competitiveness Degree in Tunisian Deposit Banks:
An Application of the Panzar and Rosse Model.” Panoeconomicus, 57(2): 189-207.
Merton, Robert C. 1995. “A Functional Perspective of Financial Intermediation.” Financial
Management, 24(2): 23-41.
Miller, David W., and Martin K. Starr. 1969. Executive Decisions and Operations
Research. New Jersey: Prentice-Hall Inc.
Minkowsky, Hermann. 1896. Geometrie der Zahlen. Leipzig: Teubner.
Minkowsky, Hermann. 1911. Gesammelte Abhandlungen. Leipzig: Teubner.
Mishkin, Frederic S. 1999. “Global Financial Instability: Framework, Events, Issues.”
Journal of Economic Perspectives, 13(4): 3-20.
Moody’s Investors Service. 2011. “Moody’s Ratings System in Brief.”
http://www.moodys.com/uploadpage/2005700000433096.pdf (accessed December 27, 2011).
Ohanian, Lee E. 2010. “The Economic Crisis from a Neoclassical Perspective.” Journal of
Economic Perspectives, 24(4): 45-66.
Opricovic, Serafim, and Gwo-Hshiung Tzeng. 2004. “Compromise Solution by MCDM
Methods: A Comparative Analysis of VIKOR and TOPSIS.” European Journal of
Operational Research,156(2): 445-455.
Pareto, Vilfredo. 1906. Manuale di Economia Politica. Milano: Societa Editrice.
Podvezko, Valentinas, and Askoldas Podviezko. 2010a. “Dependence of Multi-Criteria
Evaluation Result on Choice of Preference Functions and Their Parameters.”
Technological and Economic Development of Economy, 16(1): 143-158.
Podvezko, Valentinas, and Askoldas Podviezko. 2010b. “Use and Choice of Preference
Functions for Evaluation of Characteristics of Socio-Economical Processes.”In The 6th
International Scientific Conference “Business and Management 2010”, ed. Romualdas
Ginevičius, Aleksandras V. Rutkauskas, and Remigijs Pocs, 1066-1071. Lithuania: Technika.
Podvezko, Valentinas, and Askoldas Podviezko. 2013. “Naujos absoliutaus daugiakriterio
vertinimo galimybės.” Lietuvos Matematikos Rinkinys, 54(B):54-59.
Podviezko, Askoldas, and Romualdas Ginevičius. 2010. “Economic Criteria Characterising
364 Willem Karel M. Brauers, Romualdas Ginevičius and Askoldas Podviezko
“Business and Management 2010”, ed. Romualdas Ginevičius, Aleksandras V.
Rutkauskas, and Remigijs Pocs, 1072-1079. Lithuania: Technika.
Podviezko, Askoldas. 2012. “Augmenting Multicriteria Decision Aid Methods by Graphical
and Analytical Reporting Tools.” In Workshops on Business Informatics Research,ed. Laila Niedrite, Renata Strazdina, and Benkt Wangler, 236-251. Berlin: Springer.
Rachdi, Houssem. 2010. “The Link between International Supervision and Banking Crisis.”
Panoeconomicus, 57(3): 321-331.
Roy, Bernard, Raphaël Benayoun, and Bernard Sussman. 1966. ELECTRE. Paris: Société
d’Economie et de Mathématique appliquées.
Saaty, Thomas L. 1988. The Analytic Hierarchy Process. New York: Mcgraw-Hill.
Sprague, Oliver M. W. 1910. History of Crisis under the National Banking System.
Washington: Government Printing Office.
Spronk, Jaap, Ralph E. Steuer, and Constantin Zopounidis. 2005. “Multicriteria Decision
Aid/Analysis in Finance.” In Multiple Criteria Decision Analysis: State of the Art
Surveys, ed.José Figueira, Salvatore Greco, and Matthias Ehrgott, 799-857. New
York: Springer.
Teekens, Rudolf, and JohanKoerts. 1972. “Some Statistical Implications of the Log
Transformation of Multiplicative Models.” Econometrica, 40(5): 793-819.
Webb Cooper, Elizabeth. 2009. “Monitoring and Governance of Private Banks.” The
Quarterly Review of Economics and Finance, 49(2): 253-264.
Wheelock, David C., and Paul W.Wilson. 2000. “Why Do Banks Disappear? The
Determinants of U.S. Bank Failures and Acquisitions.” The Review of Economics and
Statistics, 82(1): 127-138.
365 Development of a Methodology of Evaluation of Financial Stability of Commercial Banks
Appendix
Sources for Table 1
AB Bankas SNORAS. 2008. “2008 Separate and Consolidated Financial Statements.”
http://www.snoras.com/files/Snoras-2008-EN.
AB Bankas SNORAS. 2009. Bankas Snoras AB (SRS1L) 2009 Annual Report. Vilnius:
Bankas Snoras.
AB DnB NORD Bankas. 2008. “Consolidated Annual Report, Separate and Consolidated
Financial Statements for the Year Ended 31 December 2008.”
http://www.dnb.lt/sites/default/files/dokumentai/ataskaitos/dnb_nord_fs_31_12_2008_ en_with_ar.pdf.
AB DnB NORD Bankas. 2009. “Consolidated Annual Report, Separate and Consolidated
Financial Statements for the Year Ended 31 December 2009.”
http://www.nasdaqomxbaltic.com/upload/reports/ndl/2009_ar_en_ltl_con_ias.pdf.
AB Parexbankas. 2008. “Konsoliduotas Metinis Vadovbös Pranešimas 2008.”
https://www.citadele.lt/uploads/PB_FS_2008_LT_final2.pdf.
AB Parexbankas. 2009. “Konsoliduotas Metinis Pranešimas 2009.”
https://www.citadele.lt/uploads/finansine-atskaitomybe-2010-01-01.pdf.
AB SEB Bankas. 2008. “Annual Report 2008.”
http://sebgroup.com/Documents/Investor_Relations/Annual_Reports/Annual_Report_ 2008.pdf?epslanguage=en.
AB SEB Bankas. 2009. “Annual Report 2009.”
http://sebgroup.com/Documents/Investor_Relations/Annual_Reports/Annual_Report_ 2009.pdf.
AB Swedbank. 2008. “Annual Report 2008.”
http://www.swedbank.com/idc/groups/public/@i/@sbg/@gs/@ir/documents/financial/ cid_006911.pdf.
AB Swedbank. 2009. “Annual Report 2009.”
http://www.swedbank.ru/filemanager/download/452.
AB Šiauliu Bankas. 2008. “Šiauliu Bankas AB Financial Statements 31 December 2008.”
http://www.sb.lt/file/repository/Finansin%C4%97s%20ataskaitos%20EN/2008/1_%20 2008%20metine%20Engl%20new.pdf.
AB Šiauliu Bankas. 2009. “Independent Auditor’s Report Financial Statements and Annual
Report 31 December 2009.”
http://www.sb.lt/file/repository/Finansin%C4%97s%20ataskaitos%20EN/2009/2_%20 annual%20report%20_2009.pdf.
AB Ūkiobankas. 2008. “2008 Metiné Ataskaita.”
http://www.tyliai.lt/pub/showreel/flash/ub/ub_annual_report_2008/pages/UB_Metine_ Ataskaita_2008.pdf.
AB Ūkiobankas. 2009. “Ūkio Banko Racionalaus Investavimo Fondas 2009 Metu Ataskaita.”
http://www.ukiobankas.lt/files/investiciniai_fondai_racionalaus_investavimo/UBRIF_ 2009_ataskaita.pdf.
UAB Medicinos Bankas. 2008. “Financial Statements as of 30 September, 2008.”
http://www.medbank.lt/wp-content/uploads/2013/01/2008_2.pdf.
UAB Medicinos Bankas. 2009. “Financial Statements as of 30 June, 2009.”
366 Willem Karel M. Brauers, Romualdas Ginevičius and Askoldas Podviezko
Table 3 Sum of Squares and Their Square Roots
Capital Net interest income % RWA Loans % assets Delinquent >60D loans % assets Loan value de-crease % assets Non-interest cost % total income Pre- provision profit % RWA Net income % RWA Deposits % loans Liquidity
2007 19.69 7.58 203.03 1.57 0.84 105.86 6.57 5.20 254.80 122.54
2008 23.22 8.51 212.80 9.23 1.98 91.52 6.19 4.29 215.67 117.25
2009 24.95 6.03 211.48 13.83 11.31 90.97 5.15 16.69 262.23 131.64
Source: Authors’ calculations.
Table 4 Objectives Divided by Their Square Roots and MOORA Ranks
Capital Net interest income % RWA Loans % assets Delinquent >60d loans % assets Loan value decrease % total assets Non-interest cost % total income Pre- provision profit % RWA Net income % RWA Deposits
% loans Liquidity Sum Rank
Max. Max. Min. Min. Min. Min. Max. Max. Max. Max.
2007
DNB NORD 0.285 0.348 0.411 0.982 0.220 0.289 0.261 0.236 0.189 0.296 -0.288 8 MEDICINOS 0.280 0.384 0.316 0.732 0.459 0.438 0.232 0.167 0.381 0.371 -0.131 7 PAREX 0.387 0.203 0.389 0.034 0.286 0.476 0.040 0.000 0.208 0.268 -0.079 6 SEB 0.277 0.341 0.351 0.199 0.152 0.219 0.460 0.476 0.241 0.349 1.221 3 SNORAS 0.363 0.336 0.227 0.469 0.001 0.327 0.326 0.400 0.610 0.413 1.424 1 SWEDBANK 0.313 0.468 0.351 0.273 0.120 0.324 0.462 0.451 0.355 0.344 1.326 2 ŠIAULIU 0.510 0.311 0.378 0.259 0.309 0.278 0.328 0.329 0.309 0.359 0.920 4
ŪKIO 0.353 0.382 0.373 0.186 0.726 0.400 0.488 0.468 0.353 0.403 0.762 5
2008
DNB NORD 0.284 0.305 0.404 0.255 0.251 0.269 0.256 0.146 0.159 0.320 0.290 6 MEDICINOS 0.434 0.453 0.308 0.909 0.610 0.396 0.356 0.198 0.476 0.507 0.200 7 PAREX 0.335 0.277 0.316 0.028 0.427 0.481 -0.009 -0.390 0.138 0.281 -0.618 8 SEB 0.284 0.294 0.366 0.124 0.295 0.239 0.379 0.349 0.235 0.333 0.849 4 SNORAS 0.279 0.274 0.285 0.325 0.340 0.375 0.249 0.120 0.525 0.310 0.432 5 SWEDBANK 0.400 0.535 0.360 0.119 0.125 0.318 0.610 0.681 0.334 0.339 1.978 1 ŠIAULIU 0.432 0.287 0.386 0.075 0.181 0.281 0.248 0.234 0.347 0.330 0.957 2
ŪKIO 0.338 0.307 0.386 0.140 0.363 0.402 0.410 0.365 0.408 0.362 0.899 3
2009
DNB NORD 0.256 0.429 0.408 0.157 0.422 0.267 0.480 -0.236 0.126 0.286 0.086 5 MEDICINOS 0.413 0.459 0.313 0.218 0.166 0.340 0.384 0.003 0.432 0.420 1.074 1 PAREX 0.407 0.360 0.411 0.402 0.383 0.581 -0.145 -0.466 0.158 0.309 -1.153 8 SEB 0.293 0.347 0.336 0.212 0.570 0.325 0.243 -0.635 0.216 0.458 -0.523 7 SNORAS 0.258 0.014 0.251 0.554 0.123 0.304 0.378 0.011 0.565 0.313 0.306 3 SWEDBANK 0.452 0.523 0.362 0.466 0.488 0.304 0.613 -0.546 0.321 0.346 0.089 4 ŠIAULIU 0.371 0.253 0.379 0.068 0.184 0.244 0.151 -0.100 0.354 0.263 0.417 2
ŪKIO 0.323 0.132 0.340 0.398 0.187 0.355 0.016 -0.125 0.423 0.386 -0.124 6
Source: Authors’ calculations.
Table 5 Reference Point Theory with Ratios: Co-Ordinates of the Reference Point Equal to the Maximal Objective Values
Capital Net interest income % RWA Loans % assets Delinquent >60D loans % assets Loan value de-crease % assets Non-interest cost % total income Pre- provision profit % RWA Net income % RWA Deposits % loans Liquidity
2007 0.510 0.468 0.227 0.034 0.001 0.219 0.488 0.476 0.610 0.413 2008 0.434 0.535 0.285 0.028 0.125 0.239 0.610 0.681 0.525 0.507 2009 0.452 0.523 0.251 0.068 0.123 0.244 0.613 0.011 0.565 0.458
367 Development of a Methodology of Evaluation of Financial Stability of Commercial Banks
Table 6 Reference Point Theory: Deviations from the Reference Point
Capital Net interest income % RWA
Loans % assets
Delinquent >60d loans % assets
Loan value decrease
% total assets
Non- interest
cost % total income
Pre- provision
profit % RWA
Net income % RWA
Deposits
% loans Liquidity Sum Rank
Max. Max. Min. Min. Min. Min. Max. Max. Max. Max.
2007
DNB NORD 0.225 0.120 0.184 0.948 0.219 0.070 0.227 0.240 0.421 0.117 0.948 8 MEDICINOS 0.230 0.084 0.090 0.698 0.457 0.219 0.256 0.309 0.229 0.042 0.698 6 PAREX 0.123 0.265 0.162 0.000 0.285 0.257 0.448 0.475 0.402 0.146 0.475 4 SEB 0.233 0.127 0.125 0.166 0.151 0.000 0.028 0.000 0.369 0.064 0.369 2 SNORAS 0.147 0.132 0.000 0.435 0.000 0.108 0.162 0.076 0.000 0.000 0.435 3 SWEDBANK 0.197 0.000 0.124 0.239 0.119 0.104 0.026 0.025 0.255 0.069 0.255 1 ŠIAULIU 0.000 0.157 0.151 0.226 0.308 0.059 0.160 0.147 0.301 0.054 0.308 5
ŪKIO 0.157 0.086 0.146 0.153 0.724 0.181 0.000 0.008 0.257 0.010 0.724 7
2008
DNB NORD 0.150 0.230 0.119 0.227 0.126 0.030 0.355 0.535 0.366 0.187 0.535 5 MEDICINOS 0.000 0.082 0.023 0.881 0.486 0.157 0.254 0.483 0.049 0.000 0.881 7 PAREX 0.099 0.258 0.031 0.000 0.302 0.242 0.619 1.071 0.386 0.226 1.071 8 SEB 0.150 0.242 0.081 0.096 0.171 0.000 0.231 0.332 0.290 0.174 0.332 3 SNORAS 0.155 0.261 0.000 0.296 0.215 0.136 0.362 0.561 0.000 0.197 0.561 6 SWEDBANK 0.034 0.000 0.075 0.091 0.000 0.080 0.000 0.000 0.191 0.168 0.191 1 ŠIAULIU 0.001 0.248 0.101 0.047 0.056 0.042 0.362 0.447 0.177 0.176 0.447 4
ŪKIO 0.096 0.228 0.101 0.112 0.238 0.163 0.201 0.316 0.117 0.145 0.316 2
2009
DNB NORD 0.196 0.094 0.133 0.246 0.438 0.172 0.157 0.089 0.299 0.024 0.438 2 MEDICINOS 0.040 0.064 0.229 0.008 0.133 0.038 0.061 0.150 0.044 0.097 0.229 1 PAREX 0.046 0.163 0.759 0.476 0.406 0.149 0.160 0.333 0.261 0.337 0.759 8 SEB 0.159 0.176 0.371 0.646 0.349 0.000 0.085 0.144 0.448 0.082 0.646 7 SNORAS 0.195 0.510 0.235 0.000 0.000 0.145 0.000 0.485 0.000 0.061 0.510 4 SWEDBANK 0.000 0.000 0.000 0.557 0.244 0.113 0.111 0.398 0.365 0.060 0.557 5 ŠIAULIU 0.081 0.270 0.463 0.110 0.211 0.195 0.127 0.000 0.061 0.000 0.463 3
ŪKIO 0.130 0.391 0.597 0.135 0.142 0.072 0.088 0.330 0.065 0.111 0.597 6