BGD
10, 6637–6669, 2013Synergism between elevatedpCO2 and
temperature
A. Torstensson et al.
Title Page
Abstract Introduction
Conclusions References
Tables Figures
◭ ◮
◭ ◮
Back Close
Full Screen / Esc
Printer-friendly Version
Interactive Discussion
Discussion
P
a
per
|
Dis
cussion
P
a
per
|
Discussion
P
a
per
|
Discussio
n
P
a
per
|
Biogeosciences Discuss., 10, 6637–6669, 2013 www.biogeosciences-discuss.net/10/6637/2013/ doi:10.5194/bgd-10-6637-2013
© Author(s) 2013. CC Attribution 3.0 License.
Open Access
Biogeosciences
Discussions
Geoscientiic Geoscientiic
Geoscientiic Geoscientiic
This discussion paper is/has been under review for the journal Biogeosciences (BG). Please refer to the corresponding final paper in BG if available.
Synergism between elevated
p
CO
2
and
temperature on the Antarctic sea ice
diatom
Nitzschia lecointei
A. Torstensson*, M. Hedblom*, J. Andersson1, M. X. Andersson1, and A. Wulff1 1
Department of Biological and Environmental Sciences, University of Gothenburg, P.O. Box 461, 405 30 G ¨oteborg, Sweden
*
These authors contributed equally to this work.
Received: 21 March 2013 – Accepted: 24 March 2013 – Published: 10 April 2013
Correspondence to: A. Torstensson ([email protected])
BGD
10, 6637–6669, 2013Synergism between elevatedpCO2 and
temperature
A. Torstensson et al.
Title Page
Abstract Introduction
Conclusions References
Tables Figures
◭ ◮
◭ ◮
Back Close
Full Screen / Esc
Printer-friendly Version
Interactive Discussion
Discussion
P
a
per
|
Dis
cussion
P
a
per
|
Discussion
P
a
per
|
Discussio
n
P
a
per
|
Abstract
Polar oceans are particularly susceptible to ocean acidification and warming. Diatoms play a significant role in sea ice biogeochemistry and provide an important food source to grazers in ice-covered oceans, especially during early spring. However, the ecophys-iology of ice living organisms has received little attention in terms of ocean acidification.
5
In this study, the synergism between temperature and partial pressure of CO2(pCO2) was investigated in relationship to the optimal growth temperature of the Antarctic sea ice diatom Nitzschia lecointei. Diatoms were kept in cultures at controlled levels of
pCO2 (∼390 and∼960 µatm) and temperature (−1.8 and 2.5◦C) for 14 days.
Syner-gism between temperature andpCO2was detected in growth rate and acyl lipid fatty
10
acid content. Carbon enrichment only promoted (3 %) growth rate closer to the optimal growth, but not at the control temperature (−1.8◦C). Optimal growth rate was observed around 5◦C in a separate experiment. Polyunsaturated fatty acids (PUFA) comprised up to 98 % of the total acyl lipid fatty acid pool at−1.8◦C. However, the total content
of fatty acids was reduced by 39 % at elevatedpCO2, but only at the control
tempera-15
ture. PUFAs were reduced by 30 % at highpCO2. Effects of carbon enrichment may be different depending on ocean warming scenario or season, e.g. reduced food quality for higher trophic levels during spring. Synergy between temperature andpCO2 may be particularly important in polar areas since a narrow thermal window generally limits cold-water organisms.
20
1 Introduction
High latitude marine environments are particularly vulnerable to ocean acidification due to the high solubility of CO2 in cold waters (Orr et al., 2005). Therefore, the Southern Ocean has a naturally low carbonate saturation state and is believed to be one of the first oceans to become persistently undersaturated with respect to aragonite (Orr et al.,
25
2005; Steinacher et al., 2009). Along with elevated levels of greenhouse gases in the
BGD
10, 6637–6669, 2013Synergism between elevatedpCO2 and
temperature
A. Torstensson et al.
Title Page
Abstract Introduction
Conclusions References
Tables Figures
◭ ◮
◭ ◮
Back Close
Full Screen / Esc
Printer-friendly Version
Interactive Discussion
Discussion
P
a
per
|
Dis
cussion
P
a
per
|
Discussion
P
a
per
|
Discussio
n
P
a
per
|
atmosphere, an increase in average sea surface temperature (SST) of 0.74◦C has been recorded from year 1906 to 2005 (IPCC, 2007). Mean SST is predicted to rise 1–4◦C by the year 2100, and the largest impacts are predicted to occur in polar areas (IPCC, 2007). For instance, the summer sea ice extent in the Arctic has declined since the late 1970’s, and recent models have predicted a sea ice-free Arctic Ocean during
5
the summer, within the next 30 yr (Wang and Overland, 2009). In fact, the extent of sea ice in the Arctic reached a record low as reported in September 2012 (NSDIC Arctic Sea Ice News and Analysis, 2012, available at http://nsidc.org).
The climate has been relatively stable from a geological perspective in Antarctica, hence enabling adaptation to extreme environmental conditions. However, selection
10
can also result in the loss of important abilities that allow for adaptation to environ-mental change. Examples of such loss have been reported in ectothermic organisms inhabiting the Southern Ocean, and suggests that Antarctic organisms are particu-larly sensitive to these types of changes (Somero, 2012). One common adaptation to changes in temperature is alteration of the lipid composition in the cell membrane.
15
According to the hypothesis of “homeoviscous adaptation”, the composition of lipids will change when temperature prevent functioning of the membrane beyond the mem-brane lipids optimal function range (Hazel, 1995). To maintain memmem-brane fluidity at temperatures below that of freezing seawater, sea ice algae increase the proportion of unsaturated fatty acids. For instance, Teoh et al. (2004) reported a significant decrease
20
in polyunsaturated fatty acids (PUFA) at temperatures above 4◦C in an Antarctic strain
ofNaviculasp. In addition, fatty acid (FA) composition and nutrient stoichiometry can
be directly related to the food quality transferred to higher trophic levels and is known to be negatively affected by ocean acidification (Rossoll et al., 2012; Schoo et al., 2012). However, little is still known about the effects of ocean acidification on microalgal lipid
25
FA composition.
BGD
10, 6637–6669, 2013Synergism between elevatedpCO2 and
temperature
A. Torstensson et al.
Title Page
Abstract Introduction
Conclusions References
Tables Figures
◭ ◮
◭ ◮
Back Close
Full Screen / Esc
Printer-friendly Version
Interactive Discussion
Discussion
P
a
per
|
Dis
cussion
P
a
per
|
Discussion
P
a
per
|
Discussio
n
P
a
per
|
providing a substantial carbon source to higher levels. During spring, the early offset from sea ice to blooming ice algae in the water column is very important for grazers, as ice algae are abundant and contain high levels of PUFA compared to phytoplank-ton. The peak of the sea ice algal bloom occurs before the peak of the pelagic bloom, meaning the sea ice algal community may act as a significant seeding population to the
5
pelagic bloom when dispersed in the marginal ice zone (see Lizotte, 2001). The timing is crucial and a mismatch due to a changing climate could have serious consequences for organisms higher in the food web (Hoegh-Guldberg and Bruno, 2010). Moreover, the physiochemical properties, e.g. salinity, partial pressure of CO2(pCO2), of sea ice vary substantially during the season. During freezing, pCO2 is increased compared
10
to the surrounding seawater due to concentration of solutes, CaCO3 precipitation and microbial respiration. As the ice becomes warmer and more permeable to liquids, the conditions can be similar to the surrounding seawater and atmosphere (Geilfus et al., 2012). However, during sea ice blooms, the fugacity of carbon dioxide (fCO2) can be
<100 µatm (Fransson et al., 2011; Geilfus et al., 2012). Hence, the temporal variation
15
ofpCO2in sea ice is generally higher compared to the surrounding seawater, although
pCO2 in brine can be similar to the atmosphere during the growing season of the ice algal community.
Phytoplankton tend to exhibit elevated growth rates in warmer temperatures within their thermal window (Eppley, 1972). More specifically for polar algae, minor
temper-20
ature elevations tend to favor pschycrophilic pennate diatom species, with optimum growth temperature usually reported around 4–5◦C (Fiala and Oriol, 1990). In general, optimal photosynthetic activity and growth of pschycrophilic algae often occurs at tem-peratures above natural conditions (Fiala and Oriol, 1990). In addition, both positive, negative and no responses to increasedpCO2have been reported in marine diatoms
25
(Yang and Gao, 2012). However, many laboratory studies are performed at, or close to, the optimal growth temperature, rather than at ambient conditions. If temperature and
pCO2act synergistically, the interpretation of experiments performed at optimal growth could be ambiguous in terms of global change.
BGD
10, 6637–6669, 2013Synergism between elevatedpCO2 and
temperature
A. Torstensson et al.
Title Page
Abstract Introduction
Conclusions References
Tables Figures
◭ ◮
◭ ◮
Back Close
Full Screen / Esc
Printer-friendly Version
Interactive Discussion
Discussion
P
a
per
|
Dis
cussion
P
a
per
|
Discussion
P
a
per
|
Discussio
n
P
a
per
|
The carbon-fixating enzyme RUBISCO can only utilize dissolved CO2 as an inor-ganic carbon source. Since cellular uptake of dissolved inorinor-ganic carbon (DIC) creates a gradient in the water surrounding the cell, diatoms may suffer from CO2-limitation at the cell surface during a bloom (e.g. Riebesell et al., 1993). Almost all marine algal groups have evolved carbon concentrating mechanisms (CCMs) to assist carbon
fixa-5
tion in photosynthesis when CO2is limited (see Reinfelder, 2011). It has also been sug-gested that CCMs are an evolutionary response to the change of atmospheric gases over geological time, where the ratio of O2and CO2 has increased (Hopkinson et al., 2011). Carbonic anhydrase (CA) is a major CCM, catalysing the reversible dehydration of HCO−3 into CO2externally at the surface of algal cells (CAext), or internally in the cell
10
at the site of carbon fixation (CAint) (Morant-Manceau et al., 2007; Hopkinson et al., 2011). Studies suggests that CA activity in diatoms is induced at low levels ofpCO2 in order to maintain photosynthetic activity at differentpCO2 (Burkhardt et al., 2001). Hence, as CCMs are considered costly, their efficiency will play an important role in determining the success of different photoautotrophs in a high-CO2world.
15
To understand the effects of climate change, combined effects of different stressors need to be addressed. Since temperature and CO2 concentration play an important role in microalgal physiology, there is great potential for synergism between these two environmental stressors. The goal of this investigation was to evaluate potential syn-ergism between elevated pCO2 and temperature on the ecophysiology of a sea ice
20
diatom and relate the response to its optimal growth temperature. This was performed during two laboratory perturbation experiments. In Experiment A, the physiology of the Antarctic sea ice diatomNitzschia lecointei van Heurck 1909 was examined after being exposed to a worst-case scenario of elevated SST and increasedpCO2by year 2100. In Experiment B, we addressed the optimal growth temperature ofN. lecointei in order
25
BGD
10, 6637–6669, 2013Synergism between elevatedpCO2 and
temperature
A. Torstensson et al.
Title Page
Abstract Introduction
Conclusions References
Tables Figures
◭ ◮
◭ ◮
Back Close
Full Screen / Esc
Printer-friendly Version
Interactive Discussion
Discussion
P
a
per
|
Dis
cussion
P
a
per
|
Discussion
P
a
per
|
Discussio
n
P
a
per
|
2 Material and methods
2.1 Experimental setup
The diatomN. lecointeiwas isolated from sea ice in the Amundsen sea (January 2011) and cultivated in f/2 medium with silica (Guillard, 1975) at−1.8◦C until the experiments started. In this study (Experiment A), we simulated a worst-case scenario according
5
to the predicted models of SST and pCO2 by the year 2100 (IPCC, 2007). During the experiment, N. lecointei was inoculated (1.6×10⁶cells L−1) in 220 mL batch cul-tures containing f/2 medium with silica, prepared from 0.2 µm filtered Antarctic sea-water (salinity 33). The experimental treatments were set up using flasks and tubing system similar to Torstensson et al. (2012). The temperature treatments (−1.8±0.2◦C
10
and 2.5±0.2◦C) were maintained using two identical cooling and circulating water baths
(Hetofrig, Birkerød, Denmark) containing a mix of MilliQ water and transparent ethylene glycol. Quadruplicated cultures were constantly bubbled (∼6 mL min−1flask−1) with synthetic air prepared with two different pCO2 levels (390 and 960 µatm, Air Liquide, Malm ¨o, Sweden) within each temperature treatment. In addition, four separate
repli-15
cates were used for initial measurements. One control (f/2 medium without diatoms) per treatment combination was used to monitor the carbonate system in absence ofN.
lecointei(i.e. alkalinity perturbation and carbon uptake).
A second experiment (Experiment B) was set up to investigate the optimal growth temperature ofN. lecointei.N. lecointei was inoculated in batch cultures to an initial
20
concentration of 5.2×10 5cells L−1 in 360 mL f/2 medium with silica, prepared from
0.2 µm filtered Antarctic seawater (salinity 33). Water baths equipped with cooling and circulation provided five temperature treatments, ranging from−2.3◦C to 8.4◦C (
−2.3±
0.3◦C, 2.4±0.7◦C, 5.1±0.1◦C and 8.4±0.1◦C), where five borosilicate culture flasks
were deployed in each bath. The water baths were filled with a mix of MilliQ water and
25
colourless ethylene glycol. To prevent carbon limitation and create agitation, the flasks were constantly bubbled with air.
BGD
10, 6637–6669, 2013Synergism between elevatedpCO2 and
temperature
A. Torstensson et al.
Title Page
Abstract Introduction
Conclusions References
Tables Figures
◭ ◮
◭ ◮
Back Close
Full Screen / Esc
Printer-friendly Version
Interactive Discussion
Discussion
P
a
per
|
Dis
cussion
P
a
per
|
Discussion
P
a
per
|
Discussio
n
P
a
per
|
For both experiments, the irradiance was provided from Osram Lumilux Cool Day-light L36W/865 tubes, with a photosynthetic active radiation (PAR) irradiance at 25 µmol photons m−2s−1(light : dark cycle 23 : 1), corresponding to an irradiance within sea ice at high latitudes. The light intensity was not limiting according to the light sat-uration point (Ek) as measured with rapid light curves using Water-PAM (see below).
5
Temperatures in the water baths were monitored using temperature loggers (HOBO Pendant, Onset Computer Corporation, Pocasset, USA). Sampling occurred on day 0 and day 14 in both experiments.
2.2 Carbonate system
pH was measured at the total scale (pHT) using the spectrophotometric method withm
-10
cresol purple indicator (Clayton and Byrne, 1993). 3 mL of sample was carefully trans-ferred into a 10.00 mm cuvette and 30 µLm-cresol purple was added. Temperature of the sample was immediately measured using a thermistor (A Precision, Ama-Digit ad 15th, Amarell GmbH & Co. KG, Kreuzwertheim, Germany). The pHT was determined after calculations of Clayton and Byrne (1993).
15
Total alkalinity (AT) was measured potentiometrically using an automatic titration sys-tem (Metrohm 888 Titrando, Metrohm Aquatrode Plus Pt1000). Samples were stored in darkness at 3◦C until analysis within 24 h. 35–40 g of sample was weighed and titrated with 0.05 M HCl and the Gran equivalence point was determined according to Har-aldsson et al. (1997). For corrections ofAT, a certified reference material (CRM) from
20
Scripps Institution of Oceanography, CA, USA, was titrated in triplicates prior to titration of samples. The variation within triplicates was 0.5 % of the averageAT.
The carbonate system (pCO2, [HCO−3], [CO23−] and [CO2]) was described using the chemical speciation program CO2SYS (Pierrot et al., 2006) with measured values of pHT,AT, salinity and in situ temperature. The dissociation constants for carbonic acid,
25
BGD
10, 6637–6669, 2013Synergism between elevatedpCO2 and
temperature
A. Torstensson et al.
Title Page
Abstract Introduction
Conclusions References
Tables Figures
◭ ◮
◭ ◮
Back Close
Full Screen / Esc
Printer-friendly Version
Interactive Discussion
Discussion
P
a
per
|
Dis
cussion
P
a
per
|
Discussion
P
a
per
|
Discussio
n
P
a
per
|
2.3 Photosynthetic activity
The maximum quantum yield of photosystem II (Fv/Fm) was measured using a Water-PAM (Universal control unit, WATER-ED/B, Walz Mess- und Reigeltechnik, Effeltrich, Germany). 4 mL of well-mixed sample was dark-adapted at experimental temperature for 15 min. After dark adaptation, minimum fluorescence (F0) was determined by
ap-5
plying a low level of light and the maximum fluorescence (Fm) by exposing the sample to a short saturation pulse of measuring light (>3000 µmol photons m−2s−1 for 0.8 s). Variable fluorescence (Fv=Fm−F0) and maximum quantum yield (Fv/Fm) were deter-mined for all samples.
2.4 Growth rate 10
Cell count samples were preserved in 2.5 % (final concentration) glutaraldehyde and kept dark at 7◦C until analyses. Counting was performed using a BD FACSCalibur flow cytometer (BD Biosciences, San Jose, CA, USA). For flow estimation, 1.0 µm ultra-sonicated FluoSpheres (Invitrogen, Eugene, OR, USA) were used as an internal stan-dard. The FluoSphere concentration was calibrated against TruCount absolute
count-15
ing beads (BD Biosciences, San Jose, CA, USA) in triplicated runs. Samples were analysed until a minimum of 300 cells were counted. Specific growth rate (µ day−1)
was calculated using Eq. (??):
µ=lnDx−lnD0
tx−t0 (1)
WhereDx is the cell concentration at dayx,D0is the cell concentration at day 0,txis
20
the time in days at dayxandt0is the time in days at day 0.
2.5 Primary productivity
Total primary productivity, i.e. without separating particulate and dissolved carbon productivity (PPPOC and PPDOC), was measured using the radiocarbon technique
BGD
10, 6637–6669, 2013Synergism between elevatedpCO2 and
temperature
A. Torstensson et al.
Title Page
Abstract Introduction
Conclusions References
Tables Figures
◭ ◮
◭ ◮
Back Close
Full Screen / Esc
Printer-friendly Version
Interactive Discussion
Discussion
P
a
per
|
Dis
cussion
P
a
per
|
Discussion
P
a
per
|
Discussio
n
P
a
per
|
(Aertebjerg and Bresta, 1984). 10 mL of sample was incubated for 1 h with 3 µCi H14CO−
3 (PerkinElmer, Inc., Waltham, MA, USA) at experimental irradiance and
tem-perature in 20 mL glass scintillation vials. One blank from each treatment was wrapped in tin foil for incubation in darkness. After the incubation, 200 µL of formaldehyde was added to all samples to stop the carbon uptake. Two drops of 1 M HCl were added
5
and the samples were bubbled with N2 gas for 1 h to remove the remaining DIC. 10 mL of Insta-Gel Plus (PerklinElmer, Inc., Waltham, MA, USA) scintillation cocktail was added to samples and vials were shaken rigorously. Primary productivity was measured by counting ionizing radiation from the decay of 14C, in a liquid scintilla-tion counter (Packard Tri-Carb 2900TR Liquid Scintillascintilla-tion Analyzer). Carbon uptake
10
was corrected for dark uptake and estimated using Eq. (2):
12C
=
14
CS·12CA·1.06
14C A·t
(2)
Where 12C is the carbon uptake rate (mg C L−1h−1), 14C
S is the radioactive activity
(DPM) in the sample,12CA is the available DIC (mg L−1), 1.06 is a constant adjusting the fixation rate due to the discrimination of 14C during carbon fixation, 14CA is the
15
added activity of 14C to the sample (DPM) and t is the incubation time (h). Carbon uptake was normalized to cell concentrations.
2.6 Carbonic anhydrase activity
During the14C incubation for primary productivity (see above), additional incubations of each sample were prepared with the addition of 400 µM (final concentration)
aceta-20
BGD
10, 6637–6669, 2013Synergism between elevatedpCO2 and
temperature
A. Torstensson et al.
Title Page
Abstract Introduction
Conclusions References
Tables Figures
◭ ◮
◭ ◮
Back Close
Full Screen / Esc
Printer-friendly Version
Interactive Discussion
Discussion
P
a
per
|
Dis
cussion
P
a
per
|
Discussion
P
a
per
|
Discussio
n
P
a
per
|
2.7 Glycerolipid fatty acid composition
40 mL of sample was filtered onto pre-combusted (400◦C, 4 h) GF/F filters. Filters were immediately flash-frozen in liquid nitrogen and transferred to −80◦C until extraction.
A total lipid extract was obtained from the filters after submergence in boiling 2-propanol as described in Andersson et al. (2006). The total lipid extract was subjected to
alka-5
line transesterification (Christie, 1976) and analyzed by GC-MS using an Agilent 7820 GC coupled to an Agilent 5975 mass selective detector. Di-nonadecanoyl phosphatidyl-choline was used as internal standard. The FA methyl esters were separated on a 30 m DB-23 capillary column (J&W Scientific, Folsom, CA, USA) using helium as a carrier gas at a constant flow of 30 cm s−1. The oven was held at 150◦C for 3 min and after that
10
increased by 1◦C min−1to a final temperature of 200◦C. The injector and the detector interface were kept at 250◦C. The methyl esters were identified by retention time and mass spectra compared to authentic lipid standards. Hereafter, the total amount of FA methyl esters is referred to as total FA and grouped by affiliation to: saturated fatty acids (SAFA), monounsaturated fatty acids (MUFA) and polyunsaturated fatty acids (PUFA).
15
2.8 Inorganic nutrients
10 mL of sample was 0.2 µm filtered and stored at−20◦C until analysis of dissolved
in-organic nutrients, NO−
3, NO
−
2, PO4and Si. Samples were analysed at the Sven Lov ´en
Center for Marine Research, Kristineberg, Sweden, using colorimetric methods accord-ing to Grasshoffet al. (1999).
20
2.9 Statistics
Statistical analysis of data was performed using one and two factor ANOVAs. To test the data for homogeneity of variances, Levene’s test was used and Student–Newman– Keuls (SNK) post-hoc analysis was performed when necessary.
BGD
10, 6637–6669, 2013Synergism between elevatedpCO2 and
temperature
A. Torstensson et al.
Title Page
Abstract Introduction
Conclusions References
Tables Figures
◭ ◮
◭ ◮
Back Close
Full Screen / Esc
Printer-friendly Version
Interactive Discussion
Discussion
P
a
per
|
Dis
cussion
P
a
per
|
Discussion
P
a
per
|
Discussio
n
P
a
per
|
3 Results
3.1 Growth and photosynthesis
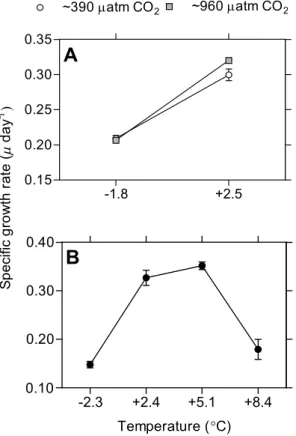
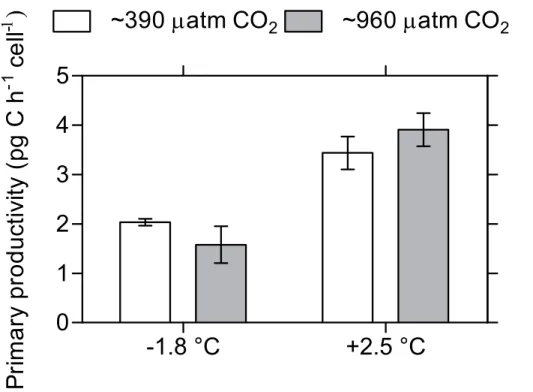
In Experiment A, an interaction between temperature and pCO2 was observed for specific growth rate of N. lecointei (Fig. 1a). Growth rate increased significantly at 960 µatm compared to the 390 µatmpCO2at 2.5◦C. However, there was no difference
5
in growth rate at −1.8◦C. In addition, Fv/Fm (Fig. 2), primary productivity (Fig. 3) and specific growth rate increased significantly with temperature. One sample from the14 C-incubation was lost due to technical error. Statistical analyses results from Experiment A are displayed in Table 1.
3.2 Glycerolipid fatty acid composition 10
There was a significant interaction between treatments for total FA content in Experi-ment A (Fig. 4). At−1.8◦C, total FA content was reduced by 39 % in the 960 µatm treat-ment. However, there was no difference between the twopCO2treatments at 2.5◦C. FA contents decreased with 65–76 % at 2.5◦C compared to
−1.8◦C. The relative
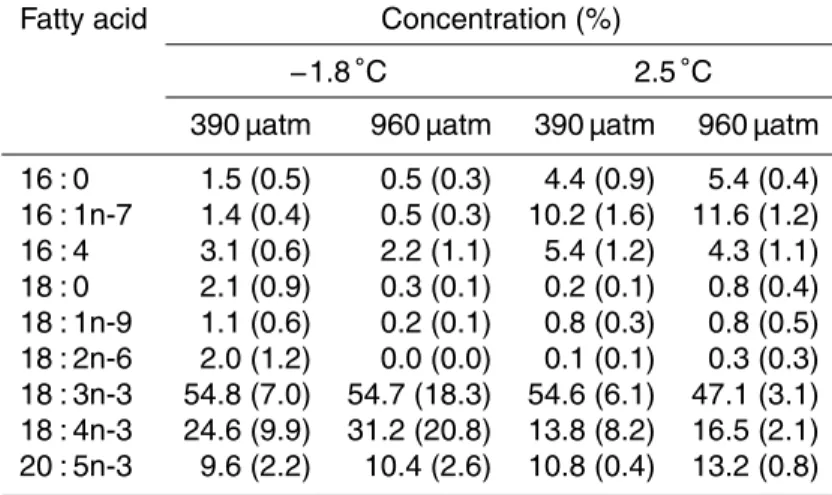
compo-sition of FAs in the treatments is presented in Table 2. Fatty acid compocompo-sition grouped
15
into SAFA, MUFA and PUFA is shown in Fig. 4. PUFA content per cell was signifi-cantly lower in the 2.5◦C treatment compared to the
−1.8◦C. Cellular PUFA content
also decreased significantly with increasingpCO2. No difference in SAFA and MUFA content was detected between treatments. Statistical analysis for SAFA and PUFA was executed with heterogeneous variances, due to inability of transformation (Underwood,
20
1997).
More than 90 % of the PUFA comprised of the omega-3 fatty acids 18 : 3n-3 (α -linolenic acid, ALA), 18 : 4n-3 (stearidonic acid, SDA) and 20 : 5n-3 (eicosapentaenoic acid, EPA). The most common FA was 18 : 3n-3, which accounted for roughly half of the total FA content in all treatments. 18 : 4n-3 accounted for about 20 % of the lipid
25
BGD
10, 6637–6669, 2013Synergism between elevatedpCO2 and
temperature
A. Torstensson et al.
Title Page
Abstract Introduction
Conclusions References
Tables Figures
◭ ◮
◭ ◮
Back Close
Full Screen / Esc
Printer-friendly Version
Interactive Discussion
Discussion
P
a
per
|
Dis
cussion
P
a
per
|
Discussion
P
a
per
|
Discussio
n
P
a
per
|
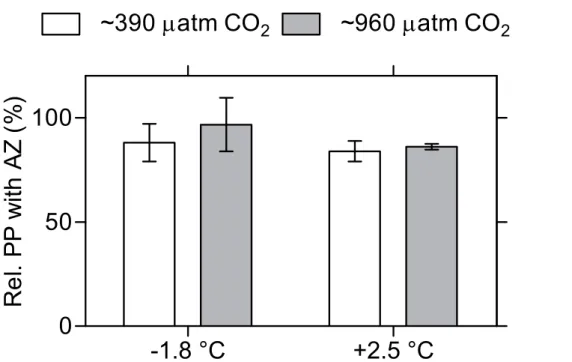
3.3 Carbonic anhydrase activity
A reduction in carbonic anhydrase (CA) activity was observed in 15 measurable sam-ples where AZ was added, giving a mean inhibition of 12 % (Fig. 5). However, no sig-nificant difference between treatments was detected on CA activity.
3.4 Optimal growth temperature 5
The specific growth rate increased significantly in Experiment B when temperature in-creased from the ambient, while the highest growth rate was detected in the 5.1◦C treatment. At further temperature increase the specific growth rate declined (Fig. 1b). Growth rates were significantly different (Table 1), and all treatments were significantly separated according to the SNK test. The one factor ANOVA was performed with
het-10
erogeneous variances due to inability of transformation (Underwood, 1997).
3.5 Experimental conditions
Measured values of pHT andAT, with additional calculated parameters from CO2SYS for [HCO−3], [CO23−], [CO2] andpCO2after 14 days in Experiment A, are displayed in Ta-ble 3.ATincreased on average by 5.2 % and 7.7 % during the 14 days of experiment in
15
the−1.8◦C and 2.5◦C temperature treatments, respectively. When comparing samples and blanks (0.2 µm filtered seawater) at day 14, the algae contributed with 0.8 % and 2.6 % increase ofAT in the−1.8◦C and 2.5◦C temperature treatments, respectively.
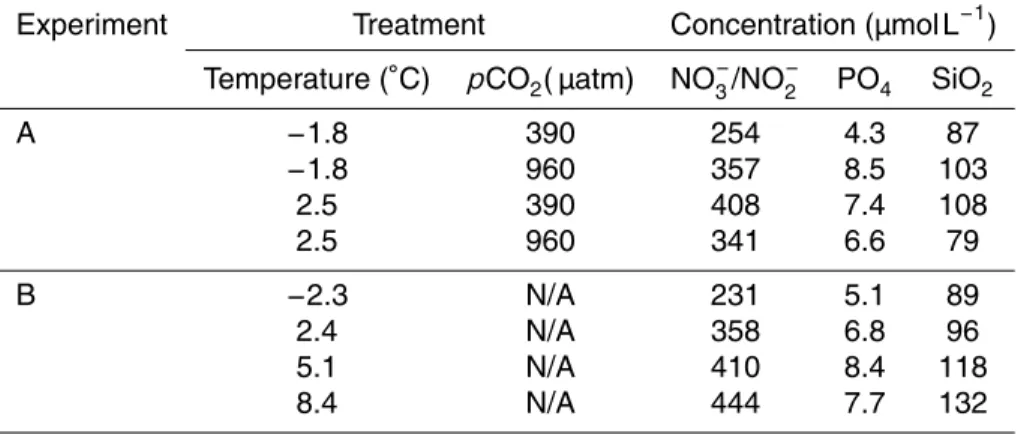
Inorganic nutrients were measured to rule out nutrient limitation. Results showed sat-isfying levels (Table 4), with steady values ofFv/Fm (Fig. 2) throughout the experiment
20
suggesting inorganic nutrients were not limiting growth.
BGD
10, 6637–6669, 2013Synergism between elevatedpCO2 and
temperature
A. Torstensson et al.
Title Page
Abstract Introduction
Conclusions References
Tables Figures
◭ ◮
◭ ◮
Back Close
Full Screen / Esc
Printer-friendly Version
Interactive Discussion
Discussion
P
a
per
|
Dis
cussion
P
a
per
|
Discussion
P
a
per
|
Discussio
n
P
a
per
|
4 Discussion
In this study, we report synergistic effects between temperature andpCO2 on growth and FA content of N. lecointei, suggesting complexity in physiological responses to climate change. In the control temperature, growth rate was unaffected bypCO2. How-ever, growth rate in the warmer treatment was promoted by elevated pCO2. Since
5
increasedpCO2in combination with warmer temperature stimulated growth, this inter-action suggests a physiological constraint in the lower temperature, makingN. lecoin-tei unable to utilize the extra carbon available to potentially increase growth rate. With a warmer temperature this constraint seemed to diminish and growth was no longer limited by temperature. The synergy between temperature and pCO2 may be
partic-10
ularly important in polar areas, where many physiological processes are limited by a narrow thermal window (e.g. P ¨ortner, 2002). Furthermore, these findings emphasize the importance of selecting a realistic temperature when designing perturbation ex-periments, which may be especially important in polar organisms where temperature regulates many physiological processes. Choosing a temperature close to the optimum
15
growth temperature, rather than at ambient conditions, might paradoxically both over-and underestimate the effect of carbon enrichment. Earlier studies suggest that ele-vated temperature within the temperature range of the species increases growth rate and photosynthesis in phytoplankton and ice algal species (Eppley, 1972; Montagnes and Franklin, 2001; Torstensson et al., 2012). However, not all observations are
con-20
sistent with the latter studies. Mock and Hoch (2005) did not detect a difference in maximum quantum yield after a 4 month long steady-state culturing of the polar
di-atom Fragilariopsis cylindrus in −1◦C and 7◦C. On the contrary, a decreasing trend
in the maximum quantum yield with increasing temperature was shown by Morris and Kromkamp (2003). However, the latter study was carried out with the benthic diatom
25
Cylindrotheca closteriumacclimated and grown at 20◦C, but treated with temperatures
BGD
10, 6637–6669, 2013Synergism between elevatedpCO2 and
temperature
A. Torstensson et al.
Title Page
Abstract Introduction
Conclusions References
Tables Figures
◭ ◮
◭ ◮
Back Close
Full Screen / Esc
Printer-friendly Version
Interactive Discussion
Discussion
P
a
per
|
Dis
cussion
P
a
per
|
Discussion
P
a
per
|
Discussio
n
P
a
per
|
Since growth was faster in the warmer treatment, the number of generations exceeded the numbers in the colder treatment. There is a possibility that more generations of
N. lecointei acclimated to high pCO2 in the high temperature treatment, hence the
promoted growth rate. Thus, long-term studies may be crucial for understanding accli-mation and adaptation to climate change.
5
Photosynthesis is just one process contributing to growth, meaning other temperature-sensitive processes may also regulate growth rates, e.g. nitrogen uptake and assimilation (Kuebler et al., 1991). If these processes are affected by ocean acidi-fication, the responses may be temperature dependent. SincepCO2did not affect the primary productivity,Fv/Fm or CA activity ofN. lecointei, it seems plausible that a
pro-10
cess other than photosynthesis was affected by the treatments in order to alter the growth of N. lecointei. However, primary productivity was measured as total primary productivity (PPPOC+PPDOC) in this study. Therefore, a treatment-dependent shift in the PPPOC: PPDOCratio could mask a possible shift in PPPOC. Engel et al. (2013) per-formed a study on natural phytoplankton communities in the Arctic fjord Kongsfjorden,
15
Svalbard, and during14C incubations of primary producers they observed an increase in PPDOCafter enrichment ofpCO2. Hence, overconsumption of carbon may increase the production and exudation of DOC and should be considered when interpreting our results. Another theory suggests that photosynthesis and growth have differences in acclimation potential when temperatures increase, e.g. photosynthetic activity has
20
a higher potential to be positively affected by elevated temperature than growth (Longhi et al., 2003). The primary productivity and growth ofN. lecointeiincreased with temper-ature in this study. Similar results have been reported in earlier studies, where carbon fixation increased in phytoplankton populations from the Bering Sea treated with ele-vated temperatures (Hare et al., 2007).
25
Further synergism was detected in the FA concentration ofN. lecointei. The cellular FA content in −1.8◦C was higher at ambient pCO
2 compared to the elevated pCO2
treatment. Rossoll et al. (2012) also reported higher total FA content and PUFA con-centration in Thalassiosira pseudonana grown at 380 µatm compared to 750 µatm,
BGD
10, 6637–6669, 2013Synergism between elevatedpCO2 and
temperature
A. Torstensson et al.
Title Page
Abstract Introduction
Conclusions References
Tables Figures
◭ ◮
◭ ◮
Back Close
Full Screen / Esc
Printer-friendly Version
Interactive Discussion
Discussion
P
a
per
|
Dis
cussion
P
a
per
|
Discussion
P
a
per
|
Discussio
n
P
a
per
|
which suggests that diatoms reduce their FA content in response to ocean acidifica-tion. This could have major consequences on the food quality transferred to higher trophic levels (Rossoll et al., 2012). However, we only observed a pCO2-related de-cline in FA concentration at−1.8◦C, suggesting that temperature in combination with pCO2plays an important role in FA stoichiometry. The total FA contents were reduced
5
by 65–76 % in the higher temperature compared to the colder temperature. Hence, the effect of elevated temperature onN. lecointei FA content is also of great importance. Temperature has previously been well documented to impact on the cellular lipid con-tent of phytoplankton from the Southern Ocean. Smith and Morris (1980) observed that up to 80 % of assimilated carbon during14C incubations was incorporated in lipids
10
when incubated in temperatures below 0◦C. At incubations above 0◦C the incorpo-ration into lipids was less than 20 %. In addition, Smith and Morris (1980) suggested low light stress to enhance the effect of stored lipids as response to low temperature. Increased lipid content due to environmental stressors, such as nutrient deficiency, low light and low temperature, is suggested to be a characteristic response for polar
phy-15
toplankton populations (Smith and Morris, 1980). Deficiency of nitrogen is well known to elevate cellular lipid content in diatoms in order to accumulate FAs when conditions are unfavorable (Parrish and Wangersky, 1987). Hence, inorganic nutrient levels are of importance to cellular FA content, i.e. the storage of FAs and lipids is built up when access is reduced. However, no signs of nutrient deficiency were detected in this study,
20
e.g. inorganic nutrient concentrations andFv/Fm. These findings suggest a major reduc-tion ofN. lecointei FA content in response to climate change, highlighting the synergy between environmental changes.
Sea ice algae are known to contain high amounts of FA and are an important food source for grazers in polar areas, especially prior to the pelagic spring bloom.
There-25
BGD
10, 6637–6669, 2013Synergism between elevatedpCO2 and
temperature
A. Torstensson et al.
Title Page
Abstract Introduction
Conclusions References
Tables Figures
◭ ◮
◭ ◮
Back Close
Full Screen / Esc
Printer-friendly Version
Interactive Discussion
Discussion
P
a
per
|
Dis
cussion
P
a
per
|
Discussion
P
a
per
|
Discussio
n
P
a
per
|
Studies of FA composition in cultures and natural algal communities sampled from wa-ter, sea ice, platelet ice, interstitial water and under ice water in polar oceans have shown PUFA concentrations of approximately 20–60 % (Fahl and Kattner, 1993; Falk-Petersen et al., 1998; Teoh et al., 2004; Leu et al., 2006). However, PUFA in N.
lec-tonei represented 94.1–98.5 % of the lipids in the control temperature, reflecting the
5
importance of PUFA as a cold adaption. Significantly lower PUFA concentrations were measured in the warmer treatment; 81.5 % at ambient carbon level and 84.5 % at el-evated pCO2. These results are consistent with previous knowledge about FAs and adaption to a warmer environment (Teoh et al., 2004). Furthermore, the level of car-bon dioxide also appears to alter FA content under certain temperature conditions in
10
N. lecointei. In a previous study, Rossoll et al. (2012) showed a decrease in PUFA
concentration, at the expense of increasing SAFA, as a result of elevated carbon lev-els. The authors also observed a decline in total FA content at highpCO2. The results from the latter and present studies are somewhat consistent, i.e. cellular FA and PUFA content decreases due to elevated carbon levels. However, no alteration of SAFA and
15
MUFA content was detected inN. lecointei, and the response ofpCO2appeared tem-perature dependent. Thus, carbon level only affects total FA content ofN. lecointei at low temperature, while an increased pCO2 leads to deterioration of FA content. The PUFA present in the samples were mainly omega-3 PUFA, however in three out of four treatments a small fraction (<2 %) of non-omega-3 PUFA, 18 : 2n-6 (linoleic acid), was
20
found as well. Decreasing PUFA content, mainly omega-3 PUFAs, is consistent with earlier studies. Zhang et al. (2011) showed a relationship between decreasing temper-ature and increasing activity of an omega-3 FA desaturase, suggesting a correlation between desaturase activity and the decrease of 18 : 2 PUFA and the increase of 18 : 3 PUFA. The study was performed on a strain of the green algaChlamydomonassp.
iso-25
lated from Antarctic sea ice. In addition, Mayzaud et al. (2013) also demonstrated that increasing temperatures decreased the amount of omega-3 PUFA in natural blooming phytoplankton in the Arctic fjord Kongsfjorden, Spitsbergen, Svalbard. Alteration of cel-lular FA content may not only affect the primary producers. A loss of PUFA results in
BGD
10, 6637–6669, 2013Synergism between elevatedpCO2 and
temperature
A. Torstensson et al.
Title Page
Abstract Introduction
Conclusions References
Tables Figures
◭ ◮
◭ ◮
Back Close
Full Screen / Esc
Printer-friendly Version
Interactive Discussion
Discussion
P
a
per
|
Dis
cussion
P
a
per
|
Discussion
P
a
per
|
Discussio
n
P
a
per
|
altered food quality for organisms grazing on primary producers. Rossoll et al. (2012) showed a major decrease in somatic growth and egg production in grazing copepods
(Acartia tonsa), as a response to deteriorated food quality, i.e. reduced total FA and
PUFA : SAFA, fromT. pseudonanagrown at increased pCO2. This type of event may have significant effects throughout the food web. It is suggested that poor food
qual-5
ity in copepods and amphipods is negatively correlated with breeding performance in marine bird species in polar areas. Studies from the Arctic show changed foraging pat-terns, with Little Auks (Alle alle) taking longer trips, due to a lack of energy-rich prey near breeding sites, resulting in decreased reproductive (Steen et al., 2007). In ad-dition, an alteration in the FA content at subzero temperatures could also affect the
10
ability ofN. lecointeito tolerate low temperature stress, e.g. during freezing. Hence, an alteration in FA composition in the foundation of the food web may have severe conse-quences at higher trophic levels. However, few ocean acidification studies have so far focused on trophic transfer in the ecosystem.
This study demonstrates that N. lecointei is clearly favored by higher temperatures
15
compared to ambient levels. According to Experiment B, optimal growth temperature
forN. lecointeiwas around 5◦C. It has previously been suggested that maximal growth
rate occurs at temperatures above in situ levels (Fiala and Oriol, 1990; Longhi et al., 2003), which indicates that a narrow thermal window generally limits Antarctic algae. This suggests that carbon enrichment might not be beneficial at ambient conditions
20
since temperature primarily regulates growth. However, ambient temperatures may be-come closer to the peak of the thermal window during an ocean warming event and promote the effect of carbon enrichment. Temperature is essential to enzyme activity and metabolic processes where the speed of reactions increases with increasing tem-perature. Results from this study indicate thatN. lecointei is more efficient in utilizing
25
available resources at higher temperatures (5.1◦C), which is within reasonable limits of what could be expected considering reaction speed. At 8.4◦C, specific growth rate was still 17 % higher than at−1.8◦C. However, psychrophilic sea ice algae likeN. lecointei
BGD
10, 6637–6669, 2013Synergism between elevatedpCO2 and
temperature
A. Torstensson et al.
Title Page
Abstract Introduction
Conclusions References
Tables Figures
◭ ◮
◭ ◮
Back Close
Full Screen / Esc
Printer-friendly Version
Interactive Discussion
Discussion
P
a
per
|
Dis
cussion
P
a
per
|
Discussion
P
a
per
|
Discussio
n
P
a
per
|
The primary productivity andFv/Fm ofN. lecointei increased with elevated tempera-ture in Experiment A. Kennedy et al. (2012) described the relationship between tem-perature and photosynthesis within sea ice. This was performed by measuringFv/Fm
in the haptophytePhaeocystis antarcticadistributed at different depths in the ice, while excluding the factor of salinity. The highest level was observed in the warmest part of
5
the ice, around−2◦C, close to the ice/water interface, while the lowest level was
mea-sured in the coldest part, around −6◦C, at the top of the ice (Kennedy et al., 2012).
In addition, Ralph et al. (2005) studied brine channel communities dominated by di-atoms and showed similar results, i.e. the photosynthetic performance was higher at
−1.8◦C than at−10◦C. Hence, the pattern with warmer temperature and higher
pho-10
tosynthetic performance, which is also shown forN. lecointeiin this study, continues in temperatures below−1.8◦C.
The possible down-regulation of CCMs due to elevatedpCO2 has previously been discussed elsewhere. Raven (1991) suggested that phytoplankton using CCMs would favour from elevated pCO2, since costs for carbon fixation seemed to be lower with
15
elevated growth and photosynthesis as a result. Contrary to Raven (1991), Hopkson et al. (2011) suggested energy savings from down-regulation of CCMs would in-crease carbon fixation, when sufficient levels of carbon are achieved without the use of energy-consuming CCMs. However, the responses tend to be very taxa specific. It has been reported that the photosynthetic performance of the Antarctic diatom
Chaeto-20
ceros brevisremains unaffected at both a reduction by half and a doubling of present
daypCO2(Boelen et al., 2011). Yang and Gao (2012) reported that the growth rate of
T. pseudonana was unaffected, even though CCMs were down-regulated and
photo-synthesis up-regulated when treated withpCO2 of 1000 µatm. The authors explained this observation by an increased rate of mitochondrial respiration and loss of carbon,
25
corresponding to the enhanced carbon fixation. However, down-regulation of CCMs has more recently been suggested to occur at highpCO2(Wu et al., 2008; Hopkinson et al., 2011). In this study, a mean reduction of CA activity was observed in 15 mea-surable samples inhibited with AZ during the14C incubation. The inhibition was of the
BGD
10, 6637–6669, 2013Synergism between elevatedpCO2 and
temperature
A. Torstensson et al.
Title Page
Abstract Introduction
Conclusions References
Tables Figures
◭ ◮
◭ ◮
Back Close
Full Screen / Esc
Printer-friendly Version
Interactive Discussion
Discussion
P
a
per
|
Dis
cussion
P
a
per
|
Discussion
P
a
per
|
Discussio
n
P
a
per
|
same magnitude in all treatments, suggesting thatN. lecointei has the same require-ment of carbon regardless of treatrequire-ment level, i.e.N. lecointeimay already be saturated in carbon at the ambientpCO2. Nevertheless, this shows that CA as a CCM is present
inN. lecointei and that it provides for at least 12 % of the carbon assimilation, which is
a substantial part of the total carbon uptake. However, since inhibition of CA is species
5
specific and depending on concentration of inhibitor (Morant-Manceau et al., 2007), 12 % might be an underestimation.
Sea ice algae play an important role as a food source for grazers in the early season and as seedling populations to the spring bloom. An elevated SST would change the distribution of sea ice and could result in an ice free summer, as is predicted for the
10
Arctic within the next 30 yr (Wang and Overland, 2009). This might affect organisms dependent on sea ice algae more than the first year ice inhabiting algae itself, since the algae nevertheless end up in the water column during the melting season. However, the sea ice would also become warmer in general during the season, resulting in more porous sea ice with less saline brine. In addition, levels of dissolved carbon dioxide
15
within sea ice during formation would theoretically increase, similar to the increasing salinity of the brine in the non-frozen matrix within the ice. However during spring and summer, measured levels of fCO2 were below ambient atmospheric level (Fransson et al., 2011), indicating that increased levels of dissolved carbon dioxide in brine are not as elevated as they may be during formation. This suggests that the temporal
vari-20
ation of pCO2 in brine is quite high compared to the surrounding seawater (Geilfus et al., 2012). Hence, the pCO2 treatments in this study are still considered relevant to condition in the ice when the sea ice algae are starting to bloom. However, natural variability ofpCO2will be important to consider, especially when modelling the results from ocean acidification experiments.
25
BGD
10, 6637–6669, 2013Synergism between elevatedpCO2 and
temperature
A. Torstensson et al.
Title Page
Abstract Introduction
Conclusions References
Tables Figures
◭ ◮
◭ ◮
Back Close
Full Screen / Esc
Printer-friendly Version
Interactive Discussion
Discussion
P
a
per
|
Dis
cussion
P
a
per
|
Discussion
P
a
per
|
Discussio
n
P
a
per
|
pCO2 may be more pronounced closer to the optimal temperature of the species, al-though this temperature is generally higher than ambient conditions. However, the gap between optimal and ambient SST will probably be reduced during a future ocean warming event and may be important to consider when assessing results from ocean acidification perturbation experiments.
5
Acknowledgements. This study was financed by the Swedish Research Council (VR Project #2007-8365) and Lindhes Advokatbyr ˚a AB foundation. We would like to thank A. Al-Handal for species identification.
References
Aertebjerg, G. and Bresta, A. M.: Guidelines for the Measurement of Phytoplankton Primary
10
Production, 2nd edn., Baltic Marine Biologists Publication No. 1., 1984.
Andersson, M. X., Kourtchenko, O., Dangl, J. L., Mackey, D., and Ellerstr ¨om, M.: Phospholipase-dependent signalling during the AvrRpm1- and AvrRpt2-induced disease resistance re-sponses inArabidopsis thaliana, Plant J., 47, 947–959, 2006.
Boelen, P., van de Poll, W. H., van der Strate, H. J., Neven, I. A., Beardall, J., and Buma, A. G. J.:
15
Neither elevated nor reduced CO2affects the photophysiological performance of the marine
Antarctic diatomChaetoceros brevis, J. Exp. Mar. Biol. Ecol., 406, 38–45, 2011.
Burkhardt, S., Amoroso, G., Riebesell, U., and S ¨ultemeyer, D.: CO2 and HCO−3 uptake in
ma-rine diatoms acclimated to different CO2concentrations, Limnol. Oceanogr., 46, 1378–1391,
2001.
20
Christie, W. W.: Lipid Analysis: Isolation, Separation, Identification and Structural Analysis of Lipids, Pergamon Press, Oxford, 1976.
Clayton, T. D. and Byrne, R. H.: Spectrophotometric seawater pH measurements: total hydro-gen ion concentration scale calibration ofm-cresol purple and at-sea results, Deep Sea Res. Pt. I, 40, 2115–2129, 1993.
25
Comeau, S., Gorsky, G., Jeffree, R., Teyssi ´e, J.-L., and Gattuso, J.-P.: Impact of ocean acidi-fication on a key Arctic pelagic mollusc (Limacina helicina), Biogeosciences, 6, 1877–1882, doi:10.5194/bg-6-1877-2009, 2009.
BGD
10, 6637–6669, 2013Synergism between elevatedpCO2 and
temperature
A. Torstensson et al.
Title Page
Abstract Introduction
Conclusions References
Tables Figures
◭ ◮
◭ ◮
Back Close
Full Screen / Esc
Printer-friendly Version
Interactive Discussion
Discussion
P
a
per
|
Dis
cussion
P
a
per
|
Discussion
P
a
per
|
Discussio
n
P
a
per
|
Dickson, A. G.: Standard potential of the reaction: AgCl(s)+OH2(g)=Ag(s)+HCl(aq), and the
standard acidity constant of the ion HSO4 in synthetic seawater from 273.15 to 318.15 K, J.
Chem. Thermodyn., 22, 113–127, 1990.
Dickson, A. G. and Millero, F. J.: A comparison of the equilibrium constants for the dissociation of carbonic acid in seawater media, Deep Sea Res. Pt. I, 34, 1733–1743, 1987.
5
Engel, A., Borchard, C., Piontek, J., Schulz, K. G., Riebesell, U., and Bellerby, R.: CO2
in-creases14C primary production in an Arctic plankton community, Biogeosciences, 10, 1291– 1308, doi:10.5194/bg-10-1291-2013, 2013.
Eppley, R. W.: Temperature and phytoplankton growth in the sea, Fish. Bull., 70, 1063–1085, 1972.
10
Fahl, K. and Kattner, G.: Lipid Content and fatty acid composition of algal communities in sea-ice and water from the Weddell Sea (Antarctica), Polar Biol., 13, 405–409, 1993.
Falk-Petersen, S., Sargent, J. R., Henderson, J., Hegseth, E. N., Hop, H., and Okolodkov, Y. B.: Lipids and fatty acids in ice algae and phytoplankton from the marginal ice zone in the Bar-ents Sea, Polar Biol., 20, 41–47, 1998.
15
Fiala, M. and Oriol, L.: Light-temperature interactions on the growth of Antarctic diatoms, Polar Biol., 10, 629–636, 1990.
Fransson, A., Chierici, M., Yager, P. L., and Smith, W. O.: Antarctic sea ice carbon dioxide system and controls, J. Geophys. Res.-Oceans, 116, C12035, doi:10.1029/2010JC006844, 2011.
20
Geilfus, N. X., Carnat, G., Papakyriakou, T., Tison, J. L., Else, B., Thomas, H., Shad-wick, E., and Delille, B.: Dynamics of pCO2 and related air-ice CO2 fluxes in the Arctic
coastal zone (Amundsen Gulf, Beaufort Sea), J. Geophys. Res.-Oceans, 117, C00G10 , doi:10.1029/2011JC007118, 2012.
Grasshoff, K., Kremling, K., and Ehrhardt, M.: Methods of Seawater Analysis, 3rd edn.,
Wiley-25
VHC, Weinheim, 1999.
Guillard, R. R. L.: Culture of phytoplankton for feeding marine invertebrates, in: Culture of Ma-rine Invertebrate Animals, edited by: Smith, W. L. and Chanley, M. H., Plenum, New York, 29–60, 1975.
Haraldsson, C., Anderson, L. G., Hassell ¨ov, M., Hulth, S., and Olsson, K.: Rapid, high-precision
30
BGD
10, 6637–6669, 2013Synergism between elevatedpCO2 and
temperature
A. Torstensson et al.
Title Page
Abstract Introduction
Conclusions References
Tables Figures
◭ ◮
◭ ◮
Back Close
Full Screen / Esc
Printer-friendly Version
Interactive Discussion
Discussion
P
a
per
|
Dis
cussion
P
a
per
|
Discussion
P
a
per
|
Discussio
n
P
a
per
|
Hare, C. E., Leblanc, K., DiTullio, G. R., Kudela, R. M., Zhang, Y., Lee, P. A., Riseman, S., and Hutchins, D. A.: Consequences of increased temperature and CO2 for phytoplankton
community structure in the Bering Sea, Mar. Ecol. Prog. Ser., 352, 9–16, 2007.
Hazel, J. R.: Thermal adaptation in biological membranes: is homeoviscous adaptation the explanation?, Annu. Rev. Physiol., 57, 19–42, 1995.
5
Hoegh-Guldberg, O. and Bruno, J. F.: The impact of climate change on the world’s marine ecosystems, Science, 328, 1523–1528, 2010.
Hopkinson, B. M., Dupont, C. L., Allen, A. E., and Morel, F. M. M.: Efficiency of the CO2
-concentrating mechanism of diatoms, Proc. Natl. Acad. Sci., 108, 3830–3837, 2011.
IPCC: Climate Change 2007: The Physical Science Basis, in: 4th Assessment Report, edited
10
by: Solomon, S., Qin, D., Manning, M., Chen, Z., Marquis, M., Averyt, K. B., M., and Miller, H. L., Cambridge University Press, Cambridge, 789–797, 2007.
Kennedy, F., McMinn, A., and Martin, A.: Effect of temperature on the photosynthetic efficiency and morphotype ofPhaeocystis antarctica, J. Exp. Mar. Biol. Ecol., 429, 7–14, 2012. Kuebler, J. E., Davison, I. R., and Yarish, C.: Photosynthetic adaptation to temperature in the
15
red algaeLomentaria baileyanaandLomentaria orcadensis, Eur. J. Phycol., 26, 9–19, 1991. Leu, E., W ¨angberg, S.- ˚A., Wulff, A., Falk-Petersen, S., Ørbæk, J. B., and Hessen, D. O.: Effects
of changes in ambient PAR and UV radiation on the nutritional quality of an Arctic diatom (Thalassiosira antarcticavar.borealis), J. Exp. Mar. Biol. Ecol., 337, 65–81, 2006.
Lizotte, M. P.: The contributions of sea ice algae to Antarctic marine primary production, Am.
20
Zool., 41, 57–73, 2001.
Longhi, M. L., Schloss, I. R., and Wiencke, C.: Effect of irradiance and temperature on photo-synthesis and growth of two Antarctic benthic diatoms,Gyrosigma subsalinumandOdontella litigiosa, Bot. Mar., 46, 276–284, 2003.
Mayzaud, P., Boutoute, M., Noyon, M., Narcy, F., and Gasparini, S.: Lipid and fatty acids in
25
naturally occurring particulate matter during spring and summer in a high arctic fjord (Kongs-fjorden, Svalbard), Mar. Biol., 160, 383–398, 2013.
Mehrbach, C., Culberson, C. H., Hawley, J. E., and Pytkowicz, R. M.: Measurement of the ap-parent dissociation constants of carbonic acid in seawater at atmospheric pressure, Limnol. Oceanogr., 18, 897–907, 1973.
30
Mock, T. and Hoch, N.: Long-term temperature acclimation of photosynthesis in steady-state cultures of the polar diatomFragilariopsis cylindrus, Photosynth. Res., 85, 307–317, 2005.
BGD
10, 6637–6669, 2013Synergism between elevatedpCO2 and
temperature
A. Torstensson et al.
Title Page
Abstract Introduction
Conclusions References
Tables Figures
◭ ◮
◭ ◮
Back Close
Full Screen / Esc
Printer-friendly Version
Interactive Discussion
Discussion
P
a
per
|
Dis
cussion
P
a
per
|
Discussion
P
a
per
|
Discussio
n
P
a
per
|
Montagnes, D. J. S. and Franklin, D. J.: Effect of temperature on diatom volume, growth rate, and carbon and nitrogen content: reconsidering some paradigms, Limnol. Oceanogr., 46, 2008–2018, 2001.
Morant-Manceau, A., Nguyen, T. L. N., Pradier, E., and Tremblin, G.: Carbonic anhydrase ac-tivity and photosynthesis in marine diatoms, Eur. J. Phycol., 42, 263–270, 2007.
5
Morris, E. P. and Kromkamp, J. C.: Influence of temperature on the relationship between oxygen- and fluorescence-based estimates of photosynthetic parameters in a marine benthic diatom (Cylindrotheca closterium), Eur. J. Phycol., 38, 133–142, 2003.
Orr, J. C., Fabry, V. J., Aumont, O., Bopp, L., Doney, S. C., Feely, R. A., Gnanadesikan, A., Gru-ber, N., Ishida, A., Joos, F., Key, R. M., Lindsay, K., Maier-Reimer, E., Matear, R., Monfray, P.,
10
Mouchet, A., Najjar, R. G., Plattner, G.-K., Rodgers, K. B., Sabine, C. L., Sarmiento, J. L., Schlitzer, R., Slater, R. D., Totterdell, I. J., Weirig, M.-F., Yamanaka, Y., and Yool, A.: Anthro-pogenic ocean acidification over the twenty-first century and its impact on calcifying organ-isms, Nature, 437, 681–686, 2005.
Parrish, C. C. and Wangersky, P. J.: Particulate and dissolved lipid classes in cultures of
Phaeo-15
dactylum tricornutumgrown in cage culture turbidostats with a rage of nitrogen supply rates, Mar. Ecol. Prog. Ser., 35, 119–128, 1987.
Pierrot, D., Lewis, E., and Wallace, D. W. R.: MS Excel Program Developed for CO2System
Calculations ORNL/CDIAC-105a, in: Carbon Dioxide Information Analysis Center, Oak Ridge National Laboratory, US Department of Energy, Oak Ridge, Tennessee, 2006.
20
P ¨ortner, H. O.: Physiological basis of temperature-dependent biogeography: trade-offs in mus-cle design and performance in polar ectotherms, J. Exp. Biol., 205, 2217–2230, 2002. Ralph, P. J., McMinn, A., Ryan, K. G., and Ashworth, C.: Short-term effect on temperature on
the photokinetics of microalgae from the surface layers of Antarctic pack ice, J. Phycol., 41, 763–769, 2005.
25
Raven, J. A.: Physiology of inorganic C acquisition and implications for resource use efficiency by marine phytoplankton: relation to increased CO2and temperature, Plant Cell Environ., 14,
779–794, 1991.
Reinfelder, J. R.: Carbon concentrating mechanisms in eukaryotic marine phytoplankton, Annu. Rev. Marine Sci., 3, 291–315, 2011.
30
BGD
10, 6637–6669, 2013Synergism between elevatedpCO2 and
temperature
A. Torstensson et al.
Title Page
Abstract Introduction
Conclusions References
Tables Figures
◭ ◮
◭ ◮
Back Close
Full Screen / Esc
Printer-friendly Version
Interactive Discussion
Discussion
P
a
per
|
Dis
cussion
P
a
per
|
Discussion
P
a
per
|
Discussio
n
P
a
per
|
Rossoll, D., Bermu`ıdez, R., Hauss, H., Schulz, K. G., Riebesell, U., Sommer, U., and Winder, M.: Ocean acidification-induced food quality deterioration constrains trophic transfer, PLoS ONE, 7, e34737, doi:10.1371/journal.pone.0034737, 2012.
Schoo, K., Malzahn, A., Krause, E., and Boersma, M.: Increased carbon dioxide availability alters phytoplankton stoichiometry and affects carbon cycling and growth of a marine
plank-5
tonic herbivore, Mar. Biol., 1–11, doi:10.1007/s00227-012-2121-4, 2012.
Smith, A. E. and Morris, I.: Pathways of carbon assimilation in phytoplankton from the Antarctic Ocean, Limnol. Oceanogr., 25, 865–872, 1980.
Somero, G. N.: The physiology of global change: linking patterns to mechanisms, Annu. Rev. Marine Sci., 4, 39–61, 2012.
10
Steen, H., Vogedes, D., Broms, F., Falk-Petersen, S., and Berge, J.: Little auks (Alle alle) breed-ing in a High Arctic fjord system: bimodal foragbreed-ing strategies as a response to poor food quality?, Polar Res., 26, 118–125, 2007.
Teoh, M.-L., Chu, W.-L., Marchant, H., and Phang, S.-M.: Influence of culture temperature on the growth, biochemical composition and fatty acid profiles of six Antarctic microalgae, J.
15
Appl. Phycol., 16, 421–430, 2004.
Torstensson, A., Chierici, M., and Wulff, A.: The influence of increased temperature and carbon dioxide levels on the benthic/sea ice diatomNavicula directa, Polar Biol., 35, 205–214, 2012. Underwood, A. J.: Experiments in Ecology, Cambridge University Press, Cambridge, 1997. Wang, M. and Overland, J. E.: A sea ice free summer Arctic within 30 years?, Geophys. Res.
20
Lett., 36, L07502, doi:10.1029/2009GL037820, 2009.
Wu, H., Zou, D., and Gao, K.: Impacts of increased atmospheric CO2concentration on
photo-synthesis and growth of micro- and macro-algae, Sci. China Ser. C-Life Sci., 51, 1144–1150, 2008.
Yang, G. and Gao, K.: Physiological responses of the marine diatomThalassiosira pseudonana
25
to increasedpCO2and seawater acidity, Mar. Environ. Res., 79, 142–151, 2012.
Zhang, P., Liu, S., Cong, B., Wu, G., Liu, C., Lin, X., Shen, J., and Huang, X.: A novel omega-3 fatty acid desaturase involved in acclimation processes of polar, Mar. Biotechnol., 13, 393– 401, 2011.
BGD
10, 6637–6669, 2013Synergism between elevatedpCO2 and
temperature
A. Torstensson et al.
Title Page
Abstract Introduction
Conclusions References
Tables Figures
◭ ◮
◭ ◮
Back Close
Full Screen / Esc
Printer-friendly Version
Interactive Discussion
Discussion
P
a
per
|
Dis
cussion
P
a
per
|
Discussion
P
a
per
|
Discussio
n
P
a
per
|
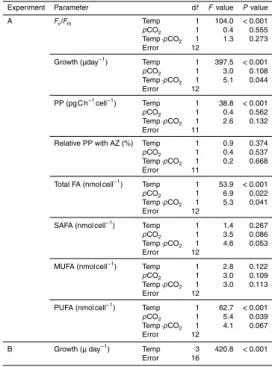
Table 1.Results from statistical analyses after 14 days in Experiment A and B, using one and
two factor ANOVA. Analysed parameters are maximum quantum yield (Fv/Fm), specific growth rate (Growth), primary productivity (PP), relative primary productivity with inhibitor Acetazo-lamide (AZ), total fatty acids (FA), saturated fatty acids (SAFA), monounsaturated fatty acids (MUFA) and polyunsaturated fatty acids (PUFA).
Experiment Parameter df Fvalue Pvalue A Fv/Fm Temp 1 104.0 <0.001 pCO2 1 0.4 0.555
Temp·pCO2 1 1.3 0.273
Error 12
Growth (µday−1) Temp 1 397.5 <0.001 pCO2 1 3.0 0.108
Temp·pCO2 1 5.1 0.044
Error 12
PP (pg C h−1cell−1) Temp 1 38.8 <0.001 pCO2 1 0.4 0.562
Temp·pCO2 1 2.6 0.132
Error 11
Relative PP with AZ (%) Temp 1 0.9 0.374 pCO2 1 0.4 0.537
Temp·pCO2 1 0.2 0.668
Error 11 Total FA (nmol cell−1) Temp 1 53.9
<0.001 pCO2 1 6.9 0.022
Temp·pCO2 1 5.3 0.041
Error 12 SAFA (nmol cell−1
) Temp 1 1.4 0.267 pCO2 1 3.5 0.086
Temp·pCO2 1 4.6 0.053
Error 12
MUFA (nmol cell−1) Temp 1 2.8 0.122 pCO2 1 3.0 0.109
Temp·pCO2 1 3.0 0.113
Error 12
PUFA (nmol cell−1) Temp 1 62.7 <0.001 pCO2 1 5.4 0.039
Temp·pCO2 1 4.1 0.067
Error 12
B Growth (µ day−1) Temp 3 420.8 <0.001
![Table 3. Measured and calculated in situ mean values of pH T , A T , [HCO − 3 ], [CO 2− 3 ], [CO 2 ] and pCO 2](https://thumb-eu.123doks.com/thumbv2/123dok_br/16452084.197601/27.918.62.642.259.460/table-measured-calculated-situ-mean-values-hco-pco.webp)