www.biogeosciences.net/13/2339/2016/ doi:10.5194/bg-13-2339-2016
© Author(s) 2016. CC Attribution 3.0 License.
Interannual variability of the atmospheric CO
2
growth rate:
roles of precipitation and temperature
Jun Wang1,2, Ning Zeng2,3, and Meirong Wang4
1International Institute for Earth System Science, Nanjing University, Nanjing, China 2Institute of Atmospheric Physics, Chinese Academy of Sciences, Beijing, China
3Department of Atmospheric and Oceanic Science and Earth System Science Interdisciplinary Center,
University of Maryland, College Park, Maryland, USA
4Nanjing University of Information Science & Technology, Nanjing, China
Correspondence to:Jun Wang ([email protected])
Received: 10 September 2015 – Published in Biogeosciences Discuss.: 3 December 2015 Revised: 8 March 2016 – Accepted: 4 April 2016 – Published: 21 April 2016
Abstract. The interannual variability (IAV) in atmospheric
CO2 growth rate (CGR) is closely connected with the El
Niño–Southern Oscillation. However, sensitivities of CGR to temperature and precipitation remain largely uncertain. This paper analyzed the relationship between Mauna Loa CGR and tropical land climatic elements. We find that Mauna Loa CGR lags precipitation by 4 months with a correlation coef-ficient of −0.63, leads temperature by 1 month (0.77), and correlates with soil moisture (−0.65) with zero lag. Addi-tionally, precipitation and temperature are highly correlated (−0.66), with precipitation leading by 4–5 months. Regres-sion analysis shows that sensitivities of Mauna Loa CGR to temperature and precipitation are 2.92±0.20 PgC yr−1K−1 and−0.46±0.07 PgC yr−1100 mm−1, respectively. Unlike some recent suggestions, these empirical relationships favor neither temperature nor precipitation as the dominant factor of CGR IAV. We further analyzed seven terrestrial carbon cycle models, from the TRENDY project, to study the pro-cesses underlying CGR IAV. All models capture well the IAV of tropical land–atmosphere carbon flux (CFTA). Sensitivities
of the ensemble mean CFTAto temperature and precipitation
are 3.18±0.11 PgC yr−1K−1 and −0.67±0.04 PgC yr−1 100 mm−1, close to Mauna Loa CGR. Importantly, the mod-els consistently show the variability in net primary produc-tivity (NPP) dominates CGR, rather than heterotrophic res-piration. Because previous studies have proved that NPP is largely driven by precipitation in tropics, it suggests a key role of precipitation in CGR IAV despite the higher CGR correlation with temperature. Understanding the relative
con-tribution of CO2sensitivity to precipitation and temperature
has important implications for future carbon-climate feed-back using such “emergent constraint”.
1 Introduction
Increasing atmospheric carbon dioxide (CO2) concentration,
from anthropogenic emissions, is the major contributing fac-tor to global warming. This trend can be seen from the long-term CO2records from the Mauna Loa Observatory, Hawaii,
with a significant seasonal cycle and interannual variability (IAV) superimposed (Keeling et al., 1976, 1995). The IAV of the atmospheric CO2growth rate (CGR) is closely connected
to the El Niño–Southern Oscillation (ENSO), with notice-able increases during El Niño, and decreases during La Niña events (Bacastow, 1976; Keeling and Revelle, 1985).
The IAV of the atmospheric CGR is the consequence of climate-induced variations in oceanic and terrestrial carbon sources and sinks. Earlier studies have considered the CO2
flux changes over the oceans, especially the equatorial Pacific Ocean, as the cause of the atmospheric CO2IAV (Bacastow,
CGR (Braswell et al., 1997; Bousquet et al., 2000; Zeng et al., 2005a; Qian et al., 2008). Recently, using the combi-nation of land surface models and the satellite-based land cover map, Ahlstrom et al. (2015) pointed out that semi-arid ecosystems, largely occupying low latitudes, dominated the terrestrial carbon interannual variability.
The influence of the ENSO on terrestrial carbon IAV can be largely explained by a “conspiracy” between tropical cli-matic variations (a tropical-wide drought and warming dur-ing El Niño) and the responses of soil and plant physiology (Kinderman et al., 1996; Tian et al., 1998; Knorr et al., 2005; Patra et al., 2005a; Zeng et al., 2005a), as well as some abi-otic processes such as fires (van der Werf et al., 2004). How-ever, the processes and strengths of the responses in such terrestrial biotic and abiotic functions remain controversial. Temperature, an important physical variable affecting photo-synthesis and respiration, is regarded as the dominant fac-tor on the basis of the significant correlation with Mauna Loa CGR anomalies and in situ observations on tropical tree growth, as well as confirmation by terrestrial carbon cycle models (Kindermann et al., 1996; Braswell et al., 1997; Clark et al., 2003; Cox et al., 2013; Piao et al., 2013; W. Wang et al., 2013; X. Wang et al., 2014). Warming anomalies above a certain threshold can result in a decrease in the terres-trial primary productivity, in part due to the curtailment of the leaf gas exchange (Doughty and Goulden, 2008; Cor-lett, 2011). Simultaneously, the heterotrophic respiration,Rh,
caused by microbial decomposition, increases exponentially with warming temperature (Q10). These direct biological
re-sponses to warming temperature variations account for the significant positive correlation between the tropical tempera-ture and CGR (W. Wang et al., 2013; X. Wang et al., 2014). Moreover, further analyses have suggested a two-fold in-crease in the sensitivity of CGR to the tropical temperature variations in the past 5 decades (X. Wang et al., 2014).
Variation in precipitation over land was proposed as an al-ternative dominant factor affecting the IAV of the CGR by process-based biogeochemical models of terrestrial ecosys-tems (Tian et al., 1998; Zeng et al., 2005a; Qian et al., 2008). In order to quantify the individual effects of the ENSO-induced climatic variations, Qian et al. (2008) conducted a series of the sensitivity experiments using a dynamic global vegetation and terrestrial carbon model (VEGAS). They re-vealed that the contributions from the tropical precipitation and temperature accounted for 56 and 44 % of variations in air–land carbon fluxes during the ENSO events, respectively. In situ records from multiple long-term monitoring plots in the Amazon rainforest have been used to assess the severe drought in 2005, which caused a total biomass carbon loss of 1.2–1.6 Pg (petagrams) (Phillips et al., 2009). Ahlstrom et al. (2015) also found that precipitation and NBP IAV became more correlated with increasing spatial and temporal disag-gregation.
These differing viewpoints indicate the current limited understanding of biological processes’ response to ENSO.
These interannual sensitivities may be important for under-standing the strengths of the positive carbon–climate feed-back and climate sensitivities of the terrestrial carbon cycle in future climate change (Cox et al., 2000, 2013; Wang et al., 2014; Wenzel et al., 2014). Therefore, in this paper, we again investigate the relationships between Mauna Loa CGR and the tropical climatic variations, based on the up-to-date ob-servations. The tropical climatic parameters are the follow-ing: temperature, precipitation, soil moisture, and photosyn-thetically active radiation (PAR). The performance of IAVs in the tropical terrestrial carbon cycle was simulated by seven state-of-the-art terrestrial carbon cycle models with monthly outputs, from the TRENDY project (Trends in Net Land At-mosphere Carbon Exchanges) (Canadell et al., 2011; Sitch et al., 2015). These mechanistic models are used to delineate the processes underlying the IAVs in CGR, and determine how strong their sensitivities to temperature and precipita-tion are. In return, these results also give out the evaluaprecipita-tions on the 7 terrestrial carbon cycle models on the interannual timescale, which are important for improving them in their development communities.
The paper is organized as follows: Section 2 describes the data sets, methodologies, and terrestrial carbon cycle models that are used. Section 3 presents related results covering three aspects: first, the observed relationships between Mauna Loa CGR and climatic variations; second, the performance and consistencies among the terrestrial carbon cycle models; and third, the climatic sensitivities of CGR and tropical terrestrial carbon cycle. Finally, discussions and concluding remarks are presented in Sect. 4 and 5.
2 Data sets, methodologies, and models
2.1 The observed and reanalysis data sets
The long-term in situ records of atmospheric CO2
concen-trations from the Mauna Loa Observatory were obtained from the website of the National Oceanic and Atmospheric Administration (NOAA) Earth System Research Laboratory (ESRL) (Keeling et al., 1976). We used the monthly mean concentrations to calculate the atmospheric CGR for 1960 to 2012. Meanwhile, we took the globally averaged marine sur-face monthly mean data from the NOAA for 1980 to 2012 as a comparison with the Mauna Loa data sets (Masarie and Tans, 1995).
the NASA Global Energy and Water Exchanges (GEWEX) Surface Radiation Budget (SRB) Release-3.0 data sets, with a 1◦×1◦ resolution for the period 1984–2007 (Stackhouse et al., 2011). Soil moisture data sets from the Global Land Data Assimilation System Version 2 (GLDAS-2) monthly NOAH model products were adopted, with a 1◦×1◦ resolu-tion for 1960–2010 (Rodell et al., 2004). We used the sea sur-face temperature (SST) from the Hadley Center (HadSST2) (Rayner et al., 2005), generated from in situ observations held in the International Comprehensive Ocean–Atmosphere Data Set (ICOADS), to obtain the SST anomalies in the Niño 3.4 regions which refer to the ENSO activities.
2.2 Statistical methods
The CGR was estimated as the difference between the monthly mean concentrations in adjacent years (Patra et al., 2005c; Sarmiento et al., 2010):
GR(t )=CO2(t+6)−CO2(t−6), (1) where t denotes the specific month. We then converted the CGR from ppm yr−1into PgC yr−1, based on the conversion
factor 1 PgC=0.471 ppm. The time series of the climatic variables in the tropics (23◦S–23◦N) over land were area-weighted and averaged. The long-term seasonal cycle was removed from these time series, and in order to precisely ex-tract variations on the interannual timescale, we further ap-plied the Lanczos band-pass filter (Duchon, 1979) with cut-off periods at 12 and 120 months and 121 weights to these time series, which filters out the seasonal cycle and decadal variabilities with 1–10 years window for our analyses.
The relationships between the atmospheric CGR and the climatic variables on an interannual timescale were deci-phered via the cross-correlation (Chatfield, 1982):
c(k)= 1 n
n
X
t=1
(X(t )−X)(Y (t+k)−Y )
σ (X)σ (Y ) , (2)
wherekdenotes the lag months,XandY are the means of the time series, andσ (X)andσ (Y )are the standard deviations. These filtered time series are strongly persistent (or highly auto-correlated), so the effective degrees of freedom (dof) were simply estimated with the approach of Bretherton et al. (1999):
dof n =
1−r(1t )2
1+r(1t )2, (3) wherendenotes the sample size,r(1t )is the coefficient of the first order autocorrelation, and1tis 1 month.
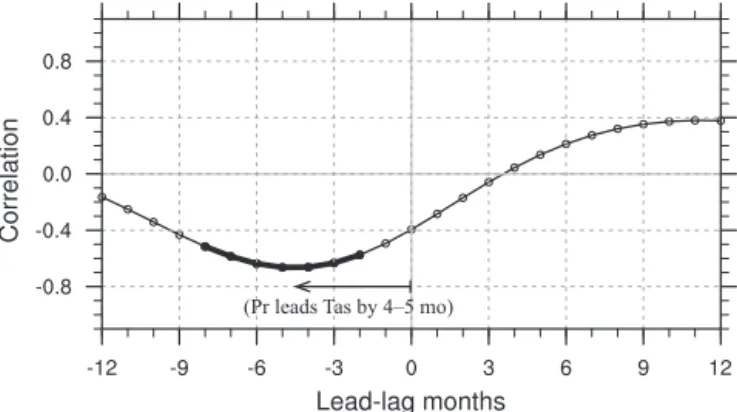
Figure 1 shows how the tropical land temperature and pre-cipitation are closely correlated. Cross-correlation analysis indicates that their relationship peaks at a correlation coef-ficient of −0.66, with a time lag of about 4–5 months in
(Pr leads Tas by 4–5 mo)
Figure 1. The cross-correlation coefficients between the tropical land precipitation (Pr) and temperature (Tas). The horizontal axis denotes the lead-lag months between precipitation and temperature, with negative values indicating that precipitation leads temperature. Bold line indicates correlation above 95 % significance (p≤0.05).
temperature. This high correlation coefficient is partly ow-ing to the fact that less land precipitation (for instance dur-ing El Niño) can inhibit the evapotranspiration over Tropics, promoting the higher temperature (Zeng et al., 2005a), and also is due to ENSO-related circulation adjustments (Gu and Adler, 2010). Sensitivities of the atmospheric CGR – or trop-ical land–atmosphere carbon flux (CFTA) – to temperature
and precipitation were estimated according to the ridge re-gression method (Hoerl and Kennard, 2000), the biased esti-mation for non-orthogonal problems. The linear relationship can be expressed as
y(t )=γintxTas(t )+δintxPr(t−4)+ε, (4) wherey(t )denotes the IAVs in the Mauna Loa CGR, CFTA,
or NPP;xTasandxPrdenote the IAVs in the tropical land tem-perature and precipitation;γintandδintare the estimated sen-sitivities by ridge regression; andεis the residual error. Pre-cipitation leads by 4 months in the regression, according to below analyses. However, these estimated sensitivities only account for the “contributive” effects of temperature and pre-cipitation variations, but not the “true” sensitivities of Mauna Loa CGR, CFTA, or NPP to these variables (Piao et al., 2013).
The responses of terrestrial ecosystems to temperature and precipitation are actually nonlinear, so it is difficult to disen-tangle the individual effects of temperature and precipitation based on the linear statistical method. Additionally, we did not take into consideration the other climatic drivers such as variation in PAR or humidity, which may also contribute to the IAV in atmospheric CGR.
2.3 Terrestrial carbon cycle models and post-processing
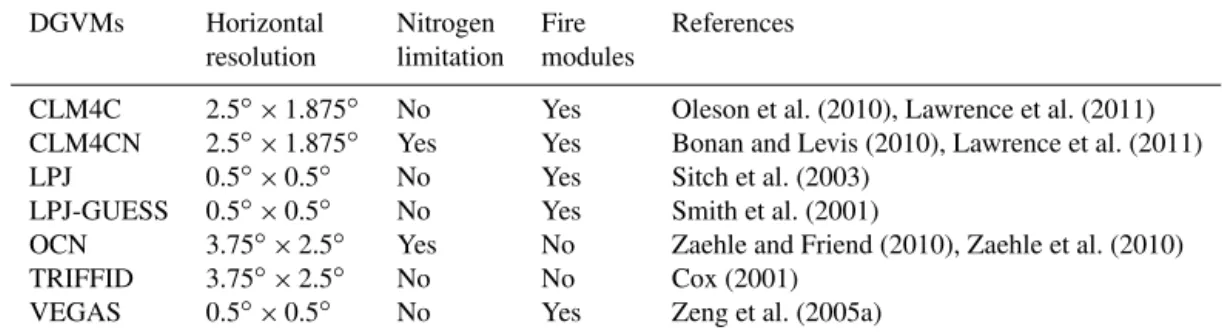
state-of-the-art dynamic global vegetation models (DGVMs) that pstate-of-the-artici- partici-pated in the TRENDY project (TRENDY-v1; Canadell et al., 2011; Sitch et al., 2015). All the DGVMs were forced by observed change in atmospheric CO2concentration and
his-torical climate change. The land use was kept time-invariant during the entire S2 simulation. Information on model reso-lution, nitrogen and fire modules is summarized in Table 1. The models used were (1) CLM4C (Lawrence et al., 2011); (2) CLM4CN (Bonan and Levis, 2010; Lawrence et al., 2011); (3) LPJ (Sitch et al., 2003); (4) LPJ-GUESS (Smith et al., 2001); (5) OCN (Zaehle and Friend, 2010; Zaehle et al., 2010); (6) TRIFFID (Cox, 2001); and (7) VEGAS (Zeng et al., 2005a). Due to the different horizontal resolution of the DGVMs, we interpolated the simulated terrestrial carbon fluxes into a consistent 1◦×1◦resolution using the first order conservative remapping scheme (Jones, 1999) following the equation:
Fk= 1 Ak
Z
Ak
fdA, (5)
whereFkis the area-averaged destination flux,Akis the area
of cellk, andf is the flux on an old grid which has overlap-ping areaAwith the destination grid. After that, the tropical terrestrial carbon fluxes were obtained according to the equa-tion:
F =X
k
FkAk, (6)
between 23◦S–23◦N.
3 Results
3.1 The relationships between the atmospheric CGR and climatic variables
Significant IAV was first detected in the atmospheric CO2
record at the Mauna Loa Laboratory, Hawaii (Keeling et al., 1995, 1976). Figure 2e presents the long-term IAVs of Mauna Loa CGR during 1960–2012 and the globally averaged ma-rine surface data during 1980–2012. The IAVs of the two data sets are highly consistent, so we mainly focus on the long-term Mauna Loa CGR. Shown in Fig. 2a and e, the standard deviation of Mauna Loa CGR is about 1.03 PgC yr−1, with noticeable increases in the positive anomalies in the Niño 3.4 index, and vice versa for the negative anomalies. The ENSO activities, the dominant year-to-year mode of global climate fluctuations, greatly impact tropical precipitation and tem-perature on land, through adjustments in atmospheric circu-lations (Gu and Adler, 2011). Importantly, temperature and precipitation have opposite signs (Fig. 2b and c), with the respective correlation coefficients, relative to the Niño 3.4 index, of 0.55 and −0.83 (p<0.05). These ENSO-induced
tropical land temperature and precipitation variations con-tribute to the CFTA in the same direction due to a
“con-spiracy” between climate anomalies and vegetation–soil re-sponse (Qian et al., 2008; Zeng et al., 2005a). For example, warmer and drier conditions during El Niño events can result in the suppression of NPP and enhancement ofRh, both
lead-ing to anomalous flux into the atmosphere. However, precip-itation does not directly interact with vegetation physiology. Rather, vegetation responds to soil moisture, which is deter-mined not only by precipitation but also by temperature, as higher temperatures lead to increased evaporative water loss (Qian et al., 2008). We also calculated the tropical IAVs in soil moisture from the surface to a 2m depth, and found that the soil moisture decreased during El Niño events, and in-creased during La Niña events (r of−0.63, withp=0.017 in Fig. 2d). As decreases in soil moisture can suppress NPP andRh, and vice versa for increases in soil moisture, this may further affect the atmospheric CGR. Besides temper-ature, precipitation, and soil moisture, other climatic IAVs, such as PAR (Fig. S1 in Supplement), may also influence the variations in terrestrial ecosystems (Nemani et al., 2003).
The coupling between the tropical temperature and pre-cipitation induced by ENSO can be perturbed or inter-rupted by strong volcanic eruptions, such as those of El Chichón in March 1982 and Mount Pinatubo in June 1991 (Fig. 2). Especially during the post-Pinatubo years, the tem-perature and precipitation both decreased in the 1991–1992 El Niño events. This unusual relationship resulted from ra-diative forcing of volcanic sulfate aerosols in the stratosphere (Stenchikov et al., 1998). Meanwhile, there was a hiatus in the coupling between the Niño 3.4 and Mauna Loa CGR in this period. W. Wang et al. (2013) used this decoupling be-tween the Niño 3.4–precipitation–Mauna Loa CGR relation-ship to highlight the temperature–CO2 relationship.
How-ever, the anomalous growth in vegetation was largely at-tributed to diffuse light fertilization (Mercado et al., 2009). In general, the canonical ENSO–CGR relationship is robust, although it can occasionally be externally perturbed.
Table 1.Characteristics of the terrestrial carbon cycle models used in this study.
DGVMs Horizontal Nitrogen Fire References
resolution limitation modules
CLM4C 2.5◦×1.875◦ No Yes Oleson et al. (2010), Lawrence et al. (2011)
CLM4CN 2.5◦×1.875◦ Yes Yes Bonan and Levis (2010), Lawrence et al. (2011)
LPJ 0.5◦×0.5◦ No Yes Sitch et al. (2003)
LPJ-GUESS 0.5◦×0.5◦ No Yes Smith et al. (2001)
OCN 3.75◦×2.5◦ Yes No Zaehle and Friend (2010), Zaehle et al. (2010)
TRIFFID 3.75◦×2.5◦ No No Cox (2001)
VEGAS 0.5◦×0.5◦ No Yes Zeng et al. (2005a)
temperature and Mauna Loa CGR peaks with the correlation coefficient of 0.77 (p=0.002), with a 1-month lag in tem-perature, a little different from the previous results (W. Wang et al., 2013; X. Wang et al., 2014) (Table 2). This discrep-ancy in phase implicitly proves that temperature was not the only dominant factor in controlling IAV in atmospheric CGR. The relationship between land precipitation and Mauna Loa CGR can be bridged by the soil moisture. The correlation of Mauna Loa CGR with concurrent soil moisture has the maximum correlation coefficient of−0.65 (p=0.022), sug-gesting the soil moisture plays an important role in IAV of atmospheric CGR, as analyzed by Qian et al. (2008), though soil moisture is not well constrained by observations. We also show the cross-correlation of Mauna Loa CGR with PAR, but the correlation is not statistically significant.
3.2 Simulations using dynamic global vegetation models
Different from inversion models, process-based terrestrial carbon cycle models can determine the biological dynam-ics underlying the IAV in atmospheric CGR. Previous stud-ies (Jones et al., 2001; Zeng et al., 2005a; Qian et al., 2008) have analyzed individual models. The TRENDY model out-put archives provide the opportunity to analyze the mecha-nisms with an ensemble of state-of-the-art carbon cycle mod-els.
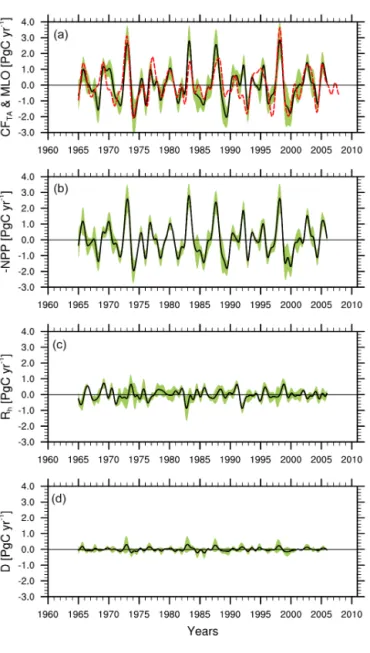
The IAV in ensemble mean tropical CFTA, derived from
six state-of-the-art DGVMs, is presented in Fig. 4a with the 1σ inter-model spread and IAV in Mauna Loa CGR. We excluded the CLM4CN to calculate the ensemble mean be-cause of its different response of CFTA and NPP to
tem-perature and precipitation, according to our analyses. The co-variation coefficient, 0.79 withp=0.003, indicates first, that the tropical terrestrial ecosystems dominate the IAV in atmospheric CGR, confirming previous findings (Braswell et al., 1997; Bousquet et al., 2000; Zeng et al., 2005a); and second, that these state-of-the-art DGVMs have the ca-pacity for capturing the historical IAV in terrestrial ecosys-tems. There is also a significant inconsistency during the post-Pinatubo period 1991–1992, owing to diffuse light fer-tilization (Mercado et al., 2009). To better understand the
contribution from other regions, we also show the IAVs in carbon fluxes for the Northern Hemisphere (23–90◦N) and Southern Hemisphere (60–23◦S) (Fig. S2). It is clear that the magnitudes of IAVs in carbon fluxes from the North-ern Hemisphere (σ=0.38 PgC yr−1) and Southern Hemi-sphere (0.21 PgC yr−1) are much weaker than the tropical
CFTA(1.03 PgC yr−1). Further, the correlations between the
variations in carbon fluxes from the extratropical regions and Mauna Loa CGR are insignificant, suggesting that these IAVs may not be caused by ENSO. Therefore, we will only focus on the tropical CFTAbelow.
The net land–atmosphere carbon flux CFTA results from
carbon adjustments in many biotic and abiotic processes. It can be decomposed as
CFTA=Rh−NPP+D, (7)
whereD denotes the disturbances, mainly caused by fires here. We decomposed the simulated ensemble CFTA into
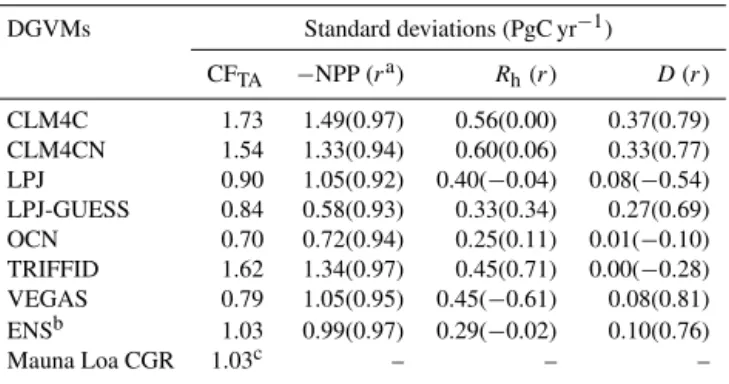
three terms (−NPP, Rh, and D; Fig. 4b–d), to understand which process was the major factor. (To be precise, we ob-tained the termDas the residual according to Eq. (7), be-cause it was not explicitly provided in the S2 simulation). We find that the−NPP has the strongest magnitude in the IAVs (0.99 PgC yr−1, Table 3) among these three processes.
The correlation coefficient of −NPP with CFTA reaches 0.97 (p<0.0001, Table 3), explaining about 94 % of vari-ance. The standard deviations of Rh and D are 0.29 and 0.10 PgC yr−1 (Table 3), respectively, and their correlation coefficients with CFTAare−0.02 (p=0.94) and 0.76 (p= 0.001). The weaker IAVs and insignificant correlation ofRh
with CFTAmay arise from the opposing effects of
tempera-ture and precipitation. For example, higher temperatempera-tures can enhanceRh, whereas less precipitation – drier conditions – can suppress it. This result agrees with the C4MIP results in
which NPP also dominates CFTA (Fig. S3). In contrast, the
weakest term (D) has the very significant correlation with CFTA(Table 3) because both higher temperature and less
pre-cipitation promote fires. In summary, the IAV in tropical NPP largely accounts for tropical CFTAvariation, dominating the
Table 2.Summary of previous studies of the relationships between Mauna Loa CGR and climatic variables.
Studies Correlations of Mauna Loa CGR with climatic variables
Temperature Lead-laga Precipitation Lead-lag
W. Wang et al. (2013) 0.70 0 −0.50 −6
X. Wang et al. (2014) 0.53 0 −0.19b –
in this paper 0.77 1 −0.63 −4
aLead-lag months between Mauna Loa CGR and climatic variables. Positive values indicate the climatic
variables lag Mauna Loa CGR.bThis insignificant correlation coefficient was obtained with concurrent
precipitation in X. Wang et al. (2014).
Figure 2. Interannual variabilities (IAVs) in the Niño 3.4 index, tropical land surface air temperature, precipitation, and soil mois-ture, and atmospheric CO2 growth rate (CGR). The soil moisture was calculated from the surface layer to a 2 m depth. The atmo-spheric CGR, for the Scripps Mauna Loa CO2data from 1960 to 2012 (solid line) and the globally averaged marine surface CO2data from 1980 to 2012 (dashed line), are shown as the difference be-tween the monthly averaged concentrations in the adjacent 2 years. The gray bars represent the three strongest El Niño events during 1965–1966, 1982–1983, and 1997–1998 years and vertical dashed lines show the eruptions of El Chichón and Mount Pinatubo volca-noes in 1982 and 1991, respectively.
(Nino3.4 leads by 3–4 mo) (Tas lags by 1 mo)
(Pr leads by 4 mo)
Figure 3.The cross-correlations of anomalies in Mauna Loa CGR with anomalies in the Niño 3.4 index, tropical terrestrial surface air temperature (Tas), precipitation (Pr), soil moisture (SM), and pho-tosynthetically active radiation (PAR). The horizontal axis shows the lead-lag months between them. Negative month values indicate the anomalies in Mauna Loa CGR lag behind. Bold lines indicate correlation above 95 % significance (p≤0.05), estimated by the
ef-fective degree of freedom.
Table 3. Standard deviations of the terrestrial carbon cycle pro-cesses.
DGVMs Standard deviations (PgC yr−1)
CFTA −NPP (ra) Rh(r) D(r)
CLM4C 1.73 1.49(0.97) 0.56(0.00) 0.37(0.79)
CLM4CN 1.54 1.33(0.94) 0.60(0.06) 0.33(0.77)
LPJ 0.90 1.05(0.92) 0.40(−0.04) 0.08(−0.54)
LPJ-GUESS 0.84 0.58(0.93) 0.33(0.34) 0.27(0.69)
OCN 0.70 0.72(0.94) 0.25(0.11) 0.01(−0.10)
TRIFFID 1.62 1.34(0.97) 0.45(0.71) 0.00(−0.28)
VEGAS 0.79 1.05(0.95) 0.45(−0.61) 0.08(0.81)
ENSb 1.03 0.99(0.97) 0.29(−0.02) 0.10(0.76)
Mauna Loa CGR 1.03c – – –
aIt shows the correlation coefficient with CFTA.bThe ensemble means were calculated
excluding the CLM4CN data because of its large discrepancies responding to temperature and precipitation.cThis value denotes the standard deviation of Mauna Loa CGR, as a reference to
the simulated tropical CFTA.
Figure 4. The simulated IAVs of tropical land–atmosphere car-bon flux (CFTA), reversed net primary productivity (−NPP),
het-erotrophic respiration (Rh), and disturbances (D) by the seven ter-restrial carbon cycle models, involved in the TRENDY project. The solid black lines in the figures denote the ensemble means (ex-cluding CLM4CN), bounded by the 1σ inter-model spread (green
shaded areas). The observed IAVs of Mauna Loa CGR from 1960 to 2012 are also shown in(a)as a red dashed line. We reversed the NPP in order to make the sign consistent, positive values indicate carbon release from the terrestrial ecosystems.
for the interannual anomalies in the tropical CFTAand−NPP
estimated by the 7 DGVMs, as well as Mauna Loa CGR and ensemble mean results (“ENS”). As expected, each correla-tion in pairs among the tropical CFTAis statistically
signifi-cant (p<0.03, Fig. 5a), indicating that these seven DGVMs have great consistency in simulating the IAV in tropical ter-restrial ecosystems under the same climatic forcing, although their considerations and parameterizations on the biotic and abiotic processes differ. Moreover, this consistency also
sug-gests the ensemble result is not fortuitous, and well repre-sents the individual DGVM. Therefore, all the correlations of Mauna Loa CGR with the CFTAsimulated by each DGVM
are significant (p<0.02), like the ensemble CFTA. But it is
in-teresting that the correlation coefficients of Mauna Loa CGR with CLM4CN (0.64,p=0.02) and OCN (0.61,p=0.01) are weaker compared to the other models. We notice that the correlations of these two models with the other models in pairs are the weakest. These two DGVMs share a com-mon feature, as both take the nitrogen limitation for the plant growth into consideration (Table 1). Though accounting for these factors suggests these models are more complete in structure, they do not produce better simulations, indicating that the impact of nitrogen on the carbon cycle remains un-certain.
The correlation coefficients in pairs for NPP also show high consistency (Fig. 5b), further confirming the conclu-sion that the IAV in NPP domination of the CFTA
varia-tion is common to all DGVMs. On the contrary, there are discrepancies in the variations of the simulatedRh and D (Fig. S4). Specifically, we find that four (CLM4C, CLM4CN, LPJ, and LPJ-GUESS) have consistent variations in esti-matedRh, whereas the others (OCN, TRIFFID, and VEGAS)
are different (Fig. S4a). All the simulatedRh, except
TRIF-FID and VEGAS have insignificant correlation with Mauna Loa CGR, like the behavior of the ensemble mean. Even if the correlations are significant in TRIFFID and VEGAS, they have opposite behaviors (TRIFFID: 0.64,p=0.01; VEGAS: −0.52,p=0.08). The various responses to temperature and precipitation result in the occurrence of large uncertainties in the simulatedRh. It is even more difficult to explain the dis-turbance termD(Fig. S4b). However, although large uncer-tainties exist inRhandD, we still conclude with confidence that the variations in tropical vegetation on the interannual timescale largely account for the atmospheric CGR variabil-ity, because the variation magnitudes ofRhandDare much smaller.
Although the correlations of Mauna Loa CGR with the concurrent individual simulated CFTA are all statistically
significant (Fig. 5a), the cross-correlations of Mauna Loa CGR with CFTAshow that small discrepancies in phase exist
among seven DGVMs (Fig. 6a), and of course, are associated with NPP (Fig. 7a). Nevertheless, the correlations of Mauna Loa CGR with the concurrent ensemble CFTA and −NPP
have maximum values, indicating the multi-model simulated ensemble tropical CFTAand−NPP well represent the
varia-tions in Mauna Loa CGR. Of course, the small discrepancies in phase of the individual models originate from their dif-ferent responses to temperature and precipitation. The cor-relation of ensemble CFTA with temperature peaks at 0.91,
Figure 5. Color-coded correlation matrices for the interannual anomalies in the tropical CFTAand−NPP estimated by the seven
terrestrial carbon cycle models. Panel(a)shows correlation coeffi-cients in pairs among the estimated CFTA, and(b)correlation co-efficients in pairs among−NPP in the period 1960–2010. Mauna
Loa CGR and modeled ensemble mean (ENS) are included in these correlations as well. The values in each cell demonstrate the signif-icance levels (p≤0.05 refers to above 95 % significance).
and 3 months (Figs. 6c and 7c, Table 4). These behaviors are highly consistent with those in Mauna Loa CGR (Fig. 3). The responses of each DGVM to temperature and precipita-tion are listed in Table 4. Though there are small discrepan-cies in phase, their behaviors are similar to each other, except for the CLM4CN model. The responses of CFTAand NPP in
CLM4CN to precipitation are too immediate, possibly indi-cating that the soil moisture adjusts too quickly along with precipitation changes. Unlike NPP, the responses ofRhand D
to temperature and precipitation are not so consistent among
Figure 6.The cross-correlations of the simulated tropical CFTA anomalies with Mauna Loa CGR, tropical near-surface temperature, and precipitation over land. The negative months on the horizontal axis indicate that the anomalies in CFTAlag behind. Bold lines in-dicate correlation above 95 % significance (p≤0.05).
the models (Figs. S5 and S6), resulting in the discrepancies shown in Fig. S4.
3.3 Sensitivities to temperature and precipitation
As discussed above (Fig. 3), the variations in atmospheric CGR are correlated with the variations in temperature and precipitation induced by ENSO. Simulations by the process-based terrestrial carbon cycle models have demonstrated that the tropical CFTAvariability, dominated by the plant primary
atmo-Figure 7.The cross-correlations of−NPP with Mauna Loa CGR,
tropical near-surface temperature, and precipitation over land. The negative months on the horizontal axis indicate that the anomalies in −NPP lag behind. Bold lines indicate correlation above 95 %
significance (p≤0.05).
spheric CGR (CFTA/NPP) to temperature and precipitation, respectively? Currently, there is no direct observational evi-dence. Therefore, for simplicity, we took the ridge regression (Hoerl and Kennard, 2000) to linearly decompose the varia-tions in atmospheric CGR, CFTA, and NPP into two parts, as
per Eq. (4). Simultaneously, as the precipitation is not a direct forcing to the terrestrial ecosystems in the models, it usually leads the Mauna Loa CGR by about 4 months (Fig. 3). The precipitation also leads the tropical CFTAand reversed NPP
simulated by the DGVMs for about 3–4 months (Table 4). To be consistent, we chose a 4-month lead, to use precipita-tion as an explanatory variable. The other explanatory vari-able was the concurrent temperature, owing to its direct
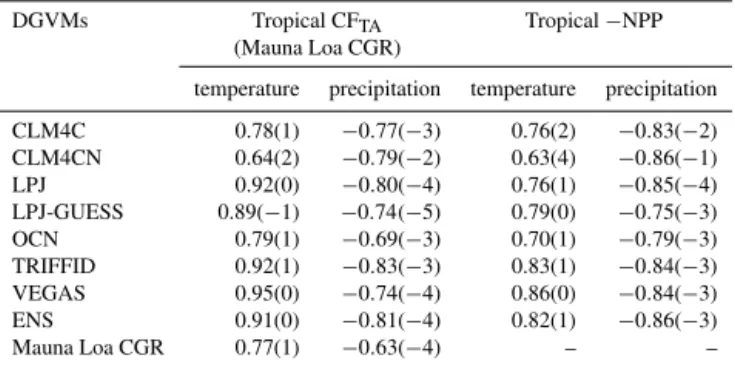
im-Table 4.The maximum correlations of the simulated tropical ter-restrial carbon cycle variability with temperature and precipitation. Lead-lag months between the carbon cycle variability and climatic variables are given in brackets. Positive values indicate that climatic variables lag behind.
DGVMs Tropical CFTA Tropical−NPP
(Mauna Loa CGR)
temperature precipitation temperature precipitation
CLM4C 0.78(1) −0.77(−3) 0.76(2) −0.83(−2)
CLM4CN 0.64(2) −0.79(−2) 0.63(4) −0.86(−1)
LPJ 0.92(0) −0.80(−4) 0.76(1) −0.85(−4)
LPJ-GUESS 0.89(−1) −0.74(−5) 0.79(0) −0.75(−3)
OCN 0.79(1) −0.69(−3) 0.70(1) −0.79(−3)
TRIFFID 0.92(1) −0.83(−3) 0.83(1) −0.84(−3)
VEGAS 0.95(0) −0.74(−4) 0.86(0) −0.84(−3)
ENS 0.91(0) −0.81(−4) 0.82(1) −0.86(−3)
Mauna Loa CGR 0.77(1) −0.63(−4) – –
pact. We excluded the CLM4CN simulations, because of the model’s differing responses to temperature and precipitation (Figs. 6 and 7).
The sensitivity of Mauna Loa CGR to the tropical tem-perature IAV is about 2.92±0.20 PgC yr−1K−1 (Fig. 8a). This positive response is weaker than that found by Piao et al. (2013) who obtained the contributive effect of tempera-ture variations on residual land sink (RLS, Le Quèrè, 2009) of about−3.9±1.1 PgC yr−1K−1(the negative sign is be-cause of the opposite variability between Mauna Loa CGR and RLS) using multiple linear regression on the global scale. The IAV in the RLS like Mauna Loa CGR is basically deter-mined by the tropical terrestrial ecosystems. Considering the inhomogeneity of temperature variations on the global scale, it is more reasonable to use the tropical temperature variabil-ity to estimate their temperature-dependence. The sensitiv-ity of the ensemble tropical CFTA to the temperature
vari-ability is about 3.18±0.11 PgC yr−1K−1, very close to the sensitivity of Mauna Loa CGR. The sensitivities of the trop-ical CFTA in the individual DGVMs are all positive,
rang-ing from 1.95±0.12 PgC yr−1K−1 in the OCN model, to 4.78±0.17 PgC yr−1K−1 in TRIFFID. Three models well simulate this sensitivity: LPJ is 2.88±0.09; LPJ-GUESS is 2.79±0.12; and VEGAS is 2.98±0.08 PgC yr−1K−1. These CFTA sensitivities are linearly correlated with those
of −NPP with a slope of 0.61, and a correlation coeffi-cient of 0.83 (p <0.05), in accord with the conclusion that variabilities in vegetation primary production dominate the CFTA variabilities. This is in accord with the result in Piao
et al. (2013), that the response of gross primary production (GPP) to temperature accounts for the response of net bio-sphere production (NBP).
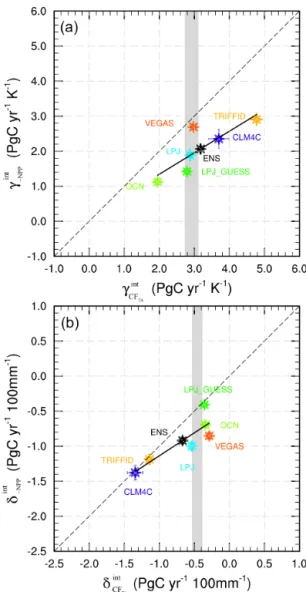
Figure 8.Sensitivities of the tropical anomalies in CFTA,−NPP,
and Mauna Loa CGR to(a)interannual variability in tropical near-surface temperature over land (PgC yr−1K−1) and(b)interannual variability in tropical precipitation over land (PgC yr−1100 mm−1)
in 1960–2010. The grey areas show the values of the sensitivities of Mauna Loa CGR with standard errors. Error bars indicate the standard errors of the estimated sensitivities for each model.
value of 0.8±1.1 PgC yr−1 100 mm−1. This difference is mainly due to the usage of (a) annually averaged RLS and precipitation, and (b) globally averaged precipitation variability. The sensitivity of the ensemble tropical CFTA
simulated by the DGVMs to precipitation variability is −0.67±0.04 PgC yr−1100 mm−1, a little stronger than the estimation in Mauna Loa CGR. In the individual DGVMs, three have values within the uncertainty of Mauna Loa CGR: LPJ at −0.54±0.04; LPJ-GUESS at −0.36±0.04; and OCN at −0.34±0.05 PgC yr−1 100 mm−1. The es-timation in VEGAS is a little weaker, with a value of −0.29±0.03 PgC yr−1100 mm−1, whereas the estimations in CLM4C (−1.34±0.05 PgC yr−1 100 mm−1) and
TRIF-Figure 9. Spatial sensitivities of the ensemble mean in tropical CFTAinterannual anomalies to tropical near-surface air temperature (kgC m−2yr−1K−1) and precipitation (kgC m−2yr−1100 mm−1)
over land. The dotted areas in both figures indicate correlation above 95 % significance (p≤0.05).
FID (−1.14±0.06 PgC yr−1 100 mm−1) are too strong. Clearly, a significant linear relationship also exists between these sensitivities in CFTA and−NPP, with a slope of 0.65, and correlation coefficient 0.86, withp <0.05.
Based on the combination of sensitivities to temperature and precipitation, CLM4C and TRIFFID are more sensitive to these climatic variabilities than the other DGVMs, re-sulting in a stronger IAVs in these two models (CLM4C: σ=1.73 PgC yr−1, TRIFFID:σ=1.62 PgC yr−1; Table 3), whereas the other DGVMs have more reasonable magnitudes except CLM4CN (Table 3). Overall, the models simulate well the historical IAV, due to their reasonable sensitivity to the tropical terrestrial ecosystems’ temperature and precipi-tation.
Past studies on the interannual CO2variability have mostly
focused on the sensitivities of the aggregated carbon flux to temperature and precipitation (Zeng et al., 2005a; Qian et al., 2008; W. Wang et al., 2013). Here we present the sen-sitivities of the ensemble CFTA grid by grid to temperature
4 Discussion
In this study, after taking the lag effect of precipitation into consideration (Qian et al., 2008), we find that Mauna Loa CGR has a high correlation coefficient with precipitation (r= −0.63), which is only slightly different from the cor-relation coefficient with temperature (r=0.77). It contrasts with the result of X. Wang et al. (2014). Simultaneously, given that tropical land precipitation and air temperature are dynamically correlated (Fig. 1), we think these correlation coefficients favor neither temperature nor precipitation as the dominant factor of CGR IAV. It contrasts with the result of W. Wang et al. (2013) that is based on the high correlation coefficient between Mauna Loa CGR and temperature. Fur-ther, they pointed out that the temperature-CO2 coupling is
mainly owing to the additive responses of NPP and Rh to temperature, while the weaker precipitation-CO2coupling is
because of the subtractive responses of NPP andRhto pre-cipitation. However, in this study, the biological dynamics underlying CGR IAV, based on seven DGVMs, reveal that NPP is the dominant process, and Rh variability is
obvi-ously weaker, caused by the opposing effects of precipita-tion and temperature. In the tropics, NPP turned out to be largely driven by precipitation through process-based terres-trial ecosystem models (Zeng et al., 2005a; Qian et al., 2008), indicating the key role of precipitation in CGR IAV. These mechanistic analyses may give out more convincing expla-nations than the correlation coefficients. Conversely, if NPP dominates the atmospheric CGR, or in other words, precip-itation dominates the atmospheric CGR, why does Mauna Loa CGR have a high (or even higher) correlation coeffi-cient with tropical land temperature (than tropical precipi-tation) (Fig. 3)? This possibly can be explained in part by the high correlation coefficient between the tropical land precip-itation and temperature (Fig. 1). On the other hand,Rhand D, though with smaller contributions, can still influence their correlation coefficient (Table 4). Also, we should be cautious of the method for separating the roles of temperature and precipitation in CGR IAV used in this paper and previous studies (Piao et al., 2013; W. Wang et al., 2013; X. Wang et al., 2014). These statistical methods are based on linear decompositions, which may miss important nonlinearities in the physical and biological systems, and cannot accurately deal with the correlations between precipitation and temper-ature. Therefore, the separate sensitivities of temperature and precipitation diagnosed by these statistical methods are only as the contributive effects (Piao et al., 2013). A better esti-mation of the contributions of temperature and precipitation should use simulations of processed-based terrestrial carbon cycle models via several sensitivity experiments, while rec-ognizing major uncertainties in the current generation of car-bon cycle models.
Although we find that the majority of seven DGVMs can well simulate the IAV in tropical terrestrial ecosystems, the discrepancies in theRhsimulations (Fig. S4) reveal that the
soil carbon decomposition processes and microbial activities are not yet to be fully understood. Previous studies (Zeng et al., 2005a; Qian et al., 2008; W. Wang et al., 2013) found thatRhcontributes in the same direction of NPP to the IAV of the atmospheric CGR. However, in this study the model ensembleRhis weaker and not significantly correlated with
Mauna Loa CGR.
Besides the tropical NPP andRh, which is the main
fo-cus of our analyses, the atmospheric CGR IAV may also have contributions from other processes or regions, such as variability of the terrestrial carbon flux at mid–high latitude, air–sea carbon fluxes, and the fluxes caused by fire events and land use. Though variabilities of carbon fluxes from the Northern and Southern hemispheres are weak (Fig. S2), some severe events may also modify the canonical tropically-dominated ENSO response. For instance, the anomalous car-bon release from 1998 to 2002 across the Northern Hemi-sphere’s mid-latitude regions originated from decreased bio-logical productivity (0.9 PgC yr−1) and forests wildfires,
in-duced by drought and warming (Balzter et al., 2005; Jones and Cox, 2005; Zeng et al., 2005b). The Ocean, another im-portant carbon sink, has a moderate sea-air carbon flux vari-ability of about±0.5 PgC yr−1, dominated over by equato-rial Pacific Ocean (Bousquet et al., 2000; McKinley et al., 2004; Patra et al., 2005b; Le Quèrè, 2009). However, during El Niño events, the ocean acts as a sink of atmospheric CO2,
owing to the decrease in equatorial Pacific outgassing caused by the weakened upwelling within the carbon-rich deep wa-ter; the opposite occurs during La Niña (Jones et al., 2001; McKinley et al., 2004). This variability opposes that of the atmospheric CGR. Fires also play an important role in the at-mospheric CO2 variability. During the 1997–1998 El Niño
event, a fire emissions anomaly, triggered by widespread drought, was 2.1±0.8 PgC, or 66±24 % of CGR anomaly with a 60 % contribution from the Southeast Asia (van der Werf et al., 2004).
At last, there is a concern on the direct comparison be-tween the non-transported modeled carbon fluxes and CO2
observations. Patra et al. (2005c) conducted a multiple re-gression analysis between Mauna Loa CGR and a time-dependent inverse (TDI) modeled flux anomalies over 22 TransCom-3 regions, showing the TDI flux anomalies do not explain the detail features in Mauna Loa CGR without any time lag.
5 Concluding remarks
The IAV in atmospheric CGR is closely connected with ENSO activities, as a consequence of the tropical terrestrial carbon sources and sinks, induced by a “conspiracy” between climate anomalies and the responses of vegetation physiol-ogy and soil (Zeng et al., 2005a). Understanding the rela-tive contribution of CO2sensitivity to tropical precipitation
future carbon-climate feedback using such “emergent con-straint” proposed by Cox et al. (2013). Therefore, in this pa-per, we re-examined the relationship between atmospheric CGR and climatic variables (temperature, precipitation, soil moisture, and PAR). Moreover, we used seven DGVMs, all participating in the TRENDY project, to delineate the pro-cesses underlying the CGR. We applied ridge regression to statistically disentangle the separate effects of temperature and precipitation on the IAV in CGR. Simultaneously, we can better understand the performance of the individual DGVM from these results. The key results are summarized below.
We find that tropical precipitation and temperature are highly correlated,r= −0.66, with precipitation leading tem-perature by 4–5 months, and both are closely connected with ENSO activities. Mauna Loa CGR lags behind the tropical land precipitation variability by about 4 months (r= −0.63), but leads temperature by about 1 month (0.77). However, in contrast to some recent suggestions, we argue that these re-lationships alone do not strongly favor temperature over pre-cipitation as the leading driving factor of CO2IAV, nor vice
versa. Further, we find that Mauna Loa CGR coincides with soil moisture (−0.65), which is not only determined by pre-cipitation but also by temperature as higher temperatures in-crease the evapotranspiration effect.
All seven DGVMs capture well the IAV of tropical CFTA.
The ensemble CFTA(σ=1.03 PgC yr−1) is highly correlated with Mauna Loa CGR atr=0.79 (p=0.003). Importantly, the models consistently show that the variability in NPP dominates the CFTA variability, while the responses of soil
respiration and fire disturbance are much weaker. The stan-dard deviation in ensemble NPP is 0.99 PgC yr−1, and in con-trast, they are 0.29 and 0.10 PgC yr−1for ensembleR
hand
Drespectively. As NPP is largely driven by precipitation (via soil moisture), these state-of-the-art DGVMs suggest a key role of precipitation in the IAV of atmospheric CGR.
The sensitivities of Mauna Loa CGR to tempera-ture and precipitation are 2.92±0.20 PgC yr−1K−1 and −0.46±0.07 PgC yr−1100 mm−1, respectively. Meanwhile, the sensitivities of the ensemble mean tropical CFTA
produced by the state-of-the-art DGVMs to tempera-ture and precipitation are 3.18±0.11 PgC yr−1K−1 and −0.67±0.04 PgC yr−1100 mm−1, close to those of Mauna Loa CGR. Spatially, the sensitivities to temperature in the tropics are all positive, with remarkably stronger responses over the dense vegetation regions, especially in the Ama-zon. The sensitivities to precipitation are all negative, with the strongest responses over the African savannas, indicating that grasses (or shrubs) are more sensitive to precipitation than forests.
Data availability
Mauna Loa and globally averaged marine surface monthly CO2 records are respectively available at
http://www.esrl.noaa.gov/gmd/ccgg/trends/index.html and http:/www.esrl.noaa.gov/gmd/ccgg/trends/global.html. CRU near-surface air temperature and precipitation are accessible from http://browse.ceda.ac.uk/browse/ badc/cru/data/cru_ts/cru_ts_3.21. Soil moisture data from GLDAS-2 are accessible at the Goddard Earth Sciences Data and Information Services Center, http://disc.sci.gsfc.nasa.gov/hydrology/data-holdings. Sea surface temperature data set is available at http://hadobs. metoffice.com/hadsst2/data/download.html. Outputs of the state-of-the-art DGVMs are available from the TRENDY Project: http://www-lscedods.cea.fr/invsat/RECCAP/V2/.
The Supplement related to this article is available online at doi:10.5194/bg-13-2339-2016-supplement.
Acknowledgements. We acknowledge the TRENDY DGVM
community, as part of the Global Carbon Project, for access to gridded land data. And we also wish to thank the Earth System Research Laboratory for the use of their atmospheric CO2 data sets, the University of East Anglia Climatic Research Unit for land surface air temperature and precipitation, NASA’s Atmospheric Science Data Center for the photosynthetically active radiation data, the Goddard Earth Science Data and Information Services Center for the soil moisture, and the UK Met Office’s Hadley Centre for the sea surface temperature. This study was supported by the National Key Technology R&D Program (2014BAC22B05). And Ning Zeng’s participation was supported by both NOAA (NA10OAR4310248 and NA09NES4400006) and the NSF (AGS-1129088).
Edited by: A. Rammig
References
Ahlstrom, A., Raupach, M. R., Schurgers, G., Smith, B., Arneth, A., Jung, M., Reichstein, M., Canadell, J. G., Friedlingstein, P., Jain, A. K., Kato, E., Poulter, B., Sitch, S., Stocker, B. D., Viovy, N., Wang, Y. P., Wiltshire, A., Zaehle, S., and Zeng, N.: The domi-nant role of semi-arid ecosystems in the trend and variability of the land CO2sink, Science, 348, 895–899, 2015.
Bacastow, R. B. : Modulation of atmospheric carbon dioxide by the Southern Oscillation, Nature, 261, 116–118, 1976.
Balzter, H., Gerard, F. F., George, C. T., Rowland, C. S., Jupp, T. E., McCallum, I., Shvidenko, A., Nilsson, S., Sukkinin, A., Onuchin, A., and Schmullius, C.: Impact of the Arctic Oscillation pattern on interannual forest fire variability in Central Siberia, Geophys. Res. Lett., 32, L14709, doi:10.1029/2005gl022526, 2005. Bonan, G. B. and Levis S.: Quantifying carbon-nitrogen feedbacks
in the Community Land Model (CLM4), Geophys. Res. Lett., 37, L07401, doi:10.1029/2010GL042430, 2010.
Braswell, B. H., Schimel, D. S., Linder, E., and Moore, B.: The response of global terrestrial ecosystems to interannual tempera-ture variability, Science, 278, 870–872, 1997.
Bretherton, C. S., Widmann, M., Dymnikov, V. P., Wallace, J. M., and Blade, I.: The effective number of spatial degrees of freedom of a time-varying field, J. Climate, 12, 1990–2009, 1999. Canadell, J., Ciais, P., Gurney, K., Le Quèrè, C., Piao, S., Raupach,
M. R., and Sabine, C. L.: An international effort to quantify re-gional C fluxes, EOS, 92, 81–82, 2011.
Chatfield, C.: The analysis of time series: An introduction, Chap-man & Hall, London, 1982.
Clark, D. A., Piper, S. C., Keeling, C. D., and Clark, D. B.: Tropical rain forest tree growth and atmospheric carbon dynamics linked to interannual temperature variation during 1984–2000, P. Natl. Acad. Sci. USA, 100, 5852–5857, 2003.
Corlett, R. T.: Impacts of warming on tropical lowland rainforests, Trends Ecol. Evol., 26, 606–613, 2011.
Cox, P. M.: Description of the “TRIFFID” Dynamic Global Vegeta-tion Model, Technical Note 24, HadleyCentre, Met Office, 2001. Cox, P. M., Betts, R. A., Jones, C. D.,Spall, S. A., and Totterdell, I. J.: Acceleration of global warming due to carbon-cycle feed-backs in a coupled climate model, Nature, 408, 184–187, 2000. Cox, P. M., Pearson, D., Booth, B. B., Friedlingstein, P.,
Hunting-ford, C., Jones, C. D., and Luke, C. M.: Sensitivity of tropical carbon to climate change constrained by carbon dioxide variabil-ity, Nature, 494, 341–344, 2013.
Doughty, C. E. and Goulden, M. L.: Are tropical forests near a high temperature threshold?, J. Geophys. Res., 113, G00B07, doi:10.1029/2007jg000632, 2008.
Duchon, C. E.: Lanczos Filtering in One and Two Dimensions, J. Appl. Meteorol., 18, 1016–1022, 1979.
Feely, R. A., Boutin, J., Cosca, C. E., Dandonneau, Y., Etcheto, J., Inoue, H. Y., Ishii, M., Le Quéré, C., Machey, D. J., McPhaden, M., Metzl, N., Poisson, A., and Wanninkhof, R.: Seasonal and interannual variability of CO2in the equatorial Pacific, Deep-Sea Res. Pt. I, 49, 2443–2469, 2002.
Francey, R. J., Tans, P. P., Allison, C. E., Enting, I. G., White, J. W. C., and Trolier, M.: Changes in Oceanic and Terrestrial Carbon Uptake since 1982, Nature, 373, 326–330, 1995.
Gu, G. J. and Adler, R. F.: Precipitation and Temperature Variations on the Interannual Time Scale: Assessing the Impact of ENSO and Volcanic Eruptions, J. Climate, 24, 2258–2270, 2011. Harris, I., Jones, P. D., Osborn, T. J., and Lister, D. H.: Updated
high-resolution grids of monthly climatic observations – the CRU TS3.10 Dataset, Int. J. Climatol., 34, 623–642, 2014. Hoerl, A. E. and Kennard, R. W.: Ridge Regression: Biased
Esti-mation for Nonorthogonal Problems, Technometrics, 42, 80–86, 2000.
Jones, C. D. and Cox P. M.: On the significance of atmospheric CO2growth rate anomalies in 2002–2003, Geophys. Res. Lett., 32, L14816, doi:10.1029/2005gl023027, 2005.
Jones, C. D., Collins, M., Cox, P. M., and Spall, S. A.: The carbon cycle response to ENSO: A coupled climate-carbon cycle model study, J. Climate, 14, 4113–4129, 2001.
Jones, P. W.: First- and second-order conservative remapping schemes for grids in spherical coordinates, Mon. Weather Rev., 127, 2204–2210, 1999.
Keeling, C. D. and Revelle, R.: Effects of El-Niño Southern Oscil-lation on the Atmospheric Content of Carbon-Dioxide, Meteorit-ics, 20, 437–450, 1985.
Keeling, C. D., Bacastow, R. B., Bainbridge, A. E., Ekdahl, C. A., Guenther, P. R., Waterman, L. S., and Chin, J. F. S.: Atmospheric Carbon-Dioxide Variations at Mauna-Loa Observatory, Hawaii, Tellus, 28, 538–551, 1976.
Keeling, C. D., Whorf, T. P.,Wahlen, M., and van der Plichtt, J.: Interannual extremes in the rate of rise of atmospheric carbon dioxide since 1980, Nature, 375, 666–670, 1995.
Kindermann, J., Würth, G., Kohlmaier, G. H., and Badeck, F. W.: Interannual variation of carbon exchange fluxes in terrestrial ecosystems, Global Biogeochem. Cy., 10, 737–755, 1996. Knorr, W., Scholze, M., Gobron, N., Pinty, B., and Kaminski, T.:
Global-scale drought caused atmospheric CO2 increase, EOS Archives, 86, 178–181, 2005.
Lawrence, D. M., Oleson, K. W., Flanner, M. G., Thornton, P. E., Swenson, S. C., Lawrence, P. J., Zeng, X. B., Yang, Z. L., Levis, S., Sakaguchi, K., Bonan, G. B., and Slater, A. G.: Parameteri-zation Improvements and Functional and Structural Advances in Version 4 of the Community Land Model, J. Adv. Model. Earth Sy., 3, M03001, doi:10.1029/2011ms000045, 2011.
Lee, K., Wanninkhof, R., Takahashi, T., Doney, S. C., and Feely, R. A.: Low interannual variability in recent oceanic uptake of atmospheric carbon dioxide, Nature, 396, 155–159, 1998. Le Quèrè, C.: Trends in the sources and sinks of carbon dioxide,
Nature Geosci., 2, 831–836, 2009.
Masarie, K. A. and Tans, P. P.: Extension and integration of atmo-spheric carbon dioxide data into a globally consistent measure-ment record, J. Geophys. Res., 100, 11593–11610, 1995. McKinley, G. A., Follows, M. J., and Marshall, J.: Mechanisms
of air-sea CO2 flux variability in the equatorial Pacific and the North Atlantic, Global Biogeochem. Cy., 18, GB2011, doi:10.1029/2003gb002179, 2004.
Mercado, L. M., Bellouin, N., Sitch, S., Boucher, O., Huntingford, C., Wild, M., and Cox, P. M.: Impact of changes in diffuse radi-ation on the global land carbon sink, Nature, 458, 1014-U1087, doi:10.1038/Nature07949, 2009.
Oleson, K. W., Lawrence, D. M., Gordon, B., Flanner, M. G., Kluzek, E., Peter, J., Levis, S., Swenson, S. C., Thornton E., and Feddema, J.: Technical description of version 4.0 of the Commu-nity Land Model (CLM), NCAR/TN-478+STR, 2010.
Nakazawa, T., Morimoto, S., Aoki, S., and Tanaka, M.: Temporal and spatial variations of the carbon isotopic ratio of atmospheric carbon dioxide in the western Pacific region, J. Geophys. Res.-Atmos., 102, 1271–1285, 1997.
Nemani, R. R., Keeling, C. D., Hashimoto, H., Jolly, W. M., Piper, S. C., Tucker, C. J., Myneni, R. B., and Running, S. W.: Climate-driven increases in global terrestrial net primary production from 1982 to 1999, Science, 300, 1560–1563, 2003.
Patra, P. K., Ishizawa, M., Maksyutov, S., Nakazawa, T., and Inoue, G.: Role of biomass burning and climate anomalies for land-atmosphere carbon fluxes based on inverse modeling of atmospheric CO2, Global Biogeochem. Cy., 19, GB3005, doi:10.1029/2004GB002258, 2005a.
Patra, P. K., Maksyutov, S., and Nakazawa, T.: Analysis of atmo-spheric CO2growth rates at Mauna Loa using CO2fluxes de-rived from an inverse model, Tellus B, 57, 357–365, 2005c. Phillips, O. L., Aragão, L., Lewis, S. L., Fisher, J. B., Lloyd, J.,
López-González, G., Malhi, Y., Monteagudo, A., Peacock, J., Quesada, C. A., Heijden, G., Almeida, S., Amaral, I., Arroyo, L., Aymard, G., Baker, T. R., Bánki, O., Blanc, L., Bonal, D., Brando, P., Chave, J., de Oliveira, Á., Cardozo, N., Czimczik, C., Feldpausch, T., Freitas, M. A., Gloor, E., Higuchi, N., Jiménez, E., Lloyd, G., Meir, P., Mendoza, C., Morel, A., Neill, D. A., Nepstad, D., Patiño, S., Peñuela, M. C., Prieto, A., Ramírez, F., Schwarz, M., Silva, J., Silveira, M., Thomas, A. S., Steege, H., Stropp, J., Vásques, R., Zelazowski, P., Dávila, E. A., Andelman, S., Andrade, A., Chao, K. J., Erwin, T., Fiore, A. D., Honorio, E., Keeling, H., Killeen, T. J., Laurance, W. F., Cruz, A. P., Pitman, N. C. A., Vargas, P. N., Ramírez-Angulo, H., Rudas, A., Salamão, R., Silva N., Terborgh, J., and Torres-Lezama, A.: Drought Sensi-tivity of the Amazon Rainforest, Science, 323, 1344–1347, 2009. Piao, S. L., Sitch, S., Ciais, P., Friedlingstein, P., Peylin, P., Wang, X. H., Ahlstrom, A., Anav, A., Canadell, J. G., Cong, N., Hunt-ingford, C., Jung, M., Levis, S., Levy, P. E., Li, J. S., Lin, X., Lo-mas, M. R., Lu, M., Luo, Y. Q., Ma, Y. C., Myneni, R. B., Poul-ter, B., Sun, Z. Z., Wang, T., Viovy, N., Zaehle, S., and Zeng, N.: Evaluation of terrestrial carbon cycle models for their response to climate variability and to CO2trends, Glob. Change Biol., 19, 2117–2132, 2013.
Qian, H., Joseph, R., and Zeng, N.: Response of the terrestrial car-bon cycle to the El Niño-Southern Oscillation, Tellus B, 60, 537– 550, 2008.
Rayner, N. A., Brohan, P., Parker, D. E., Folland, C. K., Kennedy, J. J., Vanicek, M., Ansell, T. J., and Tett, S. F. B.: Improved Analyses of Changes and Uncertainties in Sea Surface Temper-ature Measured In Situ since the Mid-Nineteenth Century: The HadSST2 Dataset, J. Climate, 19, 446–469, 2005.
Rodell, M., Houser, P. R., Jambor, U., Gottschalck, J., Mitchell, K., Meng, C. J., Arsenault, K., Cosgrove, B., Radakovich, J., Bosilovich, M., Entin, J. K., Walker, J. P., Lohmann, D., and Toll, D.: The global land data assimilation system, B. Am. Meteorol. Soc., 85, 381–394, 2004.
Rodenbeck, C., Houweling, S., Gloor, M., and Heimann, M.: CO2 flux history 1982–2001 inferred from atmospheric data using a global inversion of atmospheric transport, Atmos. Chem. Phys., 3, 1919–1964, doi:10.5194/acp-3-1919-2003, 2003.
Sarmiento, J. L., Gloor, M., Gruber, N., Beaulieu, C., Jacobson, A. R., Mikaloff Fletcher, S. E., Pacala, S., and Rodgers, K.: Trends and regional distributions of land and ocean carbon sinks, Bio-geosciences, 7, 2351–2367, doi:10.5194/bg-7-2351-2010, 2010. Sitch, S., Smith, B., Prentice, I. C., Arneth, A., Bondeau, A., Cramer, W., Kaplan, J. O., Levis, S., Lucht, W., Sykes, M. T., Thonicke, K., and Venevsky, S.: Evaluation of ecosystem dynam-ics, plant geography and terrestrial carbon cycling in the LPJ dy-namic global vegetation model, Glob. Change Biol., 9, 161–185, 2003.
Sitch, S., Friedlingstein, P., Gruber, N., Jones, S. D., Murray-Tortarolo, G., Ahlström, A., Doney, S. C., Graven, H., Heinze, C., Huntingford, C., Levis, S., Levy, P. E., Lomas, M., Poul-ter, B., Viovy, N., Zaehle, S., Zeng, N., Arneth, A., Bonan, G., Bopp, L., Canadell, J. G., Chevallier, F., Ciais, P., Ellis, R., Gloor, M., Peylin, P., Piao, S. L., Le Quéré, C., Smith, B.,
Zhu, Z., and Myneni, R.: Recent trends and drivers of regional sources and sinks of carbon dioxide, Biogeosciences, 12, 653– 679, doi:10.5194/bg-12-653-2015, 2015.
Smith, B., Prentice, I. C., and Sykes, M. T.: Representation of vegetation dynamics in the modelling of terrestrial ecosystems: comparing two contrasting approaches within European climate space, Global Ecol. Biogeogr., 10, 621–637, 2001.
Stackhouse, Jr., Paul, W., Shashi, K. G., Stephen, J. C., Mikovitz, J. C., Zhang, T. P., and Hinkelman, L. M.: The NASA/GEWEX Surface Radiation Budget Release 3.0: 24.5-Year Dataset, GEWEX News, 21 February, 10–12, 2011.
Stenchikov, G. L., Kirchner, I., Robock, A., Graf, H.-F., Antuña, J. C., Grainger, R. G., Lambert, A., and Thomason, L.: Radia-tive forcing from the 1991 Mount Pinatubo volcanic eruption, J. Geophys. Res., 103, 13837, doi:10.1029/98jd00693, 1998. Tian, H. Q., Melillo, J. M., Kicklighter, D. W., McGuire, A. D.,
Helfrich, J. V. K., Moore, B., and Vorosmarty, C. J.: Effect of interannual climate variability on carbon storage in Amazonian ecosystems, Nature, 396, 664–667, 1998.
van der Werf, G. R., Randerson, J. T., Collatz, G. J., Giglio, L., Kasibhatla, P. S., Arellano, A. F., Olsen Jr., S. C., and Kasischke, E. S.: Continental-scale partitioning of fire emissions during the 1997 to 2001 El Niño/La Niña period, Science, 303, 73–76, 2004. Wang, J., Zeng, N., Liu, Y., and Bao, Q.: To what extent can interan-nual CO2variability constrain carbon cycle sensitivity to climate change in CMIP5 Earth System Models?, Geophys. Res. Lett., 41, 3535–3544, 2014.
Wang, W., Ciais, P., Nemani, R., Canadell, J. G., Piao, S., Sitch, S., White, M. A., Hashimoto, H., Milesi, C., and Myneni R. B.: Variations in atmospheric CO2growth rates coupled with tropi-cal temperature, PNAS, 110, 13061–13066, 2013.
Wang, X., Paio, S., Ciais, P., Friedlingstein, P., Myneni, R. B., Cox, P., Heimann, M., Miller, J., Peng, S., Wang, T., Yang, H., and Chen, A.: A two-fold increase of carbon cycle sensitivity to trop-ical temperature variations, Nature, 506, 212–215, 2014. Wenzel, S., Cox, P. M., Eyring, V., and Friedlingstein, P.:
Emer-gent constraints on climate-carbon cycle feedbacks in the CMIP5 Earth system models, J. Geophys. Res.-Biogeo., 119, 794–807, 2014.
Zaehle, S. and Friend, A. D.: Carbon and nitrogen cycle dynamics in the O-CN land surface model: 1. Model description, site-scale evaluation, and sensitivity to parameter estimates, Global Bio-geochem. Cy., 24, GB1005, doi:10.1029/2009gb003521, 2010. Zaehle, S., Friend, A. D., Friedlingstein, P., Dentener, F., Peylin, P.,
and Schulz, M.: Carbon and nitrogen cycle dynamics in the O-CN land surface model: 2. Role of the nitrogen cycle in the his-torical terrestrial carbon balance, Global Biogeochem. Cy., 24, GB1006, doi:10.1029/2009gb003522, 2010.
Zeng, N., Mariotti, A., and Wetzel, P.: Terrestrial mechanisms of in-terannual CO2variability, Global Biogeochem. Cy., 19, GB1016, doi:10.1029/2004gb002273, 2005a.