www.biogeosciences.net/10/6391/2013/ doi:10.5194/bg-10-6391-2013
© Author(s) 2013. CC Attribution 3.0 License.
Biogeosciences
Synergism between elevated
p
CO
2
and temperature on the
Antarctic sea ice diatom
Nitzschia lecointei
A. Torstensson*, M. Hedblom*, J. Andersson , M. X. Andersson , and A. Wulff
Department of Biological and Environmental Sciences, University of Gothenburg, P.O. Box 461, 405 30 Göteborg, Sweden
*These authors contributed equally to this work.
Correspondence to:A. Torstensson ([email protected])
Received: 21 March 2013 – Published in Biogeosciences Discuss.: 10 April 2013 Revised: 29 August 2013 – Accepted: 4 September 2013 – Published: 9 October 2013
Abstract.Polar oceans are particularly susceptible to ocean
acidification and warming. Diatoms play a significant role in sea ice biogeochemistry and provide an important food source to grazers in ice-covered oceans, especially during early spring. However, the ecophysiology of ice-living or-ganisms has received little attention in terms of ocean acid-ification. In this study, the synergism between temperature and partial pressure of CO2(pCO2)was investigated in
rela-tionship to the optimal growth temperature of the Antarctic sea ice diatomNitzschia lecointei. Diatoms were kept in cul-tures at controlled levels ofpCO2(∼390 and∼960 µatm) and temperature (−1.8 and 2.5◦C) for 14 days. Synergism between temperature andpCO2was detected in growth rate
and acyl lipid fatty acid (FA) content. Optimal growth rate was observed around 5◦C in a separate experiment. Car-bon enrichment only promoted (6 %) growth rate closer to the optimal growth, but not at the control temperature (−1.8◦C). At−1.8◦C and at ∼960 µatm pCO2, the total
FA content was reduced relative to the ∼390 µatm treat-ment, although no difference betweenpCO2treatments was
observed at 2.5◦C. A large proportion (97 %) of the total FAs comprised on average of polyunsaturated fatty acids (PUFA) at−1.8◦C. Cellular PUFA content was reduced at ∼960 relative to∼390 µatm pCO2. Effects of carbon
en-richment may be different depending on ocean warming sce-nario or season, e.g. reduced cellular FA content in response to elevated CO2 at low temperatures only, reflected as
re-duced food quality for higher trophic levels. Synergy be-tween warming and acidification may be particularly impor-tant in polar areas since a narrow thermal window generally limits cold-water organisms.
1 Introduction
High-latitude marine environments are particularly vulnera-ble to ocean acidification due to the high solubility of CO2in
cold waters (Orr et al., 2005). Therefore, the Southern Ocean has a naturally low carbonate saturation state and is believed to be one of the first oceans to become persistently undersat-urated with respect to aragonite (Orr et al., 2005; Steinacher et al., 2009). Along with elevated levels of greenhouse gases in the atmosphere, an increase in average sea surface temper-ature (SST) of 0.74◦C has been recorded from year 1906 to 2005 (IPCC, 2007). Mean SST is predicted to rise 1–4◦C by the year 2100, and the largest impacts are predicted to oc-cur in polar areas (IPCC, 2007). For instance, the summer sea ice extent in the Arctic has declined since the late 1970s, and recent models have predicted a sea-ice-free Arctic Ocean during the summer within the next 30 years (Wang and Over-land, 2009). In fact, the extent of sea ice in the Arctic reached a record low as reported in September 2012 (Parkinson and Comiso, 2013).
temperature prevent functioning of the membrane beyond the membrane lipids optimal function range (Hazel, 1995). To maintain membrane fluidity at temperatures below that of freezing seawater, sea ice algae increase the proportion of unsaturated fatty acids. For instance, Teoh et al. (2004) re-ported a significant decrease in polyunsaturated fatty acids (PUFA) at temperatures above 4◦C in an Antarctic strain of Navicula sp. In addition, cellular fatty acid (FA) composi-tion and nutrient stoichiometry can be directly related to the food quality transferred to higher trophic levels and may be negatively affected by ocean acidification (Riebesell et al., 2000; Rossoll et al., 2012; Schoo et al., 2013). However little is known about the combined effects of ocean acidification and warming on microalgal lipid FA composition.
Sea ice plays an important role in carbon biogeochemistry, both in terms of physiochemical and biological processes. Algae, in particular diatoms, inhabiting the bottom part of sea ice and brine channels contribute significantly to the primary production in ice-covered polar areas and provide a substan-tial carbon source to higher trophic levels. During spring, the early development of bottom ice algae is very impor-tant for grazers, as bottom ice algae are abundant and contain high levels of PUFA compared to phytoplankton. The peak in bottom ice algal biomass occurs before the ice edge bloom. Hence, the bottom ice algal community may act as a signifi-cant seeding population to the pelagic bloom when dispersed in the marginal ice zone (see Lizotte, 2001). The timing is crucial and a mismatch due to a changing climate could have serious consequences for organisms higher in the food web (Hoegh-Guldberg and Bruno, 2010). Moreover, the physio-chemical properties of sea ice, e.g. salinity, partial pressure of CO2 (pCO2), vary substantially during the season.
Dur-ing freezDur-ing,pCO2 is higher compared to the surrounding
seawater due to concentration of solutes, CaCO3
precipita-tion and microbial respiraprecipita-tion. As the ice becomes warmer and more permeable to liquids, the conditions can be similar to the surrounding seawater and atmosphere (Geilfus et al., 2012). However, during intense ice algal growth the fugacity of carbon dioxide (fCO2)can be<100 µatm (Fransson et
al., 2011; Geilfus et al., 2012). Hence, the temporal variation ofpCO2in sea ice is generally higher compared to the
sur-rounding seawater, althoughpCO2in brine can be similar to
the atmosphere during the growing season of the bottom ice algal community.
Below the optimum temperature, phytoplankton tend to exhibit elevated growth rates in warmer temperatures within their thermal window (Eppley, 1972). More specifically for polar algae, minor temperature elevations tend to favor psy-chrophilic pennate diatom species, with optimum growth temperature usually reported around 4–5◦C (Fiala and Oriol, 1990). In general, optimal photosynthetic activity and growth of psychrophilic algae often occurs at temperatures above natural conditions (Fiala and Oriol, 1990). In addition, both positive, negative and no responses to increasedpCO2have
been reported in marine diatoms (Wu et al., 2010; Boelen
et al., 2011; Torstensson et al., 2012). The combination of increased pCO2 and alteration of additional environmental
factors (e.g. radiation) complicates the response and could explain the species-specific responses (Gao et al., 2012; Li et al., 2012). Many laboratory studies are performed at, or close to, the optimal growth temperature, rather than at ambient conditions. If temperature andpCO2act synergistically, the
interpretation of experiments performed at optimal growth could be ambiguous in terms of global change.
Antarctic sea ice algae exhibit a widespread occurrence of carbon concentrating mechanisms (CCMs) to assist carbon fixation in photosynthesis when CO2 is limited (Tortell et
al., 2013). CCMs are an evolutionary response to the change of atmospheric gases over geological time, where the ratio of O2 and CO2 has increased (Giordano et al., 2005).
Car-bonic anhydrase (CA) is a major CCM, catalysing the re-versible dehydration of HCO−
3 into CO2 externally at the
surface of algal cells (CAext), or internally in the cell at
the site of carbon fixation (CAint)(Morant-Manceau et al.,
2007; Hopkinson et al., 2011). Studies suggest that CA ac-tivity in diatoms is costly and is induced at low levels of
pCO2in order to maintain photosynthetic activity at
differ-entpCO2(Burkhardt et al., 2001). Hence, the efficiency of
CCMs needs to be further addressed, as they will play an important role in determining the success of different pho-toautotrophs in a high-CO2world.
To understand the effects of climate change, combined ef-fects of different stressors need to be addressed. Since tem-perature and CO2 concentration play an important role in
microalgal physiology, there is great potential for synergism between these two environmental stressors. The goal of this investigation was to evaluate potential synergism between el-evatedpCO2and temperature on the ecophysiology of a sea
ice diatom and relate the response to its optimal growth tem-perature. This was performed during two laboratory pertur-bation experiments. In Experiment A, the physiology of the Antarctic sea ice diatomNitzschia lecointeivan Heurck 1909 was examined after being exposed to a worst-case scenario of elevated SST and increasedpCO2by year 2100. In
Experi-ment B, we addressed the optimal growth temperature ofN. lecointeiin order to relate the response of CO2enrichment to
its temperature optimum.
2 Material and methods
2.1 Experimental set-up
The diatom N. lecointei was isolated from sea ice from the Amundsen Sea (January 2011) and cultivated in f/2
and pCO2 by the year 2100 (IPCC, 2007).
Experimen-tal treatments were set up using flasks and bubbling sys-tem as in Torstensson et al. (2012). The sys-temperature treat-ments (−1.8±0.2◦C and 2.5±0.2◦C) were maintained us-ing two identical coolus-ing and circulatus-ing water baths (Het-ofrig, Birkerød, Denmark) containing a mix of MilliQ water and transparent ethylene glycol. At day 0 of the experiment, the stock culture ofN. lecointei was inoculated (1.6×10⁶ cells L−1) in 220 mL batch cultures containingf/2 medium with silica, prepared from 0.2 µm filtered Antarctic seawa-ter (salinity 33). Quadruplicated cultures were constantly bubbled (∼6 mL min−1flask−1)with synthetic air prepared
with two different pCO2 levels (390 and 960 µatm, Air
Liquide, Malmö, Sweden) within each temperature treat-ment. The constant bubbling created agitation in the cul-ture. Estimated time to shift and settle a new equilibrium of the carbonate system was three days in previous exper-iments (unpublished data) using the set-up by Torstensson et al. (2012), providing a gradual alteration and possibil-ity to algal acclimation. In addition, four separate repli-cates were used for initial measurements. One control (f/2
medium without diatoms) per treatment combination was used to monitor the carbonate system in absence ofN. lecoin-tei(i.e. alkalinity perturbation and carbon uptake).
A second experiment (Experiment B) was set up to in-vestigate the optimal growth temperature of N. lecointei. At day 0 of the experiment, the stock culture ofN. lecoin-tei was inoculated (5.2×10⁵ cells L−1) in 360 mL batch
cultures containingf/2 medium with silica prepared from
0.2 µm filtered Antarctic seawater (salinity 33). Water baths equipped with cooling and circulation provided four temper-ature treatments, ranging from−2.3–8.4◦C (−2.3±0.3◦C, 2.4±0.7◦C, 5.1±0.1◦C and 8.4±0.1◦C), where five borosilicate culture flasks were deployed in each bath. The water baths were filled with a mix of MilliQ water and colourless ethylene glycol. To prevent carbon limitation and create agitation, the flasks were constantly bubbled with air.
In Experiment A and B, the irradiance was provided from Osram Lumilux Cool Daylight L36W/865 tubes, with a tosynthetic active radiation (PAR) irradiance at 25 µmol pho-tons m−2s−1(light: dark cycle 23:1), corresponding to an irradiance within sea ice at high latitudes. The light intensity was not limiting according to the light saturation point (Ek)
as measured with rapid light curves using Water-PAM (see below). Temperatures in the water baths were monitored us-ing temperature loggers (HOBO Pendant, Onset Computer Corporation, Pocasset, USA). Sampling was performed on day 0 and day 14 in both experiments.
2.2 Carbonate system
pH was measured at the total scale (pHT) using the
spectrophotometric method with m-cresol purple indicator
(Clayton and Byrne, 1993). For this, 3 mL of sample was carefully transferred into a 10.00 mm cuvette and 30 µLm
-cresol purple was added. The temperature of the sample was immediately measured using a thermistor (A Precision, Ama-Digit ad 15th, Amarell GmbH & Co. KG, Kreuzw-ertheim, Germany). The pHTwas determined using the
cal-culations of Clayton and Byrne (1993).
Total alkalinity (AT)was measured potentiometrically
us-ing an automatic titration system (Metrohm 888 Titrando, Metrohm Aquatrode Plus Pt1000). Samples were stored in darkness at 3◦C until analysis within 24 h. Between 35 and 40 g of sample was weighed and titrated with 0.05 M HCl and the Gran equivalence point was determined according to Har-aldsson et al. (1997). For corrections ofAT, a certified
refer-ence material (CRM) from Scripps Institution of Oceanog-raphy, CA, USA, was titrated in triplicates prior to titration of samples. The variation within triplicates was 0.5 % of the averageAT.
The carbonate system (pCO2, [HCO−3], [CO23−] and
[CO2]) was described using the chemical speciation program
CO2SYS (Pierrot et al., 2006) with measured values of pHT,
AT, salinity and in situ temperature. The dissociation
con-stants for carbonic acid,K1andK2used in calculations were
determined by Mehrbach et al. (1973) and refitted by Dick-son and Millero (1987). The dissociation constant for SO− 4
was determined by Dickson (1990).
2.3 Photosynthetic activity
The maximum quantum yield of photosystem II (Fv/Fm) was
measured by pulse amplitude modulation (PAM) fluorome-try, using a Water-PAM (Universal control unit, Water-ED/B, Walz Mess- und Reigeltechnik, Effeltrich, Germany). For each measurement, 4 mL of well-mixed sample was dark-adapted at experimental temperature for 15 min. After dark adaptation, minimum fluorescence (F0) was determined by
applying a low level of light and the maximum fluorescence (Fm) by exposing the sample to a short saturation pulse of
measuring light (>3000 µmol photons m−2 s−1 for 0.8 s).
Variable fluorescence (Fv=Fm−F0) and maximum
quan-tum yield (Fv/Fm) were determined for all samples. 2.4 Growth rate
Cell count samples were preserved in 2.5 % (final concen-tration) glutaraldehyde and kept dark at 7◦C until analyses. Counting was performed using a BD FACSCalibur flow cy-tometer (BD Biosciences, San Jose, CA, USA). For flow es-timation, 1.0 µm ultrasonicated FluoSpheres (Invitrogen, Eu-gene, OR, USA) were used as an internal standard. The Flu-oSphere concentration was calibrated against TruCount ab-solute counting beads (BD Biosciences, San Jose, CA, USA) in triplicated runs. Samples were analysed until a minimum of 300 cells were counted. Specific growth rate (µ) was
cal-culated using Eq. (1):
µ=lnDx−lnD0
tx−t0
whereDx is the cell concentration at dayx,D0 is the cell
concentration at day 0,txis the time in days at dayx andt0 is the time in days at day 0.
2.5 Primary productivity
Total primary productivity, i.e. without separating particu-late and dissolved carbon productivity, was measured us-ing the radiocarbon technique (Aertebjerg and Bresta, 1984). For this, 10 mL of sample was incubated for 1 h with 3 µCi H14CO−
3 (PerkinElmer, Inc., Waltham, MA, USA) at
exper-imental irradiance and temperature in 20 mL glass scintilla-tion vials. One blank from each treatment was wrapped in tin foil for incubation in darkness. After the incubation, 200 µL of formaldehyde was added to all samples to stop the carbon uptake. Two drops of 1 M HCl were added and the samples were bubbled with N2for 1 h to remove the remaining DIC.
10 mL of Insta-Gel Plus (PerklinElmer, Inc., Waltham, MA, USA) scintillation cocktail was added to samples and vials were shaken rigorously. Primary productivity was measured by counting ionizing radiation from the decay of14C, in a liquid scintillation counter (Packard Tri-Carb 2900TR Liq-uid Scintillation Analyzer). Carbon uptake was corrected for dark uptake and estimated using Eq. (2):
12C=14CS×12CA×1.06
14CA×t , (2)
where12C is the carbon uptake rate (mg C L−1h−1),14C S
is the radioactive activity (DPM) in the sample,12C Ais the
available DIC (mg L−1), 1.06 is a constant adjusting the fix-ation rate due to the discriminfix-ation of14C during carbon
fix-ation,14C
Ais the added activity of14C to the sample (DPM)
andt is the incubation time (h). Carbon uptake was
normal-ized to cell concentrations.
During the14C measurements, additional incubations of
each sample were prepared with addition of the CA-inhibitor acetazolamide (AZ, final concentration 400 µM) (Alfa Aesar GmbH & Co KG, Karlsruhe, Germany). Concentration of inhibitor was chosen after optimization using other diatom species (Morant-Manceau et al., 2007). CA inhibition was determined as the relative difference in primary productivity between untreated and AZ-treated cells.
2.6 Glycerolipid fatty acid composition
For fatty acid analysis, 40 mL of sample was filtered onto pre-combusted (400◦C, 4 h) GF/F filters. Filters were im-mediately flash-frozen in liquid nitrogen and transferred to −80◦C until extraction. A total lipid extract was obtained from the filters. The filters were submerged in boiling iso-propanol for 5 min and dried under a stream of N2. Total
lipids were extracted in chloroform:methanol:water (1:2: 0.8, by volume) as described in Andersson et al. (2006). The
total lipid extract was subjected to alkaline transesterification (Christie, 1976) and analysed by gas chromatography-mass
spectrometry (GC-MS) using an Agilent 7820 GC coupled to an Agilent 5975 mass selective detector. Di-nonadecanoyl phosphatidylcholine was used as internal standard. The FA methyl esters were separated on a 30 m DB-23 capillary col-umn (J&W Scientific, Folsom, CA, USA) using helium as a carrier gas at a constant flow of 30 cm s−1. The oven was held
at 150◦C for 3 min and after that increased by 1◦C min−1to a final temperature of 200◦C. The injector and the detector interface were kept at 250◦C. The methyl esters were iden-tified by retention time and mass spectra compared to au-thentic lipid standards. Fatty acid methyl ester standards used were provided from Supelco; synthetic 37 component FAME mix and marine PUFA No.3 from Menhaden oil. Hereafter, the total amount of FA methyl esters is referred to as total FA and grouped by affiliation to: saturated fatty acids (SAFA), monounsaturated fatty acids (MUFA) and polyunsaturated fatty acids (PUFA).
2.7 Inorganic nutrients
For analysis 10 mL of sample was 0.2 µm filtered and stored at −20◦C until analysis of dissolved inorganic nutrients (NO−
3, NO−2, PO4 and Si). Samples were analysed at the
Sven Lovén Center for Marine Research, Kristineberg, Swe-den, using colorimetric methods according to Grasshoff et al. (1999).
2.8 Statistics
Statistical analysis of data was performed using one- and two-factor ANOVAs. To test the data for homogeneity of variances, Levene’s test was used. Student–Newman–Keuls (SNK) post-hoc analysis was performed when necessary. A probability level of <0.05 was used for statistical
signifi-cance. SuperANOVA 1.11 and SPSS 19.0 were used for sta-tistical analyses.
3 Results
3.1 Growth and photosynthesis
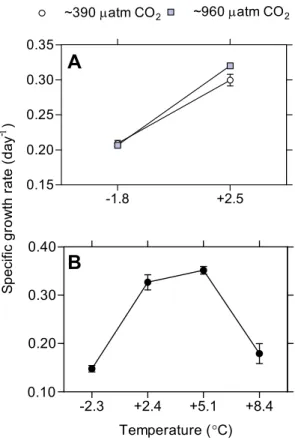
In Experiment A, an interaction between warming and rising
pCO2 was observed for specific growth rate ofN.
lecoin-tei(p <0.05; two-factor ANOVA; Fig. 1a). Growth rate
in-creased (6 %) significantly in ∼960 µatm compared to the ∼390 µatm pCO2 at 2.5◦C (Fig. 1a). However, there was
no difference in growth rate at−1.8◦C between thepCO2
treatments. After 14 days of exposure, mean cell densities at −1.8◦C were 3.1×10⁷ and 3.0×10⁷ cells L−1 in the ∼390 and∼960 µatmpCO2treatments, respectively. In the
warm treatment mean densities were 1.1×10⁸and 1.5×10⁸ cells L−1in the∼390 and∼960 µatmpCO
2treatments,
re-spectively.
-1.8 +2.5 0.15
0.20 0.25 0.30 0.35
~390matm CO2 ~960matm CO2
-2.3 +2.4 +5.1 +8.4 0.20
0.30 0.40
0.10
Temperature (°C)
A
B
S
p
ecif
ic
g
ro
w
th
r
a
te
(
d
ay
-1)
Fig. 1.Specific growth rate (day−1)during 14 days of treatment.
(A)Interaction of temperature andpCO2 in Experiment A. (n=
4)(B)Optimal growth temperature during Experiment B (n=5).
Error bars are displaying standard error.
ANOVA). The growth rate increased when temperature in-creased from the ambient up to 5.1◦C where the highest growth rate was detected. At further temperature increase, the specific growth rate declined (Fig. 1b). Growth rates were significantly differentiated between all treatments (p <0.01;
SNK test). The one factor ANOVA was performed with het-erogeneous variances due to inability of transformation, as the F-test is rather robust to heteroscedasticity in balanced designs (Underwood, 1997). At the end of the experiment mean cell density was 4.1×10⁶ cells L−1 in the −2.3◦C treatment, 5.1×10⁷cells L−1in 2.4◦C, 7.2×10⁷cells L−1 in 5.1◦C and 6.5×10⁶cells L−1in 8.4◦C.
In Experiment A,Fv/Fm(p <0.001; two-factor ANOVA;
Fig. 2) and primary productivity (p <0.001; two-factor
ANOVA; Fig. 3a) were significantly higher (9 and 50 %, re-spectively) at 2.5◦C compared to−1.8◦C. However, no in-teractions between treatments or main effects ofpCO2were
observed (p >0.05; two-factor ANOVA). One sample from
the14C-incubation was lost due to technical error. Inhibition of primary productivity was observed in 15 measurable sam-ples where AZ was added, giving a mean inhibition of 12 % (Fig. 3b). However, no significant interaction or main effects were detected (p >0.05; two-factor ANOVA).
-1.8 °C +2.5 °C 0.50
0.55 0.60 0.65
~390matm CO2 ~960matm CO2
Fv
/
F
m
Fig. 2.Maximum quantum yield (Fv/Fm)measurements after 14 days of treatment in Experiment A. Error bars are displaying
stan-dard error (n=4).
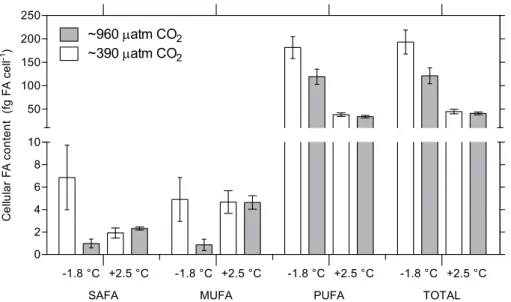
3.2 Glycerolipid fatty acid composition
There was a significant interaction between treatments for total FA content in Experiment A (p <0.05; two-factor
ANOVA; Fig. 4). At −1.8◦C, total FA content was re-duced from 193±26 (mean±standard error) to 121±17 fg FA cell−1 in the ∼960 µatm treatment compared to the ∼390 µatm treatment. However, there was no difference between the two pCO2 treatments at 2.5◦C, 45±5 and 41±3 fg FA cell−1at∼390 and∼960 µatm, respectively. No interactions were observed for cellular content of SAFA, MUFA and PUFA (p >0.05; two-factor ANOVA; Fig. 4).
However, cellular PUFA content was significantly lower (p <0.001; two-factor ANOVA) in the 2.5◦C treatment
(36±2 fg FA cell−1) compared to the −1.8◦C treatment (150±17 fg FA cell−1). Cellular PUFA content also
de-creased significantly (from 110±29 to 76±18 fg FA cell−1)
with increased pCO2 (p <0.05; two-factor ANOVA). No
significant difference in SAFA and MUFA content was de-tected between treatments (p >0.05; two-factor ANOVA).
Statistical analyses of SAFA and MUFA were executed with heterogeneous variances, due to inability of transformation.
The cellular FA content for each fatty acid is presented in Table 1. Among the FAs the omega-3 PUFAs 18:3n-3 (α-linolenic acid, ALA), 18:4n-3 (stearidonic acid, SDA) and 20:5n-3 (eicosapentaenoic acid, EPA) were dominating, representing 92 % of the total FA content at −1.8◦C (Ta-ble 1). The most common FA in all treatments was ALA. PUFAs represented on average 97 % of the total FA content at−1.8◦C (Table 1).
3.3 Experimental conditions
Measured values of pHT and AT, with additional
calcu-lated parameters from CO2SYS for [HCO−
3], [CO23−], [CO2]
and pCO2 after 14 days in Experiment A, are displayed
in Table 2. AT increased on average by 5.2 and 7.7 %
0 1 2 3 4 5
~390matm CO2 ~960matm CO2
P
rim
a
ry
p
ro
d
u
ct
ivit
y
(p
g
C
ce
ll
-1 h
-1 )
A
B
-1.8 °C +2.5 °C
0 50 100
Re
l.
P
P
w
it
h
A
Z
(
%
)
Fig. 3. (A)Primary productivity (pg C h−1cell−1)measurements
after 14 days of treatment in Experiment A.(B)Relative primary
productivity (PP) rates after addition of carbonic anhydrase in-hibitor acetazolamide (AZ). Carbon fixation is expressed in % in relation to samples incubated without inhibitor. Incubations were performed after 14 days of treatment in Experiment A. Error bars
are displaying standard error (n=4).
temperature treatments, respectively. When comparing sam-ples and blanks (0.2 µm filtered seawater) at day 14, the algae contributed with 0.8 and 2.6 % increase ofATin the−1.8 and 2.5◦C temperature treatments, respectively.
Inorganic nutrients were measured to rule out nutrient limitation. Results showed satisfying levels (Table 3), with steady values ofFv/Fmthroughout the experiments,
suggest-ing inorganic nutrients were not limitsuggest-ing growth.
4 Discussion
In this study, we report synergistic effects between temper-ature and pCO2 on growth and FA content of N.
lecoin-tei, suggesting complexity in physiological responses to cli-mate change. In the control temperature the growth rate was unaffected by pCO2. However, growth rate in the
warmer treatment was promoted by elevatedpCO2. Since
increased pCO2 in combination with warmer temperature
stimulated growth, this interaction suggests a physiological constraint in the lower temperature, makingN. lecointei un-able to utilize the extra carbon availun-able to potentially in-crease growth rate. With a warmer temperature this
con-straint seemed to diminish and growth was no longer lim-ited by temperature. The synergy between temperature and
pCO2 may be particularly important in polar areas, where
many physiological processes are limited by a narrow ther-mal window (e.g. Pörtner, 2002).
Our findings emphasize the importance of selecting a real-istic temperature when designing perturbation experiments, which may be especially important in polar organisms where temperature regulates many physiological processes. Choos-ing a temperature close to the optimum growth temperature, rather than at ambient conditions, might either over- or un-derestimate the effect of carbon enrichment due to a tem-perature dependency of the response. Earlier studies suggest that elevated temperature within the temperature range of the species increases growth rate and photosynthesis in phy-toplankton and ice algal species (Eppley, 1972; Montagnes and Franklin, 2001; Torstensson et al., 2012). Furthermore, acclimation and the ability to benefit from elevated carbon dioxide levels could be an alternative explanation to the in-teraction observed for the growth rate in this study. Since growth rate was higher in the warmer treatment, the poten-tial acclimation rate to high CO2was also higher. Although
we believe that the difference in accumulated generations in this experiment are too few to confound the results, long-term studies are crucial for understanding acclimation and adaptation to climate change.
Further synergism was detected in the FA concentration of N. lecointei. The cellular FA content in −1.8◦C was higher at ambient pCO2 compared to the elevated pCO2
treatment. Rossoll et al. (2012) also reported lower total FA content and PUFA concentration in Thalassiosira pseudo-nanagrown at highpCO2, which suggests that diatoms
re-duce their FA content in response to ocean acidification. This could have major consequences on the food quality trans-ferred to higher trophic levels (Rossoll et al., 2012). How-ever, we only observed apCO2-related decline in FA
concen-tration at−1.8◦C, suggesting that temperature in combina-tion withpCO2plays an important role in FA stoichiometry.
SAFA MUFA PUFA TOTAL 0
2 4 6 8 10 50 100 150 200 250
~960matm CO2 ~390matm CO2
-1.8 °C +2.5 °C -1.8 °C +2.5 °C -1.8 °C +2.5 °C -1.8 °C +2.5 °C
Ce
llu
la
r
F
A
c
o
n
te
n
t
(
fg
F
A
c
e
ll
-1)
Fig. 4.Cellular fatty acid content (fg FA cell−1)inN. lecointeiafter 14 days of treatment in Experiment A. SAFA=saturated fatty acids,
MUFA=monounsaturated fatty acids, PUFA=polyunsaturated fatty acids. Error bars represent standard error (n=4).
Table 1.Cellular content of acyl lipid fatty acid inN. lecointeiafter 14 days of treatment in Experiment A. Values within brackets represents
standard error (n=4).
Fatty acid Content (fg FA cell−1)
−1.8◦C 2.5◦C
∼390 µatm ∼960 µatm ∼390 µatm ∼960 µatm
16:0 2.5 (0.9) 0.6 (0.3) 1.9 (0.4) 2.0 (0.1)
16:1n-7 2.7 (1.0) 0.7 (0.5) 4.3 (0.9) 4.3 (0.4)
16:4 5.4 (1.0) 2.8 (1.5) 2.1 (0.3) 1.6 (0.4)
18:0 4.3 (2.0) 0.4 (0.1) 0.1 (0.03) 0.3 (0.1)
18:1n-9 2.3 (1.2) 0.2 (0.1) 0.4 (0.2) 0.3 (0.2)
18:2n-6 4.2 (2.7) 0.0 (0.0) 0.04 (0.03) 0.1 (0.1)
18:3n-3 101.6 (9.7) 72.5 (26.6) 25.3 (5.0) 19.4 (2.5)
18:4n-3 49.9 (24.2) 29.1 (17.4) 5.5 (2.7) 6.7 (1.0)
20:5n-3 20.3 (4.9) 14.7 (5.0) 5.3 (0.6) 5.9 (0.4)
Total 193.1 (25.8) 121.0 (16.8) 44.7 (4.89) 40.7 (2.8)
and Wangersky, 1987). However, no signs of nutrient defi-ciency were detected in this study. These findings suggest a major reduction ofN. lecointeiFA content in response to cli-mate change.
Bottom ice algae contain high amounts of FA and are an important food source for grazers in polar areas, espe-cially prior to the pelagic spring bloom. Therefore, a loss of sea ice in polar areas may seriously impact food webs due to grazer essential FA being altered, e.g. PUFA con-centration in the food may be reduced. The FA composi-tion analysis revealed high PUFA concentracomposi-tions in all treat-ments. FA composition in cultures and natural algal com-munities in polar oceans have shown PUFA proportions of approximately 20–60 % of the total FA content (Fahl and Kattner, 1993; Falk-Petersen et al., 1998; Teoh et al., 2004; Leu et al., 2006). However, PUFA inN. lectoneirepresented
94–98 % of the FAs at −1.8◦C. Significantly lower PUFA proportions were measured at 2.5◦C; 81.5 % at∼390 µatm and 84.5 % at∼960 µatmpCO2, reflecting the importance
of PUFA as a cold adaption and illustrating the ecologi-cal role of N. lectonei, as it is considered a high-quality food source for grazers.
The level of carbon dioxide also appears to alter FA con-tent under certain temperature conditions in N. lecointei. Rossoll et al. (2012) showed a similar decrease in PUFA con-centration, at the expense of increasing SAFA, as a result of elevated carbon levels. The authors also observed a decline in total FA content at highpCO2. The results from the
lat-ter and present studies are somewhat consistent. However, no alteration of SAFA and MUFA content was detected in N. lecointei, and the response ofpCO2 appeared
Table 2.Measured and calculated mean values of pHT,AT, [HCO−3], [CO32−], [CO2] andpCO2with CO2SYS at initial measurements
(before aeration of the medium) and after 14 days of treatment in Experiment A. Values within brackets represents standard error (n=4).
Initial Treatment
−1.8◦C 2.5◦C
∼390 µatm ∼960 µatm ∼390 µatm ∼960 µatm
pHT 8.386 (0.017) 8.040 (0.004) 7.816 (0.018) 8.059 (0.019) 7.828 (0.024)
AT(µmol kg−1) 2332 (7) 2448 (3) 2459 (13) 2506 (9) 2519 (5)
[HCO−
3] (µmol kg−1) 1840 (21) 2231 (4) 2323 (11) 2234 (11) 2349 (7)
[CO2−
3 ] (µmol kg−1) 199 (6) 87 (1) 54 (2) 111 (4) 69 (4)
[CO2] (µmol kg−1) 9 (0.5) 28 (0.3) 49 (2) 24 (1) 43 (2)
pCO2(µatm) 162 (8) 408 (4) 713 (29) 416 (20) 746 (42)
Table 3.Inorganic nutrient concentration after 14 days in Experiment A and B.
Experiment Treatment Concentration (µmol L−1)
Temperature (◦C)
pCO2(µatm) NO−3/NO−2 PO4 SiO2
A −1.8 ∼390 254 4.3 87
−1.8 ∼960 357 8.5 103
2.5 ∼390 408 7.4 108
2.5 ∼960 341 6.6 79
B −2.3 N/A 231 5.1 89
2.4 N/A 358 6.8 96
5.1 N/A 410 8.4 118
8.4 N/A 444 7.7 132
ofN. lecointeiat low temperature, while an increasedpCO2
lead to deterioration of FA content.
The PUFA present in the samples were mainly omega-3 PUFA, however, in three out of four treatments a small frac-tion (<2 %) of non-omega-3 PUFA, 18 : 2n-6 (linoleic acid,
LA), was also found. Zhang et al. (2011) showed a relation-ship between decreasing temperature and increasing activ-ity of an omega-3 FA desaturase in a psychrophilic strain of Chlamydomonassp., suggesting a correlation between desat-urase activity and the shift from 18:2 PUFA to 18:3 PUFA. Mayzaud et al. (2013) demonstrated that increasing temper-atures decreased the amount of omega-3 PUFA in natural blooming phytoplankton in an Arctic fjord. Loss of PUFA results in reduced food quality for organisms grazing on primary producers, and may have serious ecological conse-quences. Rossoll et al. (2012) showed a major decrease in so-matic growth and egg production in grazing copepods (Acar-tia tonsa),as a response to deteriorated food quality from
T. pseudonanagrown at highpCO2. This type of event may
have significant effects throughout the food web. It is sug-gested that poor food quality in copepods and amphipods is negatively correlated with breeding performance in marine bird species in polar areas. Studies performed in the Arc-tic show changed foraging patterns in Little auks (Alle alle) due to a lack of energy-rich prey near breeding sites, result-ing in decreased reproductive success (Steen et al., 2007).
In addition to reduced food quality, an alteration in FA con-tent at subzero temperatures could also affect the ability of N. lecointeito tolerate low temperature stress due to reduced membrane fluidity. An alteration in FA composition in the foundation of the food web may have severe consequences at higher trophic levels. However, few ocean acidification stud-ies have so far focused on trophic transfer in the ecosystem.
growth rate was still 17 % higher than at −1.8◦C. How-ever, psychrophilic bottom ice algae likeN. lecointeiwill be negatively affected by further temperature increase (data not shown). The primary productivity andFv/Fm of N. lecoin-tei increased with elevated temperature in Experiment A. Kennedy et al. (2012) observed highestFv/Fmin the warmest
part of sea ice, around −2◦C, close to the ice/water inter-face, while the lowest level was measured in the coldest part, around−6◦C, at the top of the ice. Ralph et al. (2005) stud-ied brine channel communities dominated by diatoms and showed similar results, i.e. the photosynthetic performance was higher at−1.8◦C than at −10◦C. Hence, the pattern with warmer temperature and higher photosynthetic perfor-mance, which is also shown forN. lecointei in this study, continues in temperatures below−1.8◦C.
Energy savings from down-regulation of CCMs are sug-gested to increase carbon fixation in phytoplankton, when sufficient levels of carbon are achieved without the use of energy-consuming CCMs (Raven, 1991; Hopkinson et al., 2011). However, the physiological responses to ocean acid-ification in diatoms tend to be very species-specific (Wu et al., 2010; Boelen et al., 2011; Torstensson et al., 2012). The growth rate of T. pseudonana was unaffected by elevated
pCO2, even though CCMs were down-regulated and
pho-tosynthesis up-regulated (Yang and Gao, 2012). This obser-vation was explained by an increased rate of mitochondrial respiration. In our study, primary productivity was reduced in 15 measurable samples that were treated with the CA in-hibitor AZ. The inhibition was of the same magnitude in all treatments, suggesting thatN. lecointeihas the same require-ment of carbon regardless of treatrequire-ment level, i.e.N. lecointei may already be saturated in carbon at the ambient pCO2.
Nevertheless, this shows that CA as a CCM is present inN. lecointeiand that it provides for at least 12 % of the carbon assimilation, which is a substantial part of the total carbon uptake. However, since inhibition of CA is species-specific and depends on the concentration of the inhibitor (Morant-Manceau et al., 2007), 12 % might be an underestimation.
Bottom ice algae play an important role as a food source for grazers in the early season and as seeding populations to the pelagic spring bloom. An elevated SST would change the distribution of sea ice and could result in an ice free summer, as is predicted for the Arctic within the next 30 yr (Wang and Overland, 2009). This might affect organisms dependent on bottom ice algae more than the microalgae themselves, since the microalgae nevertheless end up in the water column dur-ing the meltdur-ing season. The upper and middle sections of the sea ice would in a warming scenario become less cold in gen-eral during the season, resulting in more porous sea ice with less saline brine. However, during formation of sea ice lev-els of dissolved carbon dioxide increase, as the water freezes and the solutes become more concentrated within the non-frozen brine channel matrix. Nonetheless, during spring and summer measured levels offCO2were below ambient
atmo-spheric level (Fransson et al., 2011), indicating that increased
levels of dissolved carbon dioxide in brine are not as elevated as they may be during formation. This suggests that the tem-poral variation ofpCO2in brine is quite high compared to
the surrounding seawater (Geilfus et al., 2012). However, the
pCO2 treatments in this study are still considered relevant
to conditions in the ice when the bottom ice algae are start-ing to grow. Nevertheless, it will be important to consider the natural variability ofpCO2, especially when modelling the
results from ocean acidification experiments.
We hereby suggest that pCO2 and temperature can act
synergistically to promote growth rate and affect the FA com-position of sea ice diatoms. We also emphasize that the tem-perature optimum must be considered when assessing phys-iological effects of ocean acidification on photoautotrophs. Hence, the growth effects ofpCO2may be more pronounced
closer to the optimal temperature of the species, although this temperature is generally higher than ambient conditions. However, the gap between optimal and ambient SST will probably be reduced during a future ocean warming event and this must be considered when assessing results from ocean acidification perturbation experiments.
Acknowledgements. This study was financed by the Swedish
Research Council (VR Project No. 2007-8365) and Lindhes Ad-vokatbyrå AB foundation. We would like to thank A. Al-Handal for species identification.
Edited by: U. Riebesell
References
Aertebjerg, G. and Bresta, A. M.: Guidelines for the measurement of phytoplankton primary production, 2nd Edn., Baltic Marine Biologists Publication No. 1., 1984.
Andersson, M. X., Kourtchenko, O., Dangl, J. L., Mackey, D., and Ellerström, M.: Phospholipase-dependent signalling during the AvrRpm1- and AvrRpt2-induced disease resistance responses in
Arabidopsis thaliana, Plant J., 47, 947–959, 2006.
Boelen, P., van de Poll, W. H., van der Strate, H. J., Neven, I. A., Beardall, J., and Buma, A. G. J.: Neither elevated nor reduced
CO2affects the photophysiological performance of the marine
Antarctic diatomChaetoceros brevis, J. Exp. Mar. Biol. Ecol.,
406, 38–45, 2011.
Burkhardt, S., Amoroso, G., Riebesell, U., and Sültemeyer, D.: CO2
and HCO−
3 uptake in marine diatoms acclimated to different CO2
concentrations, Limnol. Oceanogr., 46, 1378–1391, 2001. Christie, W. W.: Lipid analysis: isolation, separation, identification
and structural analysis of lipids, Pergamon Press, Oxford, 1976. Clayton, T. D. and Byrne, R. H.: Spectrophotometric seawater pH
measurements: total hydrogen ion concentration scale calibration
ofm-cresol purple and at-sea results, Deep Sea Res. Pt. I, 40,
2115–2129, 1993.
Dickson, A. G.: Standard potential of the reaction:
AgCl(s)+OH2(g)=Ag(s)+HCl(aq), and the standard acidity
constant of the ion HSO4in synthetic seawater from 273.15 to
Dickson, A. G. and Millero, F. J.: A comparison of the equilibrium constants for the dissociation of carbonic acid in seawater media, Deep Sea Res. Pt. I, 34, 1733–1743, 1987.
Eppley, R. W.: Temperature and phytoplankton growth in the sea, Fish. Bull., 70, 1063–1085, 1972.
Fahl, K. and Kattner, G.: Lipid Content and fatty acid composition of algal communities in sea-ice and water from the Weddell Sea (Antarctica), Polar Biol., 13, 405–409, 1993.
Falk-Petersen, S., Sargent, J. R., Henderson, J., Hegseth, E. N., Hop, H., and Okolodkov, Y. B.: Lipids and fatty acids in ice algae and phytoplankton from the Marginal Ice Zone in the Barents Sea, Polar Biol., 20, 41–47, 1998.
Fiala, M. and Oriol, L.: Light-temperature interactions on the growth of Antarctic diatoms, Polar Biol., 10, 629–636, 1990. Fransson, A., Chierici, M., Yager, P. L., and Smith, W. O.: Antarctic
sea ice carbon dioxide system and controls, J. Geophys. Res.-Oceans, 116, C12035, doi:10.11029/12010JC006844, 2011. Gao, K., Xu, J., Gao, G., Li, Y., Hutchins, D. A., Huang, B., Wang,
L., Zheng, Y., Jin, P., Cai, X., Hader, D.-P., Li, W., Xu, K., Liu,
N., and Riebesell, U.: Rising CO2and increased light exposure
synergistically reduce marine primary productivity, Nat. Clim. Change, 2, 519–523, 2012.
Geilfus, N. X., Carnat, G., Papakyriakou, T., Tison, J. L., Else, B.,
Thomas, H., Shadwick, E., and Delille, B.: Dynamics ofpCO2
and related air-ice CO2fluxes in the Arctic coastal zone
(Amund-sen Gulf, Beaufort Sea), J. Geophys. Res.-Oceans, 117, C00G10, doi:10.1029/2011JC007118, 2012.
Giordano, M., Beardall, J., and Raven, J. A.: CO2Concentrating
mechanisms in algae: Mechanisms, Environmental Modulation, and Evolution, Annu. Rev. Plant Biol., 56, 99–131, 2005. Grasshoff, K., Kremling, K., and Ehrhardt, M.: Methods of seawater
analysis, 3rd ed., Wiley-VHC, Weinheim, 1999.
Guillard, R. R. L.: Culture of phytoplankton for feeding marine in-vertebrates, in: Culture of marine invertebrate animals, edited by: Smith, W. L., and Chanley, M. H., Plenum, New York, 29–60, 1975.
Haraldsson, C., Anderson, L. G., Hassellöv, M., Hulth, S., and Ols-son, K.: Rapid, high-precision potentiometric titration of alkalin-ity in the ocean and sediment pore waters, Deep Sea Res. Pt. I, 44, 2031–2044, 1997.
Hazel, J. R.: Thermal Adaptation in Biological Membranes: Is Homeoviscous Adaptation the Explanation?, Annu. Rev. Phys-iol., 57, 19–42, 1995.
Hoegh-Guldberg, O. and Bruno, J. F.: The Impact of Climate Change on the World’s Marine Ecosystems, Science, 328, 1523– 1528, 2010.
Hopkinson, B. M., Dupont, C. L., Allen, A. E., and Morel, F. M.
M.: Efficiency of the CO2-concentrating mechanism of diatoms,
Proc. Natl. Acad. Sci., 108, 3830–3837, 2011.
IPCC: Climate Change 2007: The Physical Science Basis, in: 4th assessment report, edited by: Solomon, S., Qin, D., Manning, M., Chen, Z., Marquis, M., Averyt, K. B., Tignor, M., and Miller, H. L., Cambridge University Press, Cambridge, 789–797, 2007. Kennedy, F., McMinn, A., and Martin, A.: Effect of temperature
on the photosynthetic efficiency and morphotype ofPhaeocystis
antarctica, J. Exp. Mar. Biol. Ecol., 429, 7–14, 2012.
Leu, E., Wängberg, S.-Å., Wulff, A., Falk-Petersen, S., Ørbæk, J. B., and Hessen, D. O.: Effects of changes in ambient PAR and
UV radiation on the nutritional quality of an Arctic diatom (
Tha-lassiosira antarcticavar.borealis), J. Exp. Mar. Biol. Ecol., 337,
65–81, 2006.
Li, Y., Gao, K., Villafañe, V. E., and Helbling, E. W.: Ocean acidification mediates photosynthetic response to UV radiation and temperature increase in the diatom Phaeodactylum tricor-nutum, Biogeosciences, 9, 3931–3942, doi:10.5194/bg-9-3931-2012, 2012.
Lizotte, M. P.: The contributions of sea ice algae to Antarctic marine primary production, Am. Zool., 41, 57–73, 2001.
Longhi, M. L., Schloss, I. R., and Wiencke, C.: Effect of irradiance and temperature on photosynthesis and growth of two Antarctic
benthic diatoms,Gyrosigma subsalinumandOdontella litigiosa,
Bot. Mar., 46, 276–284, 2003.
Mayzaud, P., Boutoute, M., Noyon, M., Narcy, F., and Gasparini, S.: Lipid and fatty acids in naturally occurring particulate matter during spring and summer in a high arctic fjord (Kongsfjorden, Svalbard), Mar. Biol., 160, 383–398, 2013.
Mehrbach, C., Culberson, C. H., Hawley, J. E., and Pytkow-icz, R. M.: Measurement of the apparent dissociation constants of carbonic acid in seawater at atmospheric pressure, Limnol. Oceanogr., 18, 897–907, 1973.
Montagnes, D. J. S. and Franklin, D. J.: Effect of temperature on diatom volume, growth rate, and carbon and nitrogen content: Reconsidering some paradigms, Limnol. Oceanogr., 46, 2008– 2018, 2001.
Morant-Manceau, A., Nguyen, T. L. N., Pradier, E., and Tremblin, G.: Carbonic anhydrase activity and photosynthesis in marine di-atoms, Eur. J. Phycol., 42, 263–270, 2007.
Orr, J. C., Fabry, V. J., Aumont, O., Bopp, L., Doney, S. C., Feely, R. A., Gnanadesikan, A., Gruber, N., Ishida, A., Joos, F., Key, R. M., Lindsay, K., Maier-Reimer, E., Matear, R., Monfray, P., Mouchet, A., Najjar, R. G., Plattner, G.-K., Rodgers, K. B., Sabine, C. L., Sarmiento, J. L., Schlitzer, R., Slater, R. D., Totterdell, I. J., Weirig, M.-F., Yamanaka, Y., and Yool, A.: Anthropogenic ocean acidification over the twenty-first century and its impact on cal-cifying organisms, Nature, 437, 681–686, 2005.
Parkinson, C. L. and Comiso, J. C.: On the 2012 record low Arctic sea ice cover: Combined impact of preconditioning and an Au-gust storm, Geophys. Res. Lett., 40, 1356–1361, 2013.
Parrish, C. C. and Wangersky, P. J.: Particulate and dissolved lipid
classes in cultures ofPhaeodactylum tricornutumgrown in cage
culture turbidostats with a rage of nitrogen supply rates, Mar. Ecol. Prog. Ser., 35, 119–128, 1987.
Petit, J. R., Jouzel, J., Raynaud, D., Barkov, N. I., Barnola, J. M., Basile, I., Bender, M., Chappellaz, J., Davis, M., Delaygue, G., Delmotte, M., Kotlyakov, V. M., Legrand, M., Lipenkov, V. Y., Lorius, C., Pepin, L., Ritz, C., Saltzman, E., and Stievenard, M.: Climate and atmospheric history of the past 420,000 years from the Vostok ice core, Antarctica, Nature, 399, 429–436, 1999. Pierrot, D., Lewis, E., and Wallace, D. W. R.: MS Excel Program
Developed for CO2 System Calculations, in,
ORNL/CDIAC-105a. Carbon Dioxide Information Analysis Center, Oak Ridge National Laboratory, U.S. Department of Energy, Oak Ridge, Tennessee, 2006.
Pörtner, H. O.: Physiological basis of temperature-dependent bio-geography: trade-offs in muscle design and performance in polar ectotherms, J. Exp. Biol., 205, 2217–2230, 2002.
from the surface layers of Antarctic pack ice, J. Phycol., 41, 763– 769, 2005.
Raven, J. A.: Physiology of inorganic C acquisition and implica-tions for resource use efficiency by marine phytoplankton:
rela-tion to increased CO2and temperature, Plant, Cell Environ., 14,
779–794, 1991.
Riebesell, U., Revill, A. T., Holdsworth, D. G., and Volkman, J. K.:
The effects of varying CO2concentration on lipid composition
and carbon isotope fractionation inEmiliania huxleyi, Geochim.
Cosmochim. Acta, 64, 4179–4192, 2000.
Rossoll, D., Bermúdez, R., Hauss, H., Schulz, K. G., Riebesell, U., Sommer, U., and Winder, M.: Ocean acidification-induced food quality deterioration constrains trophic transfer, PLoS ONE, 7, E34737, doi:10.31371/journal.pone.0034737, 2012.
Schoo, K., Malzahn, A., Krause, E., and Boersma, M.: Increased carbon dioxide availability alters phytoplankton stoichiometry and affects carbon cycling and growth of a marine planktonic herbivore, Mar. Biol., 160, 2145–2155, 2013.
Smith, A. E. and Morris, I.: Pathways of carbon assimilation in phytoplankton from the Antarctic Ocean, Limnol. Oceanogr., 25, 865–872, 1980.
Somero, G. N.: The Physiology of Global Change: Linking Patterns to Mechanisms, Annu. Rev. Marine Sci., 4, 39–61, 2012. Steen, H., Vogedes, D., Broms, F., Falk-Petersen, S., and Berge, J.:
Little auks (Alle alle) breeding in a High Arctic fjord system:
bimodal foraging strategies as a response to poor food quality?, Polar Res., 26, 118–125, 2007.
Steinacher, M., Joos, F., Frölicher, T. L., Plattner, G.-K., and Doney, S. C.: Imminent ocean acidification in the Arctic projected with the NCAR global coupled carbon cycle-climate model, Biogeo-sciences, 6, 515–533, doi:10.5194/bg-6-515-2009, 2009.
Teoh, M.-L., Chu, W.-L., Marchant, H., and Phang, S.-M.: Influence of culture temperature on the growth, biochemical composition and fatty acid profiles of six Antarctic microalgae, J. Appl. Phy-col., 16, 421–430, 2004.
Torstensson, A., Chierici, M., and Wulff, A.: The influence of in-creased temperature and carbon dioxide levels on the benthic/sea
ice diatomNavicula directa, Polar Biol., 35, 205–214, 2012.
Tortell, P. D., Mills, M. M., Payne, C. D., Maldonado, M. T., Chierici, M., Fransson, A., Alderkamp, A. C., and Arrigo, K. R.: Inorganic C utilization and C isotope fractionation by pelagic and sea ice algal assemblages along the Antarctic continental shelf, Mar. Ecol. Prog. Ser., 483, 47–66, 2013.
Underwood, A. J.: Experiments in Ecology, Cambridge University Press, Cambridge, 1997.
Wang, M. and Overland, J. E.: A sea ice free summer Arc-tic within 30 years?, Geophys. Res. Lett., 36, L07502, doi:07510.01029/02009GL037820, 2009.
Wu, Y., Gao, K., and Riebesell, U.: CO2-induced seawater
acid-ification affects physiological performance of the marine di-atom Phaeodactylum tricornutum, Biogeosciences, 7, 2915–
2923, doi:10.5194/bg-7-2915-2010, 2010.
Yang, G. and Gao, K.: Physiological responses of the marine diatom
Thalassiosira pseudonanato increasedpCO2and seawater acid-ity, Mar. Environ. Res., 79, 142–151, 2012.
![Table 2. Measured and calculated mean values of pH T , A T , [HCO − 3 ], [CO 2 3 − ], [CO 2 ] and pCO 2 with CO2SYS at initial measurements (before aeration of the medium) and after 14 days of treatment in Experiment A](https://thumb-eu.123doks.com/thumbv2/123dok_br/17198541.242717/8.892.150.742.146.326/table-measured-calculated-initial-measurements-aeration-treatment-experiment.webp)
