Flow cytometry allows multiparametric analysis of cell morphological features, interactions between cel-lular molecules and qualitative and quantitative evalu-ation of environmental microbial composition directly in analysed material and without the need to proceed with cultivation step. Flow cytometer measures sus-pended cells and particles fl owing through the fl ow
cell (fl ow chamber). The cells from analysed
suspen-sion, converted into fl uid stream, are being scanned
by intercepting laser beam as they pass through the observation point (interrogation point). The measured parameters are laser light scatter and emission of light of fl uorochromes (fl uorescence) excited by laser beam [Shapiro 2003]. Flow cytometer enables the
simulta-neous measurement of fl uorescence emission intensity
(coming from excited fl uorochromes tagging directly
specifi c cell structure or conjugated with antibodies or lectins) and laser light scattered on suspended cells.
FLOW CYTOMETRIC ANALYSIS OF MICROBIAL CONTAMINATION
IN FOOD INDUSTRY TECHNOLOGICAL LINES – INITIAL STUDY
Wojciech Juzwa
, Katarzyna Czaczyk
Department of Biotechnology and Food Microbiology, Poznań University of Life Sciences Wojska Polskiego 28, 60-627 Poznań, Poland
ABSTRACT
Background. Flow cytometry constitutes an alternative for traditional methods of microorganisms
iden-tifi cation and analysis, including methods requiring cultivation step. It enables the detection of pathogens
and other microorganisms contaminants without the need to culture microbial cells meaning that the sample
(water, waste or food e.g. milk, wine, beer) may be analysed directly. This leads to a signifi cant reduction
of time required for analysis allowing monitoring of production processes and immediate reaction in case of contamination or any disruption occurs. Apart from the analysis of raw materials or products on
differ-ent stages of manufacturing process, the fl ow cytometry seems to constitute an ideal tool for the assessment
of microbial contamination on the surface of technological lines.
Material and methods. In the present work samples comprising smears from 3 different surfaces of techno-logical lines from fruit and vegetable processing company from Greater Poland were analysed directly with
fl ow cytometer. The measured parameters were forward and side scatter of laser light signals allowing the
estimation of microbial cell contents in each sample.
Results. Flow cytometric analysis of the surface of food industry production lines enable the preliminary evaluation of microbial contamination within few minutes from the moment of sample arrival without the need of sample pretreatment.
Conclusions. The presented method of fl ow cytometric initial evaluation of microbial state of food industry
technological lines demonstrated its potential for developing a robust, routine method for the rapid and labor-saving detection of microbial contamination in food industry.
Key words: fl ow cytometry, microorganisms detection, microbial contamination, cell sorting
Flow cytometry calls the cell or particle, intercepted
by laser beam, an event and modern fl ow cytometers
are able to analyze up to 100 000 events per second
measuring several parameters (fl uorescence and light
scatter) for each event. The main advantage of fl ow cy-tometry is rapid, objective and fully automated meas-urement of single cell in the whole population and de-tection of trace subpopulations. Thus the application of fl ow cytometer constitute a powerful tool to rapidly enumerate microorganisms leading to simultaneous discrimination between viable, metabolically active and dead cells, which is of great importance in food processing. Compared to other analytical tools, where a single value for each parameter is obtained for the
whole population, fl ow cytometry provides data for
every particle detected [Comas-Riu and Rius 2009]. Flow cytometric measurement of microorganisms
concerns microbial cell identifi cation, cellular
mol-ecules interaction, multiparametric analysis of com-plex populations, study of environment variations
in-fl uence on microbial cells (the impact of antibiotics, bacteriocins and disinfecting agents) and evaluation of transformation process using reporter fl uorescent pro-teins as markers. Common cell parameters employed
in fl ow cytometric measurements of microorganisms
constitute cell membrane integrity allowing for live/ dead cell discrimination, differences in DNA and RNA structure, metabolic activity in the form of respiration in aerobic bacteria which can be detected using an indicator of oxidative metabolism such as a cyanodi-tolyl tetrazolium chloride (CTC), intracellular pH (po-tentially providing information about viability) with
the use of some fl uorescent probes such as
carboxy-fl ouorescein diacetate (CFDA) [Comas-Riu and Rius
2009]. Additionally fl ow cytometry offers an
opportu-nity to sort analysed cells, which is an invaluable asset for microbiology studies. It can be used to confi rm that a particular population is what you think it is, and for the isolation of target populations for further charac-terization [Veal et al. 2000].
Spoilage and pathogen microorganisms contami-nation of food products is a major concern of indus-tries involved in food transformation. The presence of microbial cells like bacteria, yeasts and moulds in
fi nal products can severely affect their quality, inde-pendently of their concentration. Detection of food contamination by microorganisms should be rapid and
informative thus the search for an ideal method focus-es on fi nding the procedure simple and labor-saving.
The aim of the present study was an evaluation of preliminary method enabling the rapid assessment of the state of microbial contamination in food industry with the particular emphasis on food processing lines being a source of food spoilage and responsible for production process interferences including the neces-sity to withdraw a fi nal product.
MATERIAL AND METHODS
Preparation of surface samples. The analysed
samples comprised smears from 3 different surfaces
(plastic belt and stainless steel conveyors) of techno-logical lines from fruit and vegetable processing com-pany from Greater Poland. Smears covered the area of 100 cm2 (10
× 10 cm). Swabs were placed in 3 ml of
1% PBS solution and transferred to fl ow cytometric
laboratory of Department of Biotechnology and Food Microbiology for analysis.
Organisms and growth conditions. Additional
analysis of one of the samples (sample 3) involved
mixing with yeast cells and subsequent fl ow
cytomet-ric measurement. Another analysis involved sample
fi ltration with the use of 0.45 m pore-size syringe
fi lter. Lyophilized cells of Saccharomyces cerevisiae
strain Red Star Ethanol Red (Lesaffre, France) were
added in a concentration of 0.5 g·l-1, corresponding
to 2.5 × 10⁶ cfu·ml-1 after inoculation, to the YPD
medium in a 500-ml Erlenmeyer fl ask and
incu-bated at 30°C overnight with orbital shaking at 125
RPM. After incubation 2 l (approx. 2 × 10⁵ cells)
of yeast culture were added to sample 3 and mixed by vortexing.
Flow cytometry protocols. Samples analysis were
performed directly (no pretreatment stage employed)
with fl ow cytometer (cell sorter) BD FACS Aria™III
(Becton Dickinson), equipped with 4 lasers (375 nm,
405 nm, 488 nm and 633 nm), 11 fl uorescence
from Becton Dickinson company. In analysis non-fl u-orescent parameters (forward and side scatter) were employed. FACSFlow solution (Becton Dickinson) was used as sheath fl uid. The confi guration of fl ow cy-tometer was as follows: 70 m nozzle and 70 psi sheath
fl uid pressure. The fl ow cytometry analyses were
per-formed by using logarithmic gains and specifi c
detec-tors settings. The threshold was set on the FSC signal. Data were acquired in a fi ve-decade logarithmic scale as area signals (FSC-A and SSC-A) and analysed with FACS DIVA software (Becton Dickinson). The popu-lations were defi ned by gating in the dot plots of FSC and SSC. Each sample was analysed in tetraplicates. Flow cytometric counts of events expected as bacte-rial cells were obtained by normalizing the numbers of events occurring in region on dot plots (gate P1) that defi ned the estimated bacterial cell population to the volume of sample analysed. Number of events in gate P1 for each sample constitute approximately 60% of all collected events. In order to assess the cellular content (bacteria and yeast cells) in analysed samples events were gated and sorted with the use of BD FACS Aria™III cell sorter. Sort regions were defi ned on bi-variate dot plot (FSC-A versus SSC-A) that delineated two distinct populations. Cell sorting preceded dou-blets discrimination procedure with the use of height versus width scatter signals measurement, in order to discriminate single events from conglomerates. Dou-blets discrimination procedure comprised two step gating of events to encompass low SSC-W population on SSC-H vs. SSC-W dot plot and low FSC-W popu-lation on FSC-H vs. FSC-W dot plot. Sorting involved singlets of P1 (singlets 1) and P3 gates (singlets 2). Sorted populations were then examined for the micro-bial cell content with the use of crystal violet staining and microscopic observations.
RESULTS AND DISCUSSION
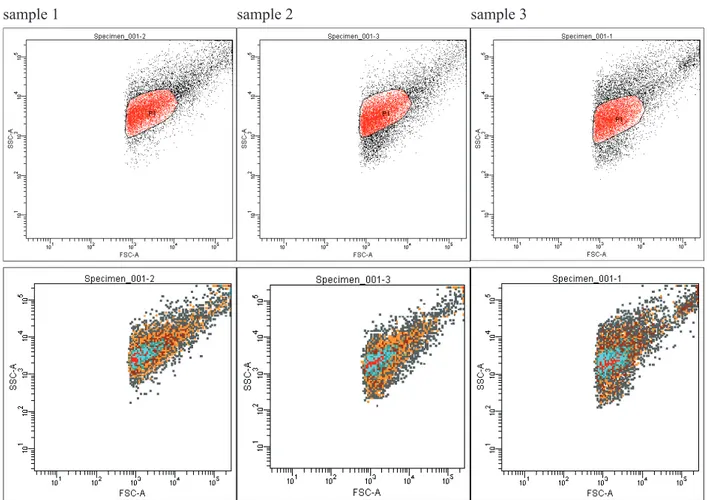
For three samples yielded from three different sur-faces of food industry processing lines estimated num-bers of microorganisms were measured using forward and side scatter signals gained as signal area (Fig. 1). Events from gate P1 (anticipated bacterial cells) were counted by normalizing the number of events to the volume of sample analysed. The number of events
counted was then converted to counts per cm2 of the
analysed surface. Means of estimated bacterial cell counts × cm-2 of the surface for three different samples
(sample 1, 2 and 3) demonstrates Figure 2. The com-parison of counted events from P1 gate normalized to the volume of sample analysed allows the evaluation of bacterial cell number within few minutes from the moment of sample arrival. The results of P1 gate event counts for samples 1, 2 and 3 revealed statistically sig-nifi cant differences in estimated bacterial cell numbers between samples. Sorting experiments performed for analysed samples aimed at discrimination between microbial cells and the background containing organic and inorganic particles. Populations selected for
sort-ing were defi ned on bivariate dot plot (FSC-A versus
SSC-A) that delineated two distinct populations. First population (gate P1) assumed to comprise bacteria en-compassed approximately P1 gate from the number
of events measurement. The second defi ned
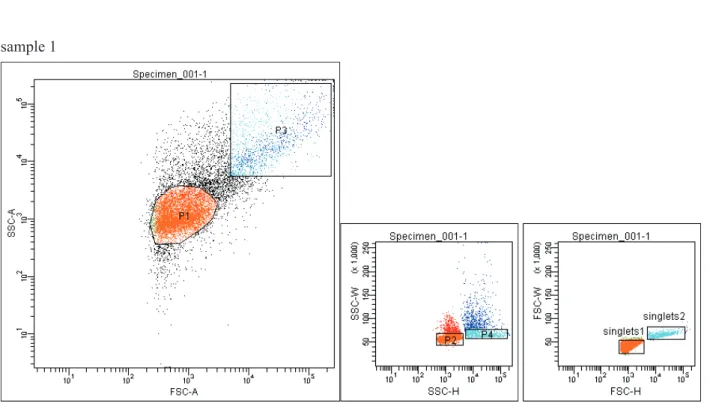
popula-tion (gate P3) evaluated as larger and more complex cells (yeast cells) demonstrated higher signals for FSC and SSC. The Figure 3 shows gated populations of sample 1, analysed and prepared for sorting – dou-blets discrimination procedure involved (gates P2 and singlets 1 as well as P4 and singlets 2 are hierarchi-cal gates derived from P1 and P3 gates respectively). Microscopic pictures of sorted events stained with crystal violet demonstrates Figure 4. Microscopic ob-servations revealed microbial cells: bacteria – events gated as singlets from P1 gate (singlets 1; Fig. 4 a, 4 b) and yeast – events gated as singlets from P3 gate (singlets 2; Fig. 4 c, 4 d), which constitute an evidence that calculated events comprise cells of microorgan-isms (mainly bacteria).
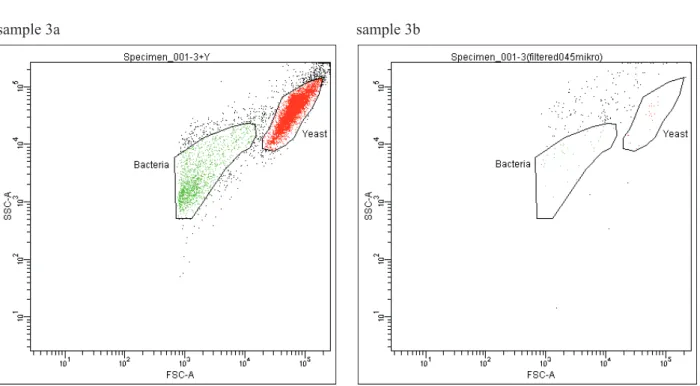
An additional analysis of one of the samples
(sam-ple 3) involving mixing with yeast Saccharomyces
cerevisiae cell culture and fi ltration of sample 3 with
the use of 0.45 m pore-size syringe fi lter were
sample 1 sample 2 sample 3
Fig. 1. Flow cytometric analysis of estimated microbial cell number in samples from 3 different surfaces of technological lines in fruit-vegetable processing company (samples 1, 2 and 3). Sample analysis were performed directly (no pretreatment
stage employed) with fl ow cytometer (cell sorter) BD FACS Aria™III (Becton Dickinson). In analysis forward scatter (FSC)
and side scatter (SSC) measurements were applied, data were collected as area signals (FSC-A and SSC-A) and analysed with FACS DIVA software (Becton Dickinson). FSC and SSC parameters are designated to cells size and complexity. The estimation of microbial cell count for each sample was conducted by normalizing the numbers of events occurring in
re-gion on dot plots (gate P1) that defi ned the estimated bacterial cell populations to the volume of sample analysed
Fig. 2. Means of estimated bacterial cell counts per cm2 of
the analysed surface. Samples were collected from three dif-ferent surfaces of fruit and vegetable processing company production lines (sample 1, 2 and 3). Each sample was an-alysed in tetraplicates. The comparison of counted events from P1 gate normalized to the volume of sample analysed allows the evaluation of estimated bacterial cell number within few minutes
0 500 1000 2000 2500
1500
sample 1
Fig. 3. Sorting of the analysed events from one of the sample (sample 1) in order to assess the cellular content (bacteria and
yeast) of samples. The fi rst sorted population expected to comprise bacteria (gate P1) encompassed approximately P1 gate
from the number of events measurement (FSC-A vs. SSC-A dot plot). The second population evaluated as larger and more complex cells (higher signals for FSC and SSC) was gated (gate P3). In both cases cell sorting preceded doublets discrimina-tion procedure with the use of height versus width scatter signals measurement, in order to discriminate single events from conglomerates (SSC-H vs. SSC-W and FSC-H vs. FSC-W dot plots). Gates P2 and singlets 1 as well as P4 and singlets 2 are hierarchical gates derived from P1 and P3 gates respectively. Sorting involved singlets of P1 (singlets 1) and P3 gates (singlets 2). Sorted populations were then examined for the microbial cell content with the use of crystal violet staining and microscopic observation
This is an anticipated consequence of yeast cells being larger and more complex compared to bacterial cells.
The present work is an innovative approach to rapid and labor-saving detection of microorganisms directly on the surfaces of production lines. This preliminary analysis of microbial contamination of technologi-cal lines in food industry, which was performed with
the use of a fl ow cytometer, demonstrated a
consider-able potential for the rapid assessment of the micro-biological state of surfaces involving food processing. The method presented in this study does not require any time-consuming pre-treatments. The analysis ena-bled only the estimation of the number of microbial cells but the time needed for analysis to take place was much shorter than in the case of traditional microbio-logical methods, including microscopic observation.
Techniques based on fl ow cytometric principles are
routinely applied in the dairy industry for measuring the total bacterial count within a few minutes [Guna-sekera et al. 2000, 2003]. Even with the use of fl
uores-cent staining procedures the results of fl ow
cytomet-ric approach can be obtained in 20-30 min [Assuncao et al. 2007]. An example of the simplicity of detec-tion methods is the cytometric differentiadetec-tion between Gram positive and negative bacteria. A combination
of two DNA binding fl uorescent dyes is employed for
WGA binds to N-acetylglucosamine in the peptidog-lycan layer of the cell wall of Gram-positive bacte-ria whereas HI binds to the DNA of all bactebacte-ria after permeabilization by EDTA and incubation at 50°C for 15 min [Holm and Jespersen 2003]. Using WGA in-stead of SYTO 13 and treating the cells with EDTA allows the latter technique to be used directly in milk samples without precultivation of the sample [Holm and Jespersen 2003, Holm et al. 2004]. Another low-complex method that can be employed for microbial cell characterization is the mentioned use of redox potential indicators such as cyanoditolyl tetrazolium chloride (CTC). In combination with dyes enabling
the live/dead cell discrimination this technique consti-tutes a rapid and, thus, powerful tool in the estimation of microbial cell content and their metabolic potential in an analysed sample. Further stage of the designed experiment engages the use of fl uorescent cell staining in order to discriminate between cells and the back-ground, as well as to assess the viability and metabolic activity of microbial cells.
Flow cytometry application in food industry in-volves characterization of microbial populations detecting live, dead or metabolically active cells. Recent studies have shown that the viable or active but non-cultivable forms of microbes are becoming
of increasing concern in environmental microbiol-ogy including technological surfaces of food industry. A formation of active but non-cultivable state, where the cell remains capable of undergoing metabolic ac-tivity but cannot be detected by cultivable methods, constitute a feature of non-sporulating microorgan-isms [Barer et al. 1993, Rozak and Colwell 1987, Mc-Dougald et al. 1998]. This phenomenon was largely demonstrated based on the discrepancies observed be-tween culturing methods and non-culture-based stain-ing techniques [Baudart et al. 2002, McNamara et al. 2002, Rice et al. 2000]. Production lines are believed to constitute a rich source of microbes, which remains largely undetected using cultivable methods. Flow cytometry being a non-culture dependent technique, should be able to differentially measure the active but non-cultivable bacteria [Sachidanandham et al. 2005].
Particular signifi cance has an evaluation of
mi-crobial state on the surface of food industry techno-logical lines. These elements comprise the source of
contamination on different stages of food processing thus the compilation of rapid and labor-saving meth-ods enabling the analysis of cleaning and disinfecting procedures effi ciency, is essential from the economic point of view and might interest food production com-panies. The rapid analysis of the surface of food tech-nological lines leading to monitoring of the production process allows selection of optimal cleaning and disin-fecting agents and procedures [Juzwa 2011]. Methods for rapid detection of microbial contamination enable primary preventing of production failures as a conse-quence of any occurring contamination or disruption.
CONCLUSIONS
Food industry production lines can be the source of bacterial contamination on different stages of the manufacturing process, meaning that the compila-tion of time and labor-saving methods, allowing the analysis of cleaning and disinfecting procedures effi -ciency, is essential also from the economic point of
sample 3a sample 3b
Fig. 5. An additional fl ow cytometric analysis of sample 3, which involved mixing with yeast Saccharomyces cerevisiae
cells culture (sample 3a) and sample fi ltration with the use of 0.45 m pore-size syringe fi lter (sample 3b). Both analysis
view. The signifi cant advantage of fl ow cytometric analysis comprise the opportunity of omitting the cul-tivation step and the multi-parametric measurement of various features of microbial cells including species or strain identifi cation. The use of fl ow cytometer in food industry enables monitoring of different stages of production process leading to reduction of process interferences associated with the production arrest or the necessity to withdraw a fi nal product.
Method of fl ow cytometric initial evaluation of micro-bial state of food industry technological lines suggested in this study represents an innovation. Its application for the time being is limited as costs of instrument purchase are still considerable. However the accessibility of fl ow cytometers increases and their prices diminishes making
fl ow cytometric detection of microorganisms an alterna-tive in the near future. This work constitute a fi rst step in developing a robust, routine fl ow cytometric method for the rapid detection of microbial contamination in food industry. Next step involves the fl ow cytometric detec-tion of metabolic state and viability of microbial cells with the use of fl uorescent staining.
SUMMARY
The possible applications of fl ow cytometry in
food industry involve the microbiological analysis of food production processes including the state of tech-nological lines. Determination of microbial state of the production lines surface is crucial for detailed evalu-ation of contaminants. Flow cytometry has become a valuable tool in food microbiology allowing the reduction of time required for analysis and monitor-ing food processmonitor-ing stages from raw material to fi nal product release.
REFERENCES
Assuncao P., Davey H.M., Rosales R.S., Antunes N.T., de la Fe C., Ramirez A.S., Ruiz de Galarreta C.M., Poveda J.B., 2007. Detection of mycoplasmas in goat milk by
fl ow cytometry. Cytometry 71 A, 1034-1038.
Barer M.R., Gribbon L.T., Harwood C.R., Nwoguh C.E., 1993. The viable but non-culturable hypothesis. Rev. Med. Microbiol. 4, 183-191.
Baudart J., Coallier J., Laurent P., Prevost M., 2002. Rap-id and sensitive enumeration of viable diluted cells of
members of the family Enterobacteriaceae in freshwa-ter and drinking wafreshwa-ter. Appl. Environ. Microbiol. 68, 5057-5063.
Comas-Riu J., Rius N., 2009. Flow cytometry applica-tions in the food industry. J. Ind. Microb. Biotechn. 36, 999-1011.
Gunasekera T.S., Attfi eld P.V., Veal D.A., 2000. A fl ow
cy-tometry method for rapid detection and enumeration of total bacteria in milk. Appl. Environ. Microbiol. 66, 1228-1232.
Gunasekera T.S., Dorsch M.R., Slade M.B., Veal D.A.,
2003. Specifi c detection of Pseudomonas spp. in milk by
fl uorescence in situ hybridization using ribosomal RNA
directed probes. J. Appl. Microbiol. 94, 936-945.
Holm C., Jespersen L., 2003. A fl ow cytometric
Gram-stain-ing technique for milk-associated bacteria. Appl. Envi-ron. Microbiol. 69, 2857-2863.
Holm C., Mathiasen T., Jespersen L., 2004. A fl ow
cyto-metric technique for quantifi cation and differentiation
of bacteria in bulk tank milk. J. Appl. Microbiol. 97, 935-941.
Juzwa W., 2011. The application of fl ow cytometry in
mod-ern food analysis. Przem. Spo . 65, 2, 41-44.
Mason D.J., Shanmuganathan S., Mortimer F.C., Gant V.A.,
1998. A fl uorescent Gram stain for fl ow cytometry and
epifl uorescence microscopy. Appl. Environ. Microbiol.
60, 2681-2685.
McDougald D., Rice S.A., Weichart D., Kjelleberg S., 1998. Nonculturability: Adaptation or debilitation? FEMS Mi-crobiol. Ecol. 25, 1-9.
McNamara C.J., Lemke M.J., Leff L.G., 2002. Culturable and non-culturable factions of bacterial populations in sediment of a South Carolina stream. Hydrobiologia 482, 151-159.
Rice S., McDougald A., Kjelleberg S., 2000. Vibrio vulnifi
-cus: A physiological and genetic approach to the viable but nonculturable response. J. Infect. Chemother. 6, 115-120.
Rozak D.B., Colwell R.R., 1987. Survival strategies of bac-teria in the natural environment. Microbiol. Rev. 51, 365-379.
Sachidanandham R., Karina Yew-Hoong Gin, Chit Laa Poh, 2005. Monitoring of active but non-culturable bacterial
cell by fl ow cytometry. Biotechn. Bioeng. 89, 1, 5.
Shapiro H.M., 2003, Practical fl ow cytometry. J. Wiley.
Veal D.A., Deere D., Ferrari B., Piper J., Attfi elda P.V.,
2000. Fluorescence staining and fl ow cytometry for
CYTOMETRYCZNA ANALIZA ZANIECZYSZCZEŃ MIKROBIOLOGICZNYCH LINII TECHNOLOGICZNYCH W PRZEMYŚLE SPOŻYWCZYM – STUDIUM WSTĘPNE
STRESZCZENIE
Wprowadzenie. Cytometria przepływowa jest alternatywą dla klasycznych sposobów identyfi kacji i analizy
mikroorganizmów, w szczególno ci metod hodowlanych. Pozwala na wykrywanie patogenów oraz innych
niepo ądanych mikroorganizmów bez konieczno ci ich hodowli, czyli bezpo rednio w pobranym materiale
(woda, odpady oraz ywnoć, np. mleko, wino, piwo). Prowadzi to do znaczącego skrócenia czasu trwania
analizy, pozwalając na monitorowanie procesów produkcji i szybką reakcję w przypadku pojawienia się
za-ka eń lub jakichkolwiek zakłóceń. Poza analizą surowców oraz produktów na ró nych etapach procesu ich
wytwarzania, cytometria przepływowa jest idealnym narzędziem do oceny zanieczyszczeń
mikrobiologicz-nych powierzchni linii technologiczmikrobiologicz-nych.
Materiał i metody. W prezentowanej pracy próbki – stanowiące wymazy z trzech powierzchni linii
tech-nologicznych zakładu przetwórstwa owocowo-warzywnego z terenu Wielkopolski – były analizowane bez-po rednio z zastosowaniem cytometru przepływowego. Okre lanym parametrem było rozproszenie wiatła lasera mierzone przez przedni oraz boczny detektor wiatła rozproszonego, co umo liwiło oszacowanie ilo ci komórek mikroorganizmów w pobranych próbkach.
Wyniki. Cytometryczna analiza powierzchni linii produkcyjnych przemysłu spo ywczego pozwala na wstęp-ne okre lenie zanieczyszczenia mikrobiologiczwstęp-nego w czasie kilku minut od momentu przywiezienia próbki, bez konieczno ci jakiejkolwiek obróbki.
Wnioski. Zaprezentowana analiza wstępnego okre lania stanu mikrobiologicznego linii technologicznych
w przemy le spo ywczym z zastosowaniem cytometrii przepływowej wykazała mo liwoć opracowania
so-lidnej, ułatwiającej wykorzystanie rutynowe, metody detekcji zanieczyszczeń mikrobiologicznych w
prze-my le spo ywczym.
Słowa kluczowe: cytometria przepływowa, detekcja mikroorganizmów, zanieczyszczenia mikrobiologicz-ne, sortowanie komórek
Received – Przyjęto: 10.10.2011 Accepted for print – Zaakceptowano do druku: 29.11.2011 For citation – Do cytowania